Quality of the Environment in Japan 1995
(4) Activities and philosophy toward making modern civilization sustainable
Now, based on the presumption that we today live in the midst of a civilization with scientific technology developed to an advanced state and with high productive capability, how do we go about constructing a sustainable society based on this philosophy?
In our modern civilization, which is losing its sustainability, there have been a number of attempts made in various advanced countries to build sustainable societies that protect the environment. One recent example is the Closed Substance Cycle and Waste Management Act (Kreislaufwirtschafts und Abfallgesetz) that went into effect in Germany in July 1994. The concept behind this law is not "waste disposal," but "closed substance cycles." The basic philosophy of the law is to "think waste," and basically, whoever produces, markets and consumes goods is responsible for avoidance, recycling, reuse and environmentally-sound disposal of the waste which thereby arises. It follows that in decisions on production and consumption, we look at the question of what will happen to this product at the end of its life cycle. To promote an economy based on closed substance cycles and geared towards taking care of natural resources, the following obligations are being introduced: 1) as a matter of priority, waste is to be avoided; 2) where avoidance is not possible, waste is to be recovered as its component substances or as energy ("waste for recovery") : and 3) where recovery is also impossible, waste must be disposed of in an environmentally-friendly way ("waste for disposal").
This legal system incorporating this kind of philosophy could be said to demonstrate a stance that seeks to change the modern civilization of mass production, mass consumption, and mass disposal into a sustainable one that recognizes the limits on the environment.
Twenty years after the 1972 announcement of "Limits to Growth," the Meadows report, announced in 1992 under the title of "Beyond the Limit," states the following.
1) Human use of many essential resources and generation of many kinds of pollutants have already surpassed rates that are physically sustainable. Without significant reductions in material and energy flows, there will be in the coming decades an uncontrolled declining in per capita food output, energy use, and industrial production.
2) This decline is not inevitable. To avoid it, two changes are necessary. The first is a comprehensive revision of policies and practices that perpetuate growth in material consumption and in population. The second is a rapid, drastic increase in the efficiency with which materials and energy are used.
3) A sustainable society is still technically and economically possible. It could be much more desirable than a society that tries to solve is problems by constant expansion. The transition to a sustainable society requires a careful balance between long-term and short-term goals and an emphasis on sufficiency, equity, and quality of life rather than on quantity of output. It requires more than productivity and more than technology; it also requires maturity, compassion and wisdom.
In this book, an example is presented of the destruction of the fishing industry by technology and the market. In other words, technology allowing the taking of fish in large volumes, combined with market mechanisms that actually encouraged the decline of resources, served to invite over fishing, and drove the fishing industry itself into danger. It could be said that a philosophy of aiming toward sustainable utilization without damaging the ecological organization or the natural cycle is a necessary direction for us moderns to take.
The Basic Environment Law, based on the concept of a new environmental policy for Japan in this age of the global environment, was adopted in November 1993. And The Basic Environment Plan, designed to implement this concept in specific planning form, was passed by the Cabinet in December 1994. The plan established four goals, including "building a socioeconomic system fostering environmentally sound material cycles," "harmonious coexistence between nature and humankind," "participation by all sectors of society sharing fair burden" and "promoting international activities." These four goals will help aim toward creation of a society where sustainable development is possible. "Sustainable development" was expressed by four specific goals, under which policies were to be developed.
This idea of aiming toward "closed material circulation" and "harmonious coexistence" could be said to be a return to the basic fact that we are but one member of the global ecological system, in recognition that human socioeconomic activities have become increasingly separated from what is sustainable. In addition, "participation" and "international activities" could be said to be essential points needed to change modern civilization as a socioeconomic system into something that is sustainable.
3. Future Prospects
As was shown above, the idea of "sustainable development" has been confirmed in international agreements, and an Action Plan based on that has been drawn up. Here in Japan, we adopted The Basic Environment Plan that more specifically showed that philosophy. Nevertheless, because our civilization itself historically possesses the property of developing through expanded use of the environment, it will not be easy to shift the shape of a socioeconomy that has been shaped by this presumption of expansion into a truly sustainable shape.
Meanwhile, the population continues to increase, and is predicted to break through ten billion people by the middle of the 21st century, according to medium estimates by the United Nations. Moreover, economic growth and rising standards of consumption, which do not show sufficient consideration for the environment, mean that resource consumption per person and environmental loads will continue to increase. Energy consumption, too, is continuing to rise, and although the advanced nations agreed to work on restraining carbon dioxide emissions, they have not as of the present time been able to show sufficient results. In the developing nations already faced with large populations, and where economic growth due to future industrialization is expected to progress, populations are expected to grow still more, and emission volumes of carbon dioxide to rise sharply. Production and consumption of various things is expected to continue to rise, which means that waste materials will probably continue to increase as well.
But if we humans intend to continue to survive, and if we intend to pass on to our descendants the environment that is the foundation for survival, then we will have to strive toward achieving a society where sustainability is possible, even if it is difficult.
If we keep going as we have, the population will continue to rise, consumption of resources and the burden on the environment will continue to increase, and, internationally, the gap between the advanced nations and the developing nations will widen still more. Moreover, population increases in the developing nations will accelerate, and that will result in further damage to the environment, and the problems will become ever more difficult to resolve. To avoid this kind of situation, we modern people, and particularly those of us in the advanced nations who have the biggest responsibility for increasing the burden on the environment, must work to close the gap with the developing nations and to severely clamp down on any more increase in the burden on the environment, and to build a society where sustainable development is possible. Building this kind of society will require a reconsideration of the modern civilization of mass production, mass consumption, and mass disposal. And we must change our civilization into a sustainable one which has a socioeconomic system that fosters an environmentally sound materials cycle, where humankind and nature coexist harmoniously.
Orangutan (endangered species)

Cape Sunion, Greece:

Temple of Poseidon, circa 440 B.C, marble, floor area 13.47X31.12 meters, Dorian style. Existing temple said to have been reconstructed in latter of half of 5th century B.C. Except for a few bushes, the surroundings are totally bare mountain.
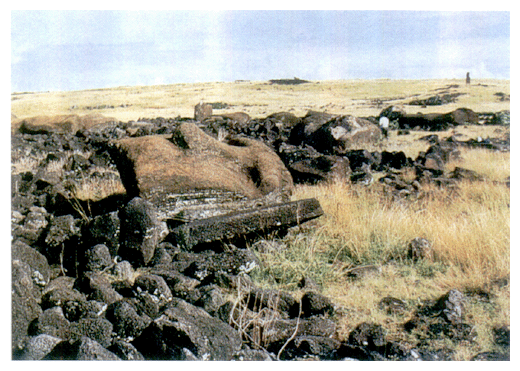
Easter Island today (1992)
Chapter2. Sustainable Development in the Asia-Pacific Region
Japan's environment is just a minor fraction of the global environment as a whole. But when we consider today's environmental problems possess width in terms of time and space, it is impossible to think about Japan's environment in isolation from the environments of other nations. Protection of this global environment is a common topic for humans that cannot be resolved in just one country, and Japan also is expected to be actively internationally engaged in a way that is worthy of the position we hold in international society. The Basic Environment Plan takes a global viewpoint towards promotion of protection of the global environment, and seeks to promote wide-ranging cooperation with every country around the world and with international organizations.
If we take the viewpoint of the Asia-Pacific region within the world, the Asia-Pacific region is an area that has a historically and geographically close relationship with Japan, and is also a region that is expected to see a dramatic increase in the burden on the environment in the course of the rapid economic growth expected in the future. Moreover, from the viewpoint of protecting the global environment, it would not be too much to say that this region holds the key to whether humans will in the future be able to achieve sustainable development. For this reason, it will be necessary for Japan to play a pioneering role in the various places of discussion in the Asia-Pacific region and to aim together for sustainable development in the region by attempting linkups with the environmental policies of each country in the region, and by promoting protection of the global environment.
Based on this viewpoint, we shall in this chapter focus on the Asia-Pacific region so as to understand the present state of the environment in the region, attempt a look forward to the 21st century, and then consider the role that Japan should play in the achievement of sustainable development. Note that the Asia-Pacific region is often defined as the region of countries that are members of ESCAP (United Nations Economic and Social Commission for Asia and the Pacific), from which United Nations data is commonly recognized, and will in this chapter generally be referring to this ESCAP region of countries, and centering on East Asia and Southeast Asia.
Section1. Current State of the Environment in the Asia Pacific Region
The Asia-Pacific region, given in terms of member nations of the ESCAP region, refers to a sprawling range that spreads from Mongolia in the north to New Zealand in the south, the Cook Islands in the east, and Armenia in the west, and encompasses an extreme variety of climates and customs that stretch from tropical zones to frigid zones and from the Himalayas to coral reef islands. In addition to that geographic extensiveness, it is also a region colored with historical, cultural, and ethnic diversity, as well as a variety of systems that reveal differing stages of development both politically and economically. Moreover, the Asia-Pacific region has for the past 20 years shown continuous economic growth at a speed that other regions have not been able to match, to the point that it has been called a "world economic growth center." The region is also forecast to exhibit the highest economic growth in the world in the years leading to the 21st century, and is expected to serve as an engine for growth for the world economy.
Characteristics of the Asia-Pacific region include the world's largest population, economic growth that is the highest in the world, and rich natural resources of diverse economies, societies, and natural environments, as well as tropical rainforests and marine resources. Moreover, characteristics in recent years include the appearance of new economic growth centered on the South China economic zone, more trading activity within the region, and a rising degree of intra-regional mutual dependence. On the other hand, rapid economic growth and a rising population are concentrating population in the cities, which is worsening the urban pollution problems, and there are deep concerns about the appearance of new environmental problems that spread all across the region, including global warming, acid deposition, and other problems of either a global scale or which surpass national boundaries. In this section, we shall detail the characteristics of the Asia-Pacific region within the world at large, examine the relation ship between these characteristics and environmental problems, and look at the current state of the environment.
1. The Asia-Pacific Region within the World at Large
(1) High growth potential and diversity of economy
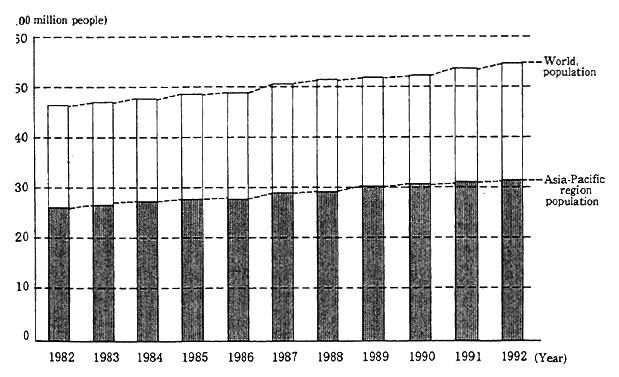
According to United Nations statistics, the world's population was about 5.48 billion people in 1992, of which the Asia-Pacific region accounted for a population of about 315 billion people, or more than half that for the whole world (Figure 2-1-1). On the other hand, the scale of the economy in the Asia-Pacific region was a GDP of $3,481 trillion in 1991 ($2,001 per capita of GDP), accounting for one-sixth of the world's total GDP. And in terms of energy production, world production volume in 1991 was 11,427 billion joules, while the production volume for the Asia-Pacific region was 2,353 billion joules, about one-fifth of the world's energy production. These figures hint at the potential for economic growth in the region and, in fact, whereas the world's economic growth rate in real GDP was 2.3% in 1993, the United Nations estimates that the real GDP growth rates for developing nations who are members of ESCAP maintained a high growth rate of 6.7%.
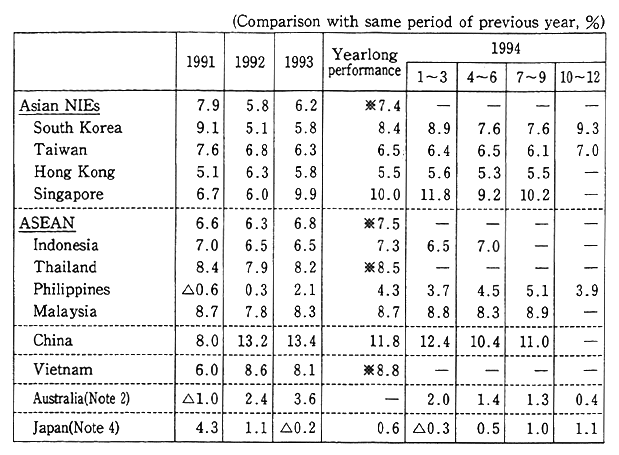
All countries within the Asia-Pacific region do not necessarily maintain the same kinds of growth rates, as for example, the OECD/ DAC classifications (as of December 1994), which, excluding Japan and other advanced industrialized nations, is composed of countries at a wide variety of development stages, including Taiwan and Singapore as high-income nations, South Korea and Malaysia as medium-high-income nations, Thailand as a low-to medium-income nation, and Indonesia, Phillippines, and Vietnam, as well as China and India, as low-income nations (Table 2-1-1). In particular, the growth economies of East Asia have seen their trade and direct investment become more active under outward-looking economic policies that include trade liberalization and relaxation of foreign investment regulations, and they have developed export-oriented economic growth. From the Asian NIES (Newly Industrializing Economies) to ASEAN (Association of Southeast Asian Nations), and on to China, as the least less developed countries progressively catch up with the developing countries, while the developing countrien change their own industrial structures, in side-by-side type economic growth.
Fig. 2-1-1 World and Asia-Pacific Population Trends
Source: United Nations, Statistical Yearbook for Asia and the Pacific, New York
Notes: 1. World population includes Albania, China, People's Democratic Republic of Korea, and Vietnam.
2. The Asia-Pacific population is the population of ESCAP member countries, including Australia, Bangladesh, Brunei, Cambodia, Fiji, Hong Kong, India, Indonesia, Iran, Japan, Malaysia, Mongolia, Myanmar, Nepal, New Zealand, Pakistan, Papua New Guinea, Philippines, South Korea, Singapore, Sri Lanka, and Thailand.
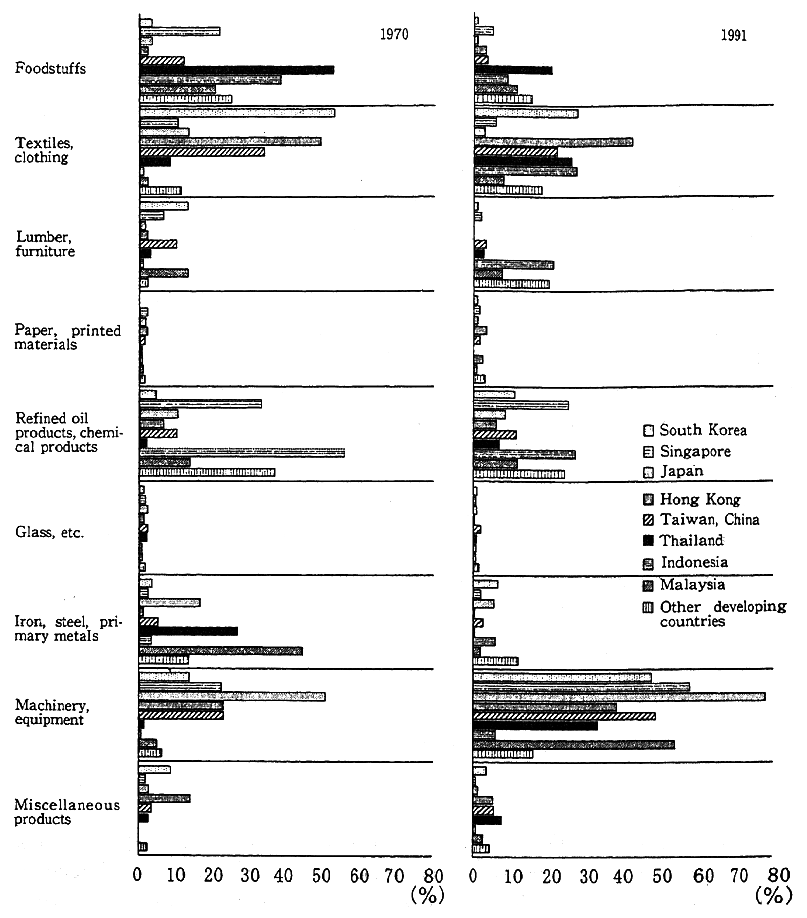
This kind of diversity in economic growth stages is mutually linked to the diversity of characteristics in the local society and nature. Each country's industrial structure possesses a diversity that focuses on primary industries such as agricultural products and natural resources, on manufacturing, and on service industries. For example, there is within the manufacturing industry a wide variety of industries, including textiles, chemicals, steel, and machinery, all of which forms a complex diversity (Figure 2-1-2).
(2) High degree of mutual dependence within the region
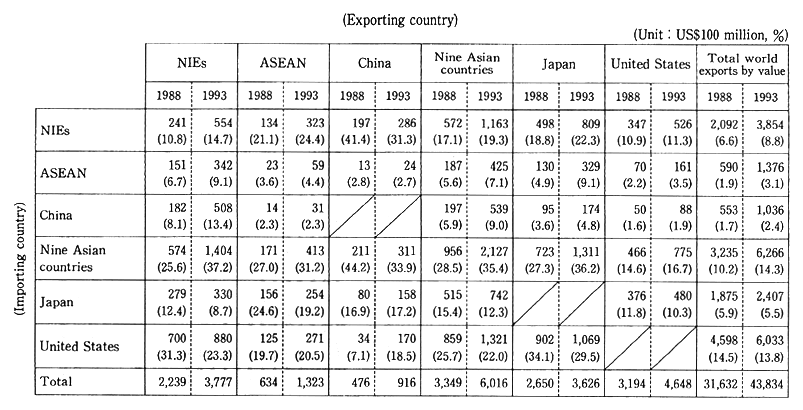
Economic growth in the Asia-Pacific region, and particularly in the East Asia region, was fostered by efficient utilization of production factors, in the form of trade and investment between countries that were in vastly different situations in terms of technology and other production factors. This international division of labor began with a division of labor between the advanced nations and the NIES, then expanded to divisions between the advanced nations and ASEAN, and between the NIBS and ASEAN, all of which resulted in a rapidly rising degree of mutual dependence within the Asia-Pacific region and accelerated economic growth. At the present time, mutual dependence relation-ships within the region are taking shape in a number of forms, beginning with trade, and extending to direct foreign investment, economic aid, technological cooperation, and personnel exchanges (Table 2-1-2). Sustaining this growth in the Asia-Pacific region in the future will require simultaneously expanding intra-regional markets and deepening the division of labor structure, while also using APEC to promote moves toward liberalization. The resulting trade and investment should further deepen the mutual dependence relationships within the region.
Table 2-1-1 Economic Trends in the Asia-Pacific Region (Net-GDP Growth Rates)
Reference: Prepared from statistics by each country. Figures for each group of countries are from Asian Development Bank Report of April 1995.
Notes: 1. Of the 1994 figures, figures with asterisk are Asian Development Bank forecasts.
2. Australia growth rates are compared with previous term.
3. ASEAN figures include Vietnam, Laos, and Cambodia.
4. Statistics from Department of National Accounts, Economic Research Institute, Economic Planning Agency.
Fig. 2-1-2 Product Export Composition for Asian Countries in, 1970 and 1991
Reference: UN data
Source : World Bank,"East Asian Miracle"
Table 2-1-2 Mutual Exports by Value between Asia, Japan, and the United States (Exnorting country)
Reference: Based on export country statistics from IMF, "Direction of Trade Statistics", prepared by Sakura Institute of Research Incorporated
Note : Figures are exports by value from exporting countries (top) to importing countries(left). Figures in parentheses are share(%) of total exports by value.
(3) Industrialization-related pollution problems
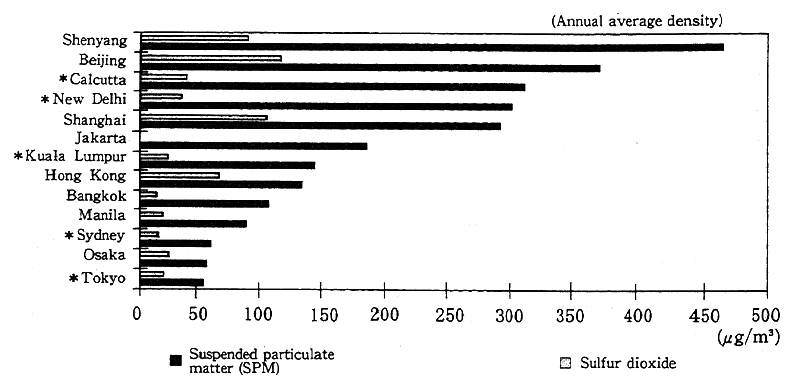
There are many countries in the Asia-Pacific region that are rapidly proceeding with industrialization and achieving economic growth. These countries are faced with the same kind of serious industrialization-related pollution problems experienced by the advanced nations. Despite the fact that waste gases, waste water, and waste materials emitted from plants and other facilities increase as industrialization progresses, a low priority for environmental policy and a lack of consideration for the environment means that pollution preven tion measures fail to keep up, and pollution problems become serious, including air pollution caused by sulfure oxides and other pollutants, and water and soil pollution caused by waste materials, heavy metals, and other noxious substances. In a glance at air pollution, for example, we find that Shenyang, New Delhi, Jakarta, Kuala Lumpur, and other cities all exhibit high densities of suspended particulate matter, while Beijing and Shanghai show high. densities of sulfur dioxide (Figure 2-1-3).
Fig. 2-1-3 State of Air Pollution in Major Asian Cities in1987-1990 * 1983-1986
Reference: World Bank: World Development Report, 1992
Source : The Environment Program of the Asian Development Bank: Past, Present and Future, April 1994
(4) Population concentrations in the cities and worsening environments
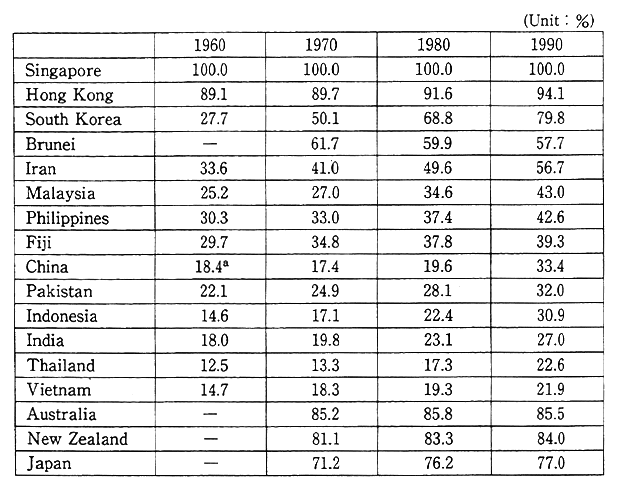
Table 2-1-3 Trends in Urban Population Ratios in Asia-Pacific Region, 1960-1990
Reference:1. 1970, 1980, 1990, a-1964 United Nations(1991) World Urbanization Prospects, 1990, New York, Department of International Economic and Social Affairs Sales NO. E.91 XIII. II) p.142 and 106, Republic of Korea Population & Housing Census Report, National Statistical Office, 1992.
Source: 1. 1970, 1980, 1990 ESCAP, State of Urbanization in Asia and the Pacific
1993
2. 1960 United Nations, Economic and Social Survey of Asia and the Pacific, 1993
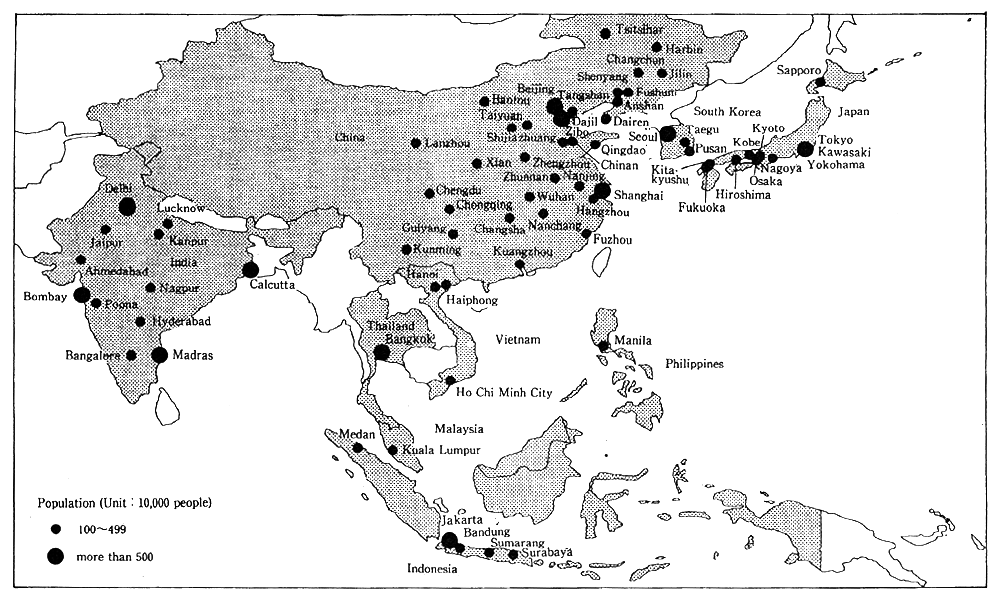
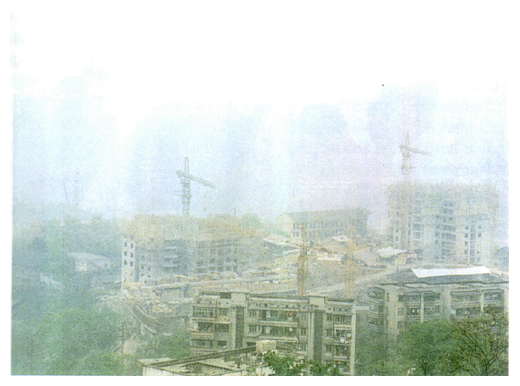
Populations are progressively concentrating in the major cities of the Asia-Pacific region. For example, where the urban population of South Korea was a 50.1% ratio in 1970, it had risen to 68.8% in 1980, and to 79.8% in 1990, and as can be seen in Malaysia, where the percentages were 27.0% in 1970, 34.6% in 1980, and 43.0% in 1990, urban population ratios are rising (Table 2-1-3). This population concentration into the cities is putting serious pressure on the urban environment, and many cities in the Asia-Pacific region are faced with serious environmental problems (Figure 2-1-4). According to an ESCAP report on the state of the environment in the Asia-Pacific region in 1990, environmental problems accompanying urbanization include water pollution caused by residential waste water, air pollution caused urban concentrations of automobiles, and waste material disposal problems. On top of that, expansion of cities is reducing the area of surrounding fertile agricultural land and forests, while shortages of basic urban infrastructure such as residential space and water and sewer lines are resulting in a worsening living environment.
(5) Poverty and worsening environment
Poverty as a result of worsening environment has become a major problem for local rural and urban areas in the Asia-Pacific region. The ESCAP report mentioned above notes, for example, that while only about 30% of the world's total arable land exists within the Asia-Pacific region, 72% of the world's agricultural population live there. On top of that, the agricultural land area is expanding slower than the rapidly rising population, with the result that the agricultural land area per agricultural worker is decreasing, and the number of landless farmers is rising. This problem is a factor in the flow of population into the cities, and is also driving poor farmers who do not possess land into tilling poorly productive hillside land, which in turn worsens soil erosion, leading to flooding and also water pollution in low-lying areas. Moreover, invading the forests to conduct unsustainable agriculture reduces and weakens the forests, and leads to declining productivity of the land. It is also feared that declining, weakened forests will affect the ecology.
In cities, meanwhile, the poor classes residing in slums are the ones who most feel the effects of urban environmental problems. The people in the poor classes, affected by worsening urban environments, such as environmental pollution in neighborhoods surrounding industrial districts where few environmental measures have been taken, or declining health due to unsanitary water and unsuitable sanitary facilities, are particularly affected (Table 2-1-4).
Fig. 2-1-4 Major Cities and Their Population in the Asia Region
Reference: National Institute for Environmental Studies
Note : National boundaries: World Data Bank II (prepared by U. S. CIA) Population The Times Atlas of the World, 1992
Table 2-1-4 Ratio of Population in Major Asia-Pacific Countries with Access to Safe Water and Sanitary Facilities
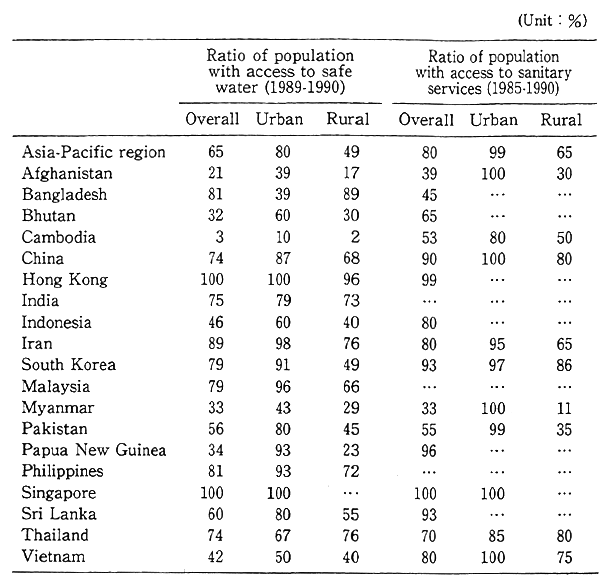
Reference ESCAP secretariat, based on "Survey of the quality of life on health in the ESCAP region" by Yawarat Porapakkham, M.D., a paper presented at the Expert Group Meeting on a Survey of the Quality of Life in the ESCAP Region, Seoul, 11-15 August 1992.
Source : United Nations: Economic and Social Survey of Asia and the Pacific, 1993.
(6) New environmental problems on a global scale or stretching across the region
Energy consumption in the Asia-Pacific region is expected to increase in concert with the rise in population and economic growth. Rising consumption of fossil fuels is raising concerns that air pollutants will result in worsening environments and acid deposition, while increased emissions of greenhouse gases will lead to global warming.Coastal regions are feared to be particularly susceptible to the effects of rising sea levels as global warming proceeds. Moreover, the Asia-Pacific region is home to diverse ecologies, some of which have become very fragile due to the effects of human activities in forest decline and soil degeneration. There are also fears about the effects of marine pollution and the decline in species diversity. Economic growth in Asia-Pacific region is predicted to keep on accelerating in the future, and it is thus a region that dan expected to see the appearance of new environmental problems that are either on a global scale or which stretch across the region.
Development and air pollution conditions viewed near Chongqing, china
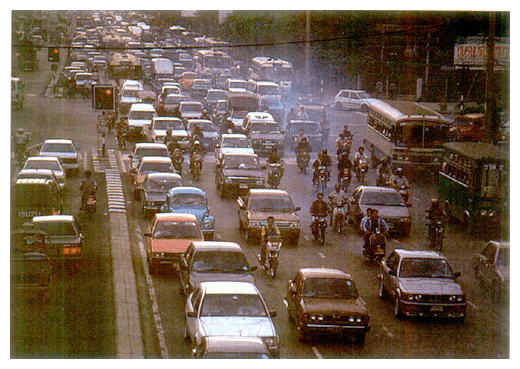
Chronic traffic congestion on city streets (Bangkok, Thailand)
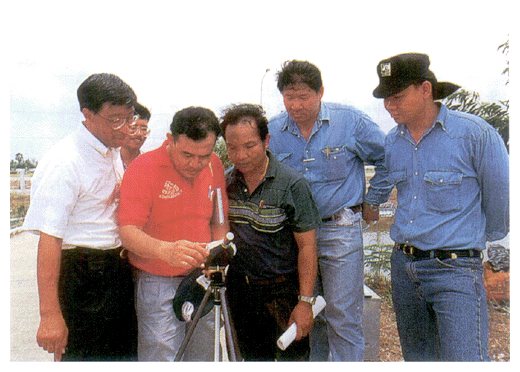
Japanese experts conduct technology transfer at Thailand's Environmental Research and Training Center (noise measurement).
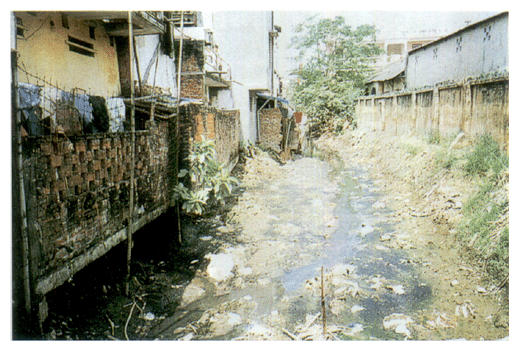
Water pollution condition in the suburbs of Hanoi, Vietnam
2. Current State of the Environment in Each Country of the Asia-Pacific Region
China has seen phenomenal economic growth these past few years, and environmental problems are beginning to appear along with the industrialization and urbanization. In South Korea, aiz pollution and water pollution caused by the concentration of population into the cities and rapid irdustrialization has become a problem. In Indonesia, water pollution and other problems are arising in Java, Bali, and other islands in that counyry's central archipelago because of increasing population and population inflow as development proceeds. In Malaysia, water pollution and toxic wastes are leading to a worsening environment as industrialization and urbanization proceed. In Thailand, environmental problems such as water and air pollution that are caused by industriali-zation and urbanization, particularly in the capital region around Bangkok, are beginning to appear, along with forest decline and soil degeneration.
Except for occasions when particular sources are mentioned, the following figres and notes representing the state of the environment in the Asia-Pacific region are, in the case of China, based on the 1993 official report on the state of the environment in China, and in the case of other countries (excluding Vietnam), based on national reports prepared by each participant in the Conference on the State of the Environment in the Asia-Pacific Region convened in ESCAP member nations. While the figures and notes representing the state of the environment are not limited to the specific conditions and environmen-tal problems in the nations of China, South Korea, Indonesia, Malaysia, the Philippines, and Thailand, they can be taken as reference points in considering the characteristics of environmental problems in the Asia-Pacific region. (Due to source differences, please note that the figures in the text derived from data in each country's national reports may not necessarily match figures given in the figures and tables.)
(1) Air pollution
In such urban areas as Jakarta, Seoul, Manila, and Bangkok, air pollution caused by automobile exhaust gases is said to be becoming a major problem (Table 2-1-5). Gas emissions from plants in industrial zones are also contributing to pollution.
Table 2-1-5 Trend in Automobile Numbers in Major Asia-Pacific Countries
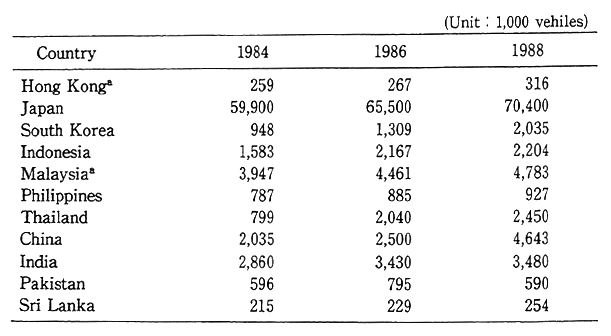
Reference: UN /ESCAP, State of the Environment in Asia and the Pacific 1990, p.130, updated final version, 1992, Bangkok.
a: Government data
In China, air pollution due to sulfur dioxide and soot generated from coal burning, which is the main energy source for industrial and private consumption, has become a problem. In 1993, the range of annual daily average values of total suspended matter (TSM, particles of less than lOOµm diameter) for cities in all of China was 108-815 µg/m3, and 38 of 74 cities surveyed exceeded the national second-stage standards (human health protected, and plants and animals in the city surviving for long periods without ill effects) for annual daily average values, with particularly severe values seen for such cities as Jilin, Wanxian, Taiyuan, and Lanzhou. Dust fall for 73 cities was an annual monthly average value of 4.0-83.5 tons/km2, and rising fast each month on a year-on-year basis, while the range of annual daily average values for sulfur dioxide in 77 cities was 8-451 μg/3, about the same as the previous year. Twenty percent of 77 cities exceeded the national second stage standards for sulfur dioxide, a slight increase over the previous year. The annual daily average value for nitrogen oxides in 77 cities was 10-147 μg/m3, about the same as the previous year.
In South Korea, the number of automobiles has risen sharply in recent years, and as of the end of 1993, 52% of all automobiles in the country were said to be concentrated in the six largest cities, including Seoul. As a result, automobile exhaust gases are the main emission source for nitrogen oxides and hydrocarbons, and of the nation's total emission volume of carbon monoxide, hydrocarbons, nitrogen oxides, and sulfur dioxide, automobiles are reported to account for about 65%, about 83.3%, about 43.8%, and about 6.1%, respectively. Moreover, the photochemical smog phenomenon and acid deposition have been observed in the industrial zones and urban areas.
Indonesia's air pollution problems occur in the major cities of Jakarta, Bandung, and Surabaja. In the case of Jakarta and Bandung, industry, automobiles, and garbage incineration are the sources for particulates, sulfur dioxide, nitrogen oxides, carbon monoxide, and hydrocarbons, and in both cities, the automobile is considered to be the source for particulates.
In Malaysia, the ratio of total air pollutant volume coming from automobile exhaust gas is, according to that country's Environment Department, about 90% for hydrocarbons, about 70% for nitrogen oxides, and about 50% for total suspended matter (TSM), while emis sions from such fixed sources as industrial plants, power plants, and waste incinerators are also a problem. Elsewhere, haze has appeared in the Kranbare district, which includes the capital Kuala Lumpur, for reasons that remain undetermined, some possibilities raised having included the effects of mountain fires, automobile exhaust gases, plant smoke emissions, or outdoor incineration of wastes, and the problem has become a social issue in recent years.
The sources for air pollution in the Philippines are said to be mainly automobiles and industrial plants insufficiently subjected to air pollution measures, with these two sources accounting for 60% and 40%, respectively, of total air pollutant emission volumes, according to a survey conducted in 1987 by the United Nations Development Programme and the Philippine's Ministry of Environment and Natural Resources. Diesel vehicles and automobiles, which are often used cars imported from Japan, are concentrating in the urban areas, and particularly in the Manila capital region, and air pollution has become a problem. In 1993, air pollutant emission volumes in the Manila capital region was 124,929 tons of particle matter (PM), 79,910 tons of nitrogen oxides, 577,197 tons of carbon monoxide, and 88,456 tons of sulfur dioxide.
In Thailand, air pollution caused by automobile exhaust gases in the Bangkok capital region has become a problem. Behind this problem lies the fact that more than one-quarter of all registered automobiles in the country are concentrated in Bangkok (privately owned vehicles account for about 30% of the total, which amount is about three-fourths of all privately owned vehicles in the country), resulting in some of the world's worst traffic jams. The main air pollutants are carbon monoxide, nitrogen oxides, suspended particulate matter, and lead. Air pollution due to lead is said to be causing particularly severe health problems to people living along main roads.
(2) Acid deposition
The effects of acid deposition were seen in a few districts of China in 1993. The range of annual average pH values for rainfall in 73 cities was 3.94-7.63, with 49.3% of the cities having an average pH of 5.6 or less. In districts around the cities of Chongqing and Hangzhou, the frequency of acid deposition appearances was said to be more than 70%. And has been indicated for such places as the firs on Sichuan Province's Mt. Emei, or the horsetail pines in the Nanshan district on the outskirts of Chongqing, acid deposition damage to forests is becoming a problem. Table 2-1-6 shows the results of rainfall pH values in Hangzhou Province during 1991 and 1992.
(3) Greenhouse gases
Carbon dioxide and other greenhouse gases in the atmosphere have in the past 100 years or more risen by more than 1.2 times the level seen before the agricultural and industrial revolutions. According to the 1990 ESCAP report on the state of the environment in the Asia-Pacific region, the ESCAP countries were at the beginning of the 1980s producing one-quarter of the world's carbon dioxide emissions. Moreover, the report estimated that the contribution of carbon dioxide emissions from industrial and biosphere sources was 75% and 25%, respectively. Figure 2-1-5 shows that carbon dioxide emissions in the Asia-Pacific region rose sharply between 1950 and 1985, and emission volumes had by 1985 surpassed those of Western Europe. According to the Carbon Dioxide Information Analysis Center, China had the most carbon dioxide emissions of the countries of the Asia-Pacific region, followed in order by Japan, India, South Korea, Indonesia, and Thailand.
Table 2-1-6 Acid Deposition Situation (pH value of Rainfall) in Major Cities of Guizhou Province, China for 1991-1992
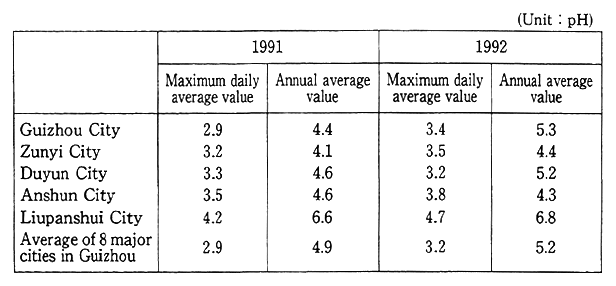
Source China Environmental Yearbook 1993
Fig. 2-1-5 Industrial-based Carbon Dioxide Emission Trends by Region, for 1950, 1965, and 1985
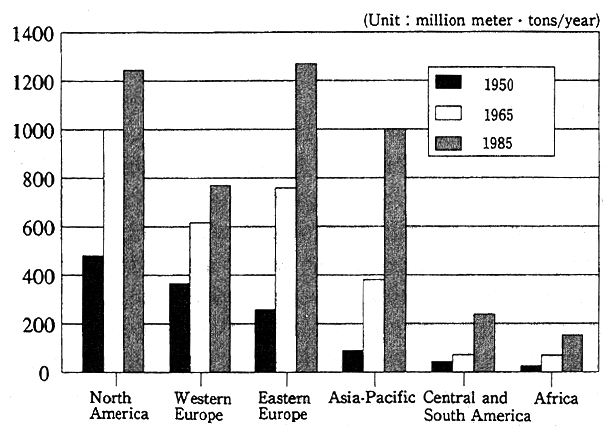
Reference World Resources, 1988-89
Source: UN/ESCAP, State of the Environment in Asia and the Pacific 1990
(4) Noise
In China, the rapid industrialization is leading populations to concentrate in the cities, and the steep rise in numbers of construction projects and in the number of automobiles is creating severe noise problems in the cities. The urban noise problem grew remarkably worse in 1993, with the average value noise level measured in 39 cities reaching 51.7-72.6dB, of which five cities were 60dB or over, while road traffic noise in 36 out of 44 cities surveyed exceeded 70 dB. By source of urban noise, traffic noise accounted for 27%, residential noise for 47.6%, and industrial and other kinds of noise for 25.4%.
In South Korea, the high-speed railroad now under construction between Seoul and Pusan is causing noise and vibration problems, while rising numbers of aircraft and aircraft routes are resulting in a new environmental problem caused by aircraft noise. In Thailand, noise from transportation facilities and plant construction sites are said to have become a problem. Major sources of noise that are noted include large vehicles such as trucks and buses, aging and poorly maintained passenger cars, motorcycles, water taxis, and the recent rush of construction projects.
(5) Water pollution
The water pollution problem is one of the worst problems facing most countries, with rivers and marshes near cities being polluted by untreated household and industrial waste water (Figure 2-1-6).
In China's public water areas, where all kinds of water pollution problems are evident, the country's total waste water output in 1993 was 35.56 billion tons (a 3.0% decline from 1992). Moreover, industrial waste water output was 21.95 billion tons (a 6.2% decline), of which chemical oxygen demand was 6.22 million tons (a 12.5% decline), heavy metals was 1,621 tons (a 6.9% rise), arsenic, 907 tons (a 4.0% rise), cyanide compounds, 2,480 tons (a 30.7% decline), volatile phenols, 4,996 tons (a 22.2% decline), and petroleum products, 71,399 tons (a 9.7% rise). While the water quality in major rivers is said to be good, water pollution in water areas that cover urban areas is getting worse. The results of a survey on water quality conducted at 127 points along seven major water drainage ways and inland rivers revealed the existence of such, major pollutants as ammoniacal nitrogen, permanganate consumption, biochemical oxygen demand, and volatile phenols. Moreover, in some subsidiary flows , pollution caused by such things as total-mercury, copper, and arsenic compounds. Water pollution is particularly serious in the Songhua, Liao, and Hai river drainage ways. Elsewhere, lakes are suffering from eutrophication, while some lakes are said to have serious total-mercury pollution. Moreover, coastal seas have been hit by oil pollution and eutrophication, while underground water pollution is occurring at major cities. Accumulations of copper, zinc, cadmium, and other heavy metals are increasing in living organisms. Also, red tide is recognized to have occurred 19 times in 1993.
Fig. 2-1-6 Water Pollution Situation (DO) in Asian Region
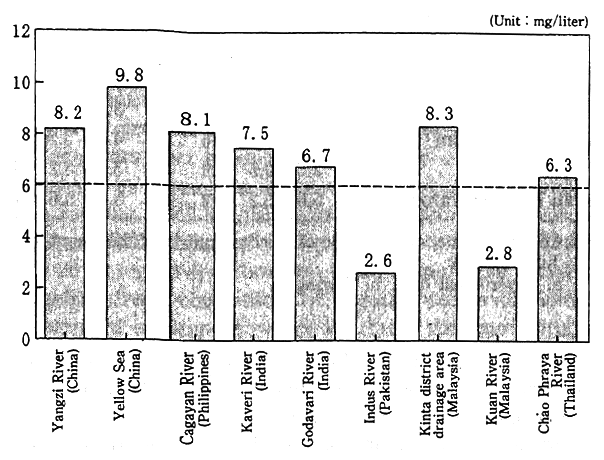
Reference: Toward an Environmental Strategy for Asia, World Bank Discussion Papers
At the end of 1993, total waste water volume in South Korea was 2,300 tons per day, of which about 39% was being treated, as waste water from industrial plants and livestock stations were being insufficiently treated. The BOD-value for four major rivers in South Korea, including the Han and Raktong rivers, is as shown in Table 2-1-7. For the six man water sources, which include the Lake Paldan reservoir, the upper reaches of the rivers are in reasonably good shape, but since 67% of all water sources are in the downstream sections of the rivers, they are receiving the effects of pollution from cities and industrial districts. As the economy grows, the amount of heavy metals and noxious substances in industrial waste water increases, while agricultural chemical residues wash into the rivers and cause eutrophication in the reservoirs or the sea. It is also said that water pollution is developing in enclosed areas of the Yellow Sea and South Sea that surround the Korean peninsula due to the polluted rivers.
Table 2-1-7 Water Pollution Situation(BOD) in Four Major Rivers in South Korean

Reference: Country Report on the State of the Environment, the Republic of Korea, July 1994, etc.
a. Government data; b. (Kyongju)
In Indonesia, organic and bacterial water pollution has become a problem all over the country, including the rural areas. On the western side of Java Island, for example, colon bacilli from urine has been detected in a density range of 970-1,700 MPN/1OOmL, while rivers on Java have been found to exceed the domestic environmental standards for organic pollution-caused BOD and COD. Pollution from household garbage is considered to be a major cause of water pollution. In the Jabotabek district, 38.5% of the population toss their garbage directly into the river, so that the environmental pollution load in terms of BOD on the river runs to about 120 tons per day. Moreover, 50% of the environmental pollution load on major rivers is caused by industrial waste, and serious water pollution problems have arisen on the north coast of Java where the industrial centers are. Should industry grow further in the future, and be concentrated in Java, there is a distinct possibility of this kind of water pollution getting worse if no suitable measures are taken.
The greatest threats to marine pollution in Indonesia is industrial waste and general wastes, polluted sediments from rivers, and oil discharges from ships and offshore developments, such as the Jakarta coastline, for example, where heavy metal pollution has been confirmed. Oil pollution in the Java Sea has formed a layer atop the ocean surface, which, it is said, can be observed on a daily basis offshore from Tanjunpriok harbor, the Mualakalan power plant, and the Silachap refinery.
In Malaysia, a survey conducted in 1992 revealed that, according to a water quality index (BOD, COD, NH3N, SS, pH) of 87 rivers, water pollution had become serious in seven rivers, some pollution was observable in 55 rivers, and the remaining 25 rivers were deemed not polluted.
The main environmental problems in the Philippine domestic water environment is silt or pollutants on the surface flow and salinization of the underground water. With a shortage of sewage treatment facilities for rivers and lakes near the center of urban areas, water pollution caused by household waste water has become a problem, with BOD-value running at 25-53 grams per person per day. For example, the annual average BOD-value on the Pasig River in the Manila metropolitan area is 20-40 mg/liter. Moreover, Lake Laguna, the nation's largest lake, is reeling from the effects of regular wastes discharged from sewage treatment equipment, water saturated with agricultural chemicals and fertilizers washed off from farmland, and waste water from 986 plants in the Manila capital area, while soil washed into the lake from such places as river embankments has left the lake's water depth at a shallow two meters. Mining is the main economic activity in the Philippines, and mining slag heaps have become a serious environmental problem, with water pollution caused by such by-products as cyanide compounds or mercury. Moreover, toxic wastes flowing into water channels from such small and medium-size plants as electroplating and tanning plants have also become a problem. Marine water pollution is rapidly getting worse because of sewage, industrial waste, mining slag, oil discharged from ships, and fertilizers and agricultural chemical residues washed from farmlands. Manila Bay, for example, is said to be on the receiving end of direct discharges of insufficiently treated sewage.
In Thailand, the water quality of the Chao Phraya River, which flows across the nation from north to south,. and is formed by a large number of branch rivers and a vast delta, is said to worsen as it flows past the Bangkok metropolitan area. The BOD per day is 183,634 kilograms. Moreover, BOD caused by industrial waste was 525,235 tons in 1991, of which 29% was from the sugar industry (153,740 tons), 19% from the paper pulp industry (102,711 tons), and 18% from the rubber industry (96,526 tons). The amount of industrial waste water being treated is estimated to be equivalent to 70% of the total. Industrial waste water is not the only reason for worsening river water quality, household waste water and agricultural waste water also being factors, so that household waste water left untreated, because of a shortage of sewage treatment facilities, is a threat to the water quality of Thailands rivers.
In Vietnam, water pollution is a particular problem in urban areas. A large proportion of urine or household waste water in major cities is discharged untreated, resulting in water pollution in rivers, canals, and lakes. Household waste water treatment facilities are rare, and those that do exist often do not function properly, so that the open sewage channels and underground pipes in Hanoi, Ho Chi Minh City, and other urban areas often discharge directly into water channels or rivers.
(6) Wastes
Table 2-1-8 shows the state of waste discharge and disposal in the major cities of countries in the ESCAP region.
In China, the three classifications of waste gases, waste water, and solid waste are called the "three wastes." The vast proportion of industrial-related solid wastes are dumped untreated in city suburbs, where they can be washed away into rivers, lakes, and the seacoast. Of the 20 million tons of total industrial-related solid waste generated in 1993, ten million tons was discharged into rivers. Moreover, the accumulated total of dumped industrial-related solid wastes was 597 million tons, with a dumping ground area of 52,052 hectares, 2,471 hectares less than 1992.
In South Korea, the total wastes generated per day was 144,536 tons in 1992, with general wastes amounting to about 75,000 tons/day and industrial wastes to about 70,000 tons/day. Although burial is the common method for disposing of the general wastes and industrial wastes, of the 602 disposal sites operated by local government authorities, 358 sites were projected to be filled up within three years. Industrial wastes containing heavy metals or toxic substances are first either solidified or incinerated before being disposed of by burial.
In Malaysia, generation of toxic wastes in the Malay Peninsula is increasing alongside the industrial growth, and amount of waste has reached about 280,000m3 annually Major sources are metallic surface processing, electroplating, chemicals, printing, and the packaging industry.
In the Philippines, pollution due to waste is occurring in the cities where the population is becoming increasingly concentrated and where economic activities are progressing. The waste problem is said to be due to insufficient waste collection and disposal systems. In 1992, the Manila metropolitan area generated about 5,400 tons/day, or 0.63 kilograms of wastes per person, but only 63% of this daily generated waste was collected. Of the collected wastes, 72% was disposed of in open dumping on public land in and around the cities. And the uncollected wastes were either incinerated, collected by scavengers and reused, or thrown away into the river systems. Industrial wastes often contain lead or mercury, particularly from the electronics and electroplating industries. More than one-half of the 15,000 companies in the country are concentrated in the Manila metropolitan area. In addition, the mining industry produces 250,000 dry metric tons (DMT) of slag every day, of which 50% is dumped into the Tanion Strait between Cebu Island and Negros Island. Because mining slag pollutes nearby farmland, it has become a social problem particularly in the northern part of the Philippines.
Table 2-1-8 Composition and Disposal of Solid Wastes in Major Citis of ESCAP Member Countries
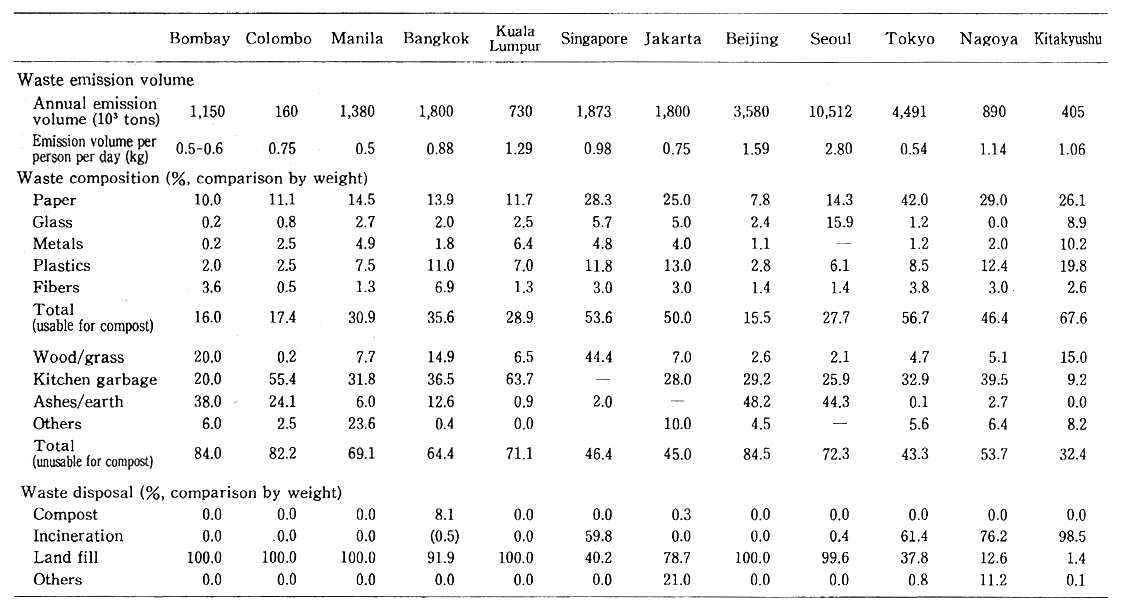
Reference: UNORD 1989
Source: ESCAP "State of Urbanization in Asia and the Pacific 1993"
In Thailand, the use of chemical substances is increasing in. line with industrial growth, and wastes are said to often contain toxic chemical substances that can have an effect on human health when discharged into the environment. In 1991, two million tons of toxic substances were produced, of which 72% was heavy metals in a solid or sludge state. About 90% of these heavy metals are said to have been generated by the metal industry.
(7) Forest decline
A look at the forest areas in the countries of the Asia-Pacific region reveals that, in China, there was about 133.7 million hectares of forests (an increase of 2.77 million hectares over the previous year) according to the Fourth National Forestry Resources Survey concducted in 1989-93, accounting for 13.9% of the total national area (a 0.3% increase). The forest area in Indonesia was 144 million hectares according to the Consensus Land Use Plan of 1984, of which 19 million hectares was in wildlife diversity conservation districts and 30 million hectares was in drainage basin conservation districts. Forest areas in Malaysia covered 2.9 million hectares, about 72 % of the total national area. In the Philippines, the forest area was 10.4 million hectares in 1972, about 34% of the land area, but this had shrunk to 5.9 million hectares in 1992. Where forest areas in Thailand 30 years ago were said to have covered 50% or more of the land area, it was down to 33% in 1979, and is presently about 28%, a decline of about 15 million hectares. The Royal Forestry Ministry reported that 700,000 hectares of trees were planted in 1989.
In addition, according to materials provided by the United Nations Food and Agriculture Organization, forests declined drastically in Indonesia, Thailand, the Philippines, and other countries in the years from 1981 to 1990 (Table 2-1-9). Factors causing the decline of the tropical forests were non-traditional slash-and-burn agriculture, excessive collection of firewood and charcoal, inappropriate commercial logging, and excessive grazing, behind which lie a variety of socioeconomic factors, including population growth, poverty, and land systems.
Table 2-1-9 Area of Annual Forest Decline in Countries of the Asia-Pacific Region during 1981-1990
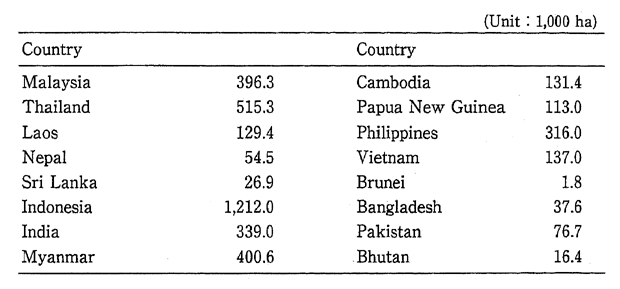
Reference: Forest Resources Assessment 1990, Tropical countries. FAO(1993)
For example, in a report submitted by the Philippines to the ESCAP Conference on the State of the Environment, it states, "In the Philippines, population pressures and poverty are driving the population to increase cultivation on fragile land and to flow into agricultural land. This has resulted in a sharp decline in the forests, a decline in wildlife and plant species, and drop in productivity of the soil. Natural and anthropogenic reasons that can be offered for the decline of forests include forest fires, illegal lumbering, population inflows, nontraditional slash-and-burn agriculture, and pests or disease. The decline and weakening of the forests has brought bad effects on the society and economy, including movement away from ancestral lands, loss of economic profits that could be had from sustainable forest development and drainage basin management, and loss of human life and property due to uncontrollable seasonal flooding."
Meanwhile, the main reasons proposed for the decline of forests in Thailand are conversion to farmland and lumbering conducted without proper management. The rate of forest loss in the 1960s and 1970s was 3% annually, and was 2% in the 1980s. Since 1988 the rate of loss has come down sharply, to about 0.3%, after logging was officially banned in 1988, yet a small amount of illegal logging still appears to be continuing. Moreover, the forests protected by the National Forest Conservation Law appear to be shrinking due to inroads from subsistence farmers.
(8) Soil degeneration and desertification
Soil degeneration and desertification have also become problems in the Asia-Pacific region (Table 2-1-10).
In China, the nation's grasslands are in a serious state due to advancing desertification and land blight, increased salinity, and alkalization, according to the Fourth National Forestry Resources Survey conducted in 1989-93, with about 90 million hectares of land desolated. That accounted for more than one-third of the total usable grassland area, and average pasturage production was 30-50% less than the results shown in the Third National Survey (1984-88). Polluted paddies and fields in the country amounted to ten million hectares, of which areas victimized by polluted irrigation water amounted to 3.3 million hectares, while those areas affected by air pollution problems such as acid deposition or fluorine pollution amounted to about 5.3 million hectares. In addition, there was 900,000 hectares of paddies and fields lost to agricultural use because of solid wastes, garbage, and polluted silt. The shortfall in food production due to this kind of environmental pollution is estimated at 12 million tons annually. Moreover, the China Forestry Department estimates that the effects of desertification extend to about 332.7 million hectares, about 34% of the total national area, so that as much as 400 million people are affected by desertification. Of this area affected by desertification, loss of topsoil due to wind erosion affected about 153.3 million hectares, while the effects of water flow erosion extended to about 179.4 million hectares.
Table 2-1-10 Land Area Affected by Soil Degradation in Countries of Asian Region
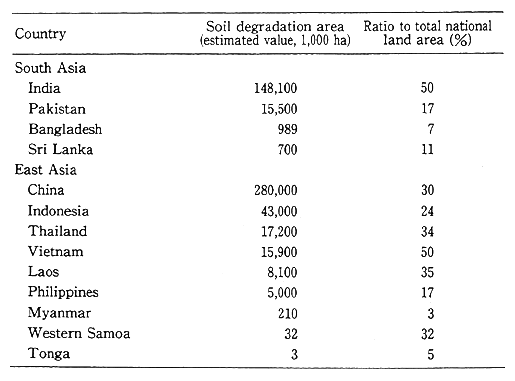
Reference: ESCAP 1992
Source : Toward an Environmental Strategy for Asia, World Bank Discussion Papers
In South Korea, the use of toxic agricultural chemicals and chemical fertilizers to boost agricultural productivity has resulted in degeneration of farmland. Increased use of chemical substances and fertilizers has affected the ecology and the food chain, and is said to be threatening human health.
In the Philippines, a sharply increasing population has promoted utilization of highly productive land in the country, which is said to have had effects on the fragile ecology, caused soil erosion and increased salinity, reduced soil productivity, and loss of inherited resources. Land in at least 22 regions is badly eroded, and the area of land degeneration, with a medium or strong degree of erosion, reached 13.6 million hectares in 1992. Moreover, in a report sent by the Philippines to the ESCAP Conference on the State of the Environment, it states, "In agricultural lands, soil erosion, increased salinity, and misuse of agricultural chemicals have degraded the soil, while transfer to non-agricultural land has resulted in the loss of the most productive farmland. Although chemical fertilizers and agricultural chemicals are used to boost agricultural production, a shortage of technicians and facilities means that agricultural chemical residues and fertilizers are not being adequately monitored. Moreover, inappropriate land use such as non-traditional slash-and-burn agriculture, as well as the decline of forests on sloping areas due to inappropriate forest logging or excessive collection of firewood, are major factors in the erosion of farmland. Since poor farmers lacking stable land ownership, and lacking in labor or capital, have no incentive to improve the land or preserve its nourishment, they engage in non-traditional slash-and-burn agriculture."
In Thailand, land degeneration, acid deposition, and increased salinity is said to affect 50% of the nation's farmland. In a report sent by Thailand to the ESCAP Conference on the State of the Environment, it states, "Unstable land ownership by farmers who do not have the capital or incentive to appropriately manage their land is a problem, with more than 40% of farmland occupied by illegal landowners. In Thailand, non-ownership of land, rural poverty, and intrusion by farmers into forest land are problems, and some 8-9 million hectares of forest has been intruded upon by landless farmers. In addition, the rapid growth in Thai agriculture has been accompanied by the environmental problem of large-scale forest decline, which has been a factor in soil erosion, flooding, drought, and increasing salinization. At the root of forest decline lies the problems of poverty and the income gap, and this is similar to what can be seen in many other developing countries."
(9) Ground subsidence
According to a survey by the Chinese Environment Protection Agency most major cities appear to be drawing excessively on their ground water, and as many as 45 cities across China have reported ground subsidence. In Thailand, Bangkok the capital has since 1970 experienced subsidence over a broad area of 4,550 km2 to a maximum of more than 1.6 meters. Elsewhere, Jakarta and other places in Indonesia have reported ground subsidence due to withdrawal of ground water.
(10) Natural disasters
While no major flood disasters occurred in China in 1993, with the exception of a few local areas, southern China was hit seven times by typhoons and losses were great. In addition, areas ravaged by forest fires reached 29,000 hectares. In a report sent by the Philippines to the ESCAP Conference on the State of the Environment, it states, "The land of the Philippines is susceptible to natural disasters, and the effects to the economy of natural and environmental losses have become a serious problem. An average of 19 typhoons arrive each year, and the flooding caused by the vast amounts of rainfall that these typhoons bring cause erosion on denuded forests, mountains, hillsides, and plains. In addition, the eruption of Mt. Pinatsubo has had an effect on the ecology, causing damage to farmland and aquaculture ponds." Thailand is in the monsoon belt, where a rainy season from August to October regularly causes flooding. Moreover, about 21 % of the forest belt is subjected to the effects of forest fires every year. In Malaysia, the natural disaster most feared is flooding, where land crops can be seriously affected. About 12% of the land area in the Malay Peninsula is affected.
(11) Marine environment
China's marine resources are being affected by water pollution in the egg-laying and wintering sites on the Yangtze River. The hirakonoshiro in the Yangze River, and the whiting fish in the Songhua River are threatened with extinction, while aquaculture grounds abandoned in Zhejiang province due to pollution have reached 24,000 hectares. In 1993, infectious diseases spread through the nation's coastal shrimp breeding grounds, with the area affected reaching about 112,000 hectares. As a result, shrimp production fell by more than 120,000 tons, and the economic loss was estimated at 3.5 billion yuan.
The marine environment along the Malaysian coastal areas is worsening due to over fishing, marine pollution, coastal erosion, destruction of coral reefs, and, particularly along the western coast of the Malay Peninsula, destruction of mangrove districts. And the major environmental problems for the Philippines' marine environment is weakening of mangrove forests or their conversion to other uses, destruction of coral reefs because of pollution, implementation of destructive fishing laws, unsustainable over fishing of different fish stocks, and the occurrence of red tide. Also, the decline of natural resources along the Thai coastline is said to be caused by cutting of mangrove forests, shrimp cultivation, sediments discharged by mining enterprises, construction of deep water ports, tourism, and fishing laws that allow use of explosives on the coral reefs.
(12) Wildlife
In China, loss of habitat due to population pressures and also game hunting for prize stuffing or for collection of pharmaceuticals is threatening with extinction such animals as tiger, snow leopard, Thorold's deer, and golden snub-nosed monkey, and such plants as Korean white pine and dragon fir. In response, China has set up nature conservation districts, covering 766 different sites as of the end of 1993 (of which 77 sites were national nature conservation districts), for a total area of 66,184 million hectares, or 6.8% of the nation's total land area.
Wildlife existing in South Korea are said to include a total of 8,000 animal species and 14,000 species of plants. Various development begun in the 1960s in South Korea brought species loss and environmental pollution to forest regions, and as a result, many species of wildlife are threatened to extinction, with the exception of the demilitarized zone between North and South Korea.
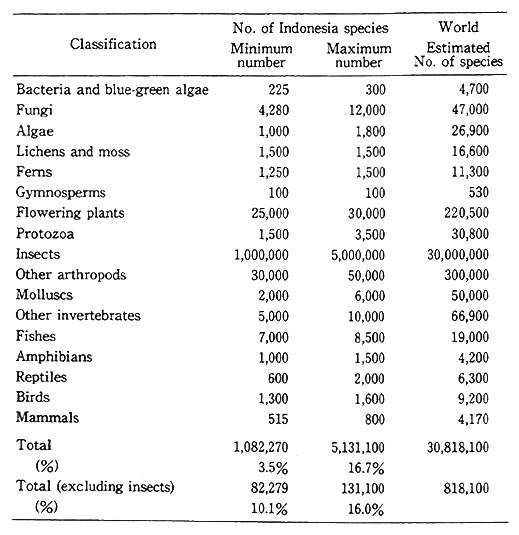
Preserving the diversity of life forms in Indonesia is considered to be extremely important in Indonesia as well as in the world at large (Table 2-1-11). While the number of animal and plant species has not fallen below 300,000 species, the loss of many animal and plant species has become a serious problem. At the present time, 72 species of mammals, 346 species of birds, 17 species of reptiles, and 17 species of plants are protected by law against the threat of extinction. Moreover, the Komodo dragon and many other species are native only to Indonesia.
Table 2-1-11 Total Number of Species in Indonesia by Major Classification
Reference: Sastrapradja et a (1989); McNeely et al (1990); Bappenas (1991); UNNEP 1991); Bibby et al (1992)
Source : An Overview of State of Environment, Indonesia
Malaysia has a wide variety of wildlife habitats and therefore has an extremely rich variety of wild animal and plant species. In Malaysia alone there are estimated to exist 60,000 species of moths and butterflies, 14,500 species of flowering plants, 20,000 species of insects, and 10,000 species of invertebrate animals. At the present time, there is 1.49 million hectares of animal and bird conservation districts within the national parks, and a further 1.42 million hectares is being considered for conservation districts.
In the Philippines, the ecology on land supports 8,000 species of flowering plants, and about 4,000 species of funguses and mosses. Moreover, the 2,500 species of wildlife include 196 species of mammals, 950-975 species or subspecies of reptiles, and a similar number of avian species, including migratory birds. Eleven species of wildlife are threatened with imminent extinction while six species of mammals, 12 species of reptiles, and 49 species of birds are thought to be endangered.
In Thailand, the effects of forest logging, agriculture, and the use of natural water resources for 30 years of development projects have apparently resulted in the loss of many wildlife species. With the adoption of the Wildlife Protection and Conservation Law in 1960, the areas now under protection cover about 2.36 million hectares. Unfortunately, illegal hunting continues to exist today, partly because measures to solve the basic problems of poverty have yet to be taken, and because there is still large-scale trade in wildlife.
Section2. Environmental Outlook for the Asia-Pacific Region in the 21st Century
It is predicted that rapid population increase, economic growth, increased energy consumption, etc., in the Asia-Pacific region would lead to increasing the environmental burden, such as increased carbon dioxide emission on a global scale. Moreover, the Asia-Pacific region embraces a large number of countries at diverse stages of development and with large populations, and is a region that covers a broad geographical expanse.
Therefore, extensive environmental effects can be expected to spread globally due to the close socioeconomic bonds of the region With the rest of the world.
This section takes the above viewpoint to see specifically how the Asia-Pacific region will add the burden on the environment, and how those environmental effects will affect the region.
1. Rise in the Socioeconomic Activities of the Asia-Pacific Region as Linked to Increased Global-Scale Environmental Burdens
Firstly, take a look at population, economic scale, and energy consumption volumes, which are the most basic causes of increased burdens on the environment, and consider how these will change in the future.
(1) Increased population and urban concentration
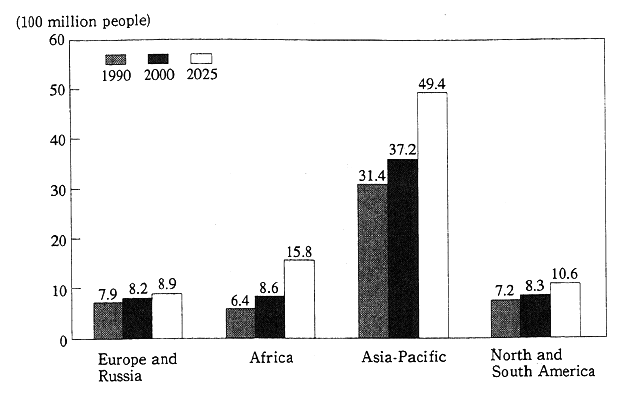
Population is a basic indicator of the total volume of human activities, and its increase is deeply linked to environmental problems via a number of channels. The population of the Asia-Pacific region L over 3.1 billion people as of 1990, and is predicted according to mediumrange United Nations estimate to reach 4.9 billion people by 2025 (Figure 2-2-1). The average annual rate of population increase during this period is thus projected to be 1.3% which, while falling far short of the 2.7% predicted for Africa, represents the largest absolute population increase in the world, because the original base is so large. As a result, the percentage of the world population living in the Asia-Pacific region will be maintained at the high level of about 60%. The contribution to the region's population increase by India and China is particularly large, with the two countries accounting for more than 50% of the total expected increase of about 1.8 billion people. Increase in population can seriously worsen many environmental problems through the consumption of natural resources and increased discharge of unwanted substances. Moreover, the effects of environmental problems brought on by rising population could in some cases induce the appearance of environmental refugees or, in other ways, cause social instability. These effect could also spread beyond the Asia-Pacific region to other areas.
Fig. 2-2-1 Future Population Forecasts for Asia-Pacific Region Source: United Nations
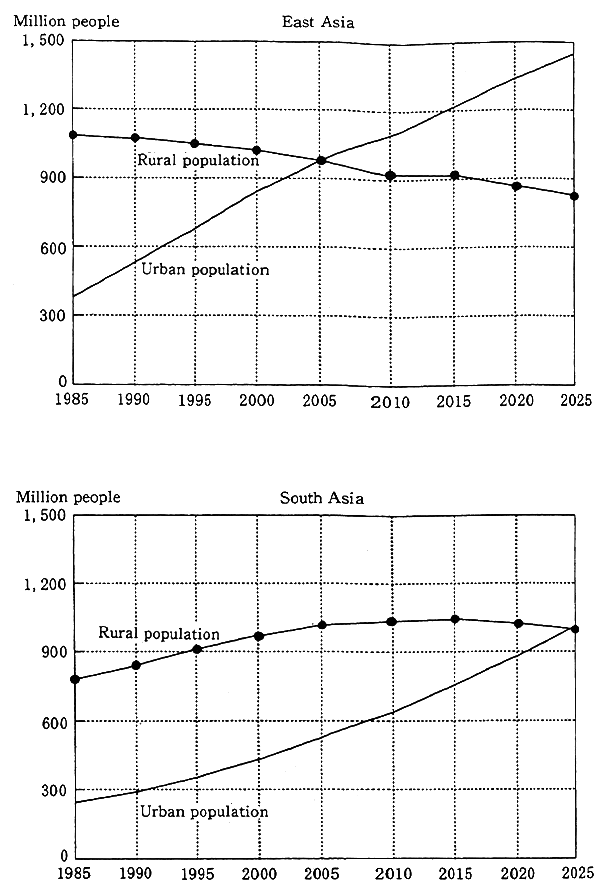
As the population increases, the population in the Asia-Pacific region will tend to concentrate still more in urban areas. The United Nations forecasts that about 60% of the total population in Asia will consist of urban residents in 2025. The rate of population increase in cities will be twice the rate for the general population, and the total rural population is actually expected to show a decline. The urban population in East Asia is expected to overtake the rural population in size in about 2025, and urban residents are expected to reach 63% of the total population in 2025. In South Asia, as well, the urban population is estimated to overtake the rural population by 2025 (Figure 2-2-2). As a result, the urban population is expected to increase by three times in the period from 1990 to 2025. The number of giant cities in existence is projected to grow rapidly. The United Nations Centre for Human Settlements (UNCHS) forecasts that the number of cities in the region with population of 4 million people or more will reach 28 in 2000 and grow still more to 52 in 2025, and that the percentage of residents in giant cities will rise in relation to the total urban population. Concentration of population into urban areas puts still more strain on sewer lines, waste disposal facilities, public transport facilities, etc., and the many cities that will be unable to respond adequately to the increased amount of social infrastructure investment required are expected to experience still worse environmental problems such as air pollution, degraded water quality, etc. In addition, the expansion of urban population threatens disorderly expansion into greenbelts that surround cities, reducing the amount of farmland and natural resources available near urban areas.
Fig. 2-2-2 Urban and Rural Population Growth in Asia
Source United Nations (1991)
While the poverty-stricken class is currently seen much more often in rural areas, the increase in urban population is expected to result in an increase in the numbers of urban poor. Even today, as much as 50% of the population living in such Indian cities as Mumbai, Delhi, or Calcutta do not live in proper housing (Figure 2-2-3). According to the Economic and Social Commission for Asia and the Pacific (ESCAP), the slum population in Mumbai rose from 41% of the total population in 1976 to 51% in 1981, and is predicted to reach 75% by 2000. The poor class living in large numbers in the slums, along the rivers and canals, and on the roadways, are lacking in the basic social infrastructure of water lines and sewer lines, etc. Moreover, the difficulty of their acquiring assurance of safe water supplies or of receiving sanitation
Fig. 2-2-3 Ratio of Slum Dwelling Population in Asian Cities
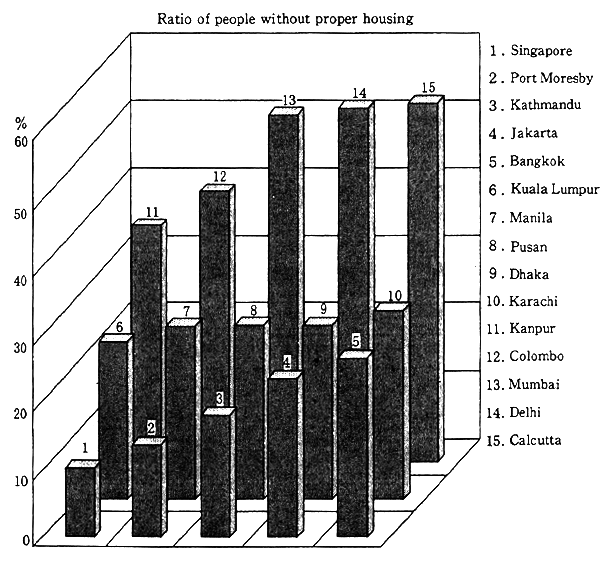
Source: ESCAP, and others services is confronting these cities with an ever-worsening urban environment.
(2) Expansion of economic scale
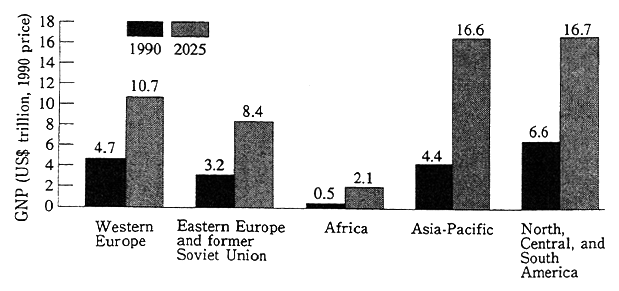
The estimate by the World Bank and the Intergovernmental Panel on Climate Change (IPCC) is used to consider by how much the scale of the economy, in which population is used as a basis for measuring the scale of human activities, will expand in the future in the Asia-Pacific region. The world's GNP was about US$20 trillion as of 1990, with the Asia-Pacific region comprising a little over 20% of this total, or about US$4.4 trillion, making it comparable in economic scale to North and South America and to Western Europe. Total world GNP is predicted to expand to approximately US$55 trillion in 2025. Therefore, since the Asia-Pacific region is expected to register a higher growth rate than other regions, at 4.2% annual growth in the 1990s and 3.8% annual growth from 2000 to 2025, the region is expected to grow in its share of world GNP to 30%, bringing it in 2025 to a level comparable to North and South America as an economic zone (Figure 2-2-4). Moreover, the high growth rates that East Asia has shown in recent years have led observers to revise the future economic growth rate estimate upward. The World Bank, for example, released new economic growth forecasts in April 1994, in which it increased its forecasts for average annual growth over the next 10 years (1995 to 2004) in the East Asia region to 7.7%.
Fig. 2-2-4 GNP by Region Current/Forecast (1990/2025)
Source: World Bank, IPCC
(3) Increase in energy consumption
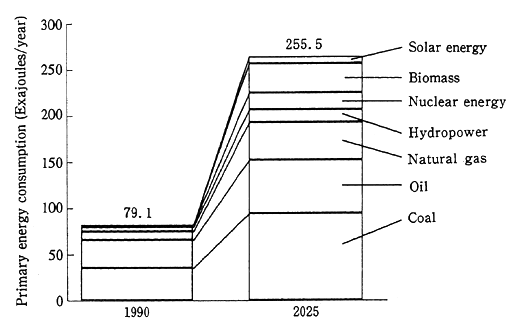
Economic growth and population increase can be expected to bring a massive rise in energy consumption. Energy consumption is most directly linked to emission of carbon dioxide, sulfur dioxide, etc. Many factors are involved in estimating future energy consumption volume. If, using the standard estimate by the IPCC, the framework of present energy policies remains unchanged, for example, primary energy consunaption volume in the Asia-Pacific region is predicted to reach 255.5EJ (Exajoules = 1018J) in 2025, about 3.2 times larger than the consumption volume for 1990. Since the rate of increase for the world at large is expected to be only about two times larger, it can be seen that the share of total world energy consumption held by the Asia-Pacific region will rise from 23% in 1990 to 36% in 2025, and that the region's increase in consumption volume will be extremely large (Figure 2-2-5). Furthermore, when viewed by type of fuel consumed, while the ranking of consumption volume for coal, oil, and natural gas will remain unchanged, coal and natural gas consumption volume are expected to increase by 2.8 times and 4.3 times respectively, from 1990 levels, whereas oil consumption volume is expected to rise by just 1,8 times. Coal, in particular, is predicted to show an absolute consumption volume of 58.5EJ/year, for the largest increase in consumption. Since the carbon content ratio per unit of coal averages more than 30% higher than oil, it will be a factor in boosting carbon dioxide emission volume. On the other hand, since the carbon content ratio per unit of natural gas is almost 30% less than oil, it will contribute to holding down carbon dioxide emission volume as long as it is used as a substitute for oil. Other fuels such as biomass fuel and solar energy are also predicted to be introduced in large scale, as well as hydropower and nuclear power.
Fig. 2-2-5 Primary Energy Consumption in Asia.Pacific Region (1990/2025)
Surce: ESCAP, others
For the Asia-Pacific region's energy supply and demand forecast, which is deeply connected to carbon dioxide emission volume, the Comprehensive Energy Study Committee is currently engaged in investigations.
2. Rising Environmental Burden and Subsequent Effects in the Asia-Pacific Region
With this increase in population and expansion in energy consumption, what is the environmental outlook for the Asia-Pacific region in the 21st century? While it is difficult to draw a comprehensive future portrait, with much hinging on what future efforts will bring, attempts will nevertheless be made in this section to provide an outlook on the region's 21st century environment from results of a simulation based on a model of the future.
(1) In creased carbon dioxide emission volume and its effects
Many institutions in the world have issued forecasts for future carbon dioxide emission volume. Here, forecast examples are provided from estimates by the IPCC, the Organisation for Economic Cooperation and Development (OECD), the International Energy Agency (LEA) and the "Asia-Pacific Integrated Model" (AIM) developed by the Environment Agency's National Institute for Environmental Studies, etc.
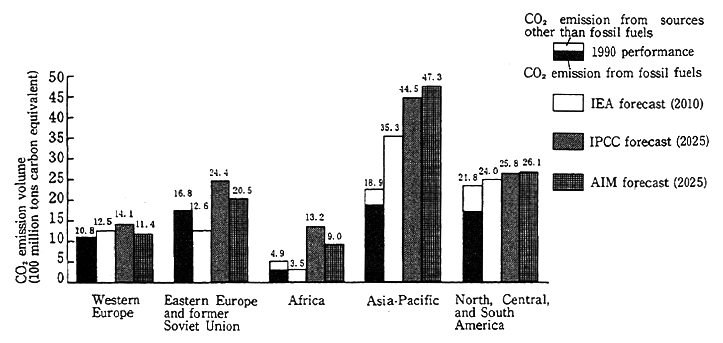
Figure 2-2-6 shows estimated results of each model of carbon dioxide emission by region, assuming no particular emission control measures are taken. Estimates by the IPCC and AIM are for 2025, while the one by OECD/JEA is for 2010. IPCC and AIM assume average economic growth for the world overall of 2.9% per year from 1990 to 2025, and predict 3.9% growth for the Asia-Pacific region. In the same way, OECD/JEA expects average economic growth for the world over all of 2.9% in the period of 1991 to 2010, and predicts 4.1% for the Asia-Pacific region. Note that the OECD/IEA estimate are limited to emission from energy sources, while the IPCC and AIM estimates have emission from energy sources and also include emission from cement production and conversion of land use (forest reduction).
Fig.2-2-6 Carbon Dioxide Emission Volume by Region Prepared by the Environment Agency
Note: Both the IPCC and AIM forecasts include emission from sources other
than fossil fuel combustion (cement production and forest decline)
The common trend seen in these estimates is an upthrust in emission volume from the Asia-Pacific region, and forecasts of huge increases in carbon dioxide emission volume in the region. For example, where the IPCC estimate finds the world as a whole increasing its carbon dioxide emission volume by 1.5% annually to 2025, and it forecasts emission volume growing by 2.5% annually in the Asia-Pacific region, a rate of growth that is 1.7 times higher. As a result, the share of total world carbon dioxide emission volume held by the Asia-Pacific region is predicted to rise from slightly more than 25% as of 1990 to about 35% in 2025. The rate of emission volume growth in China, India, the Southeast Asian countries, and the Republic of Korea and other NIEs countries is expected to be particularly large. China is expected in the future to surpass the United States, the current world leader with about one-fifth of the world's entire carbon dioxide emission volume, and become the world's No.1 carbon dioxide emission nation.
In the Asia-Pacific region, fast growth and rising population lie behind forecasts of a huge increase in carbon dioxide emission volume. Nevertheless, the region has much potential for controlling emission. If suitable measures are taken and implemented, the possibility remains that the emission of carbon dioxide and other greenhouse gases can be controlled even while accomplishing economic growth. Concerning these possibilities, joint research using AIM is in progress. AIM positions itself in reference to the IPCC model, and is a comprehensive model that unifies the various processes, such as emission of greenhouse gases, the accompanying climate changes and their subsequent effects, into a form of analysis for policy evaluation.
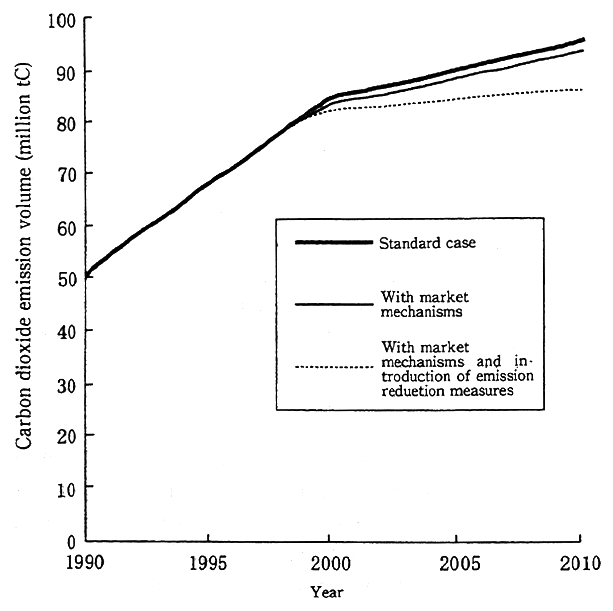
Figs 2-2-7 Forecast of Carbon Dioxide Emission Volume in China's Steel Sector
Source China Energy Research Institute, National Institute for Environmental Studies
Note: In the standard case, the slowing in the rate of increase of CO2 emission after 2000 is due to an assumption of slowdown in the growth of steel production from that year.
Figure 2-2-7 shows the results of research conducted by the Chinese Energy Research Institute (ERI) and the National Institute for Environmental Studies, in which AIM predicts the carbon dioxide emission volume from China's steel industry. Provided more efficient technologies will be introduced as the market economy progresses, and should economic growth maintain exogenous values, then it can be seen that carbon dioxide emission will, after the year 2000, be restrained by about 2-3% lower than the standard case. Furthermore, if market mechanism is activated and the spread of energy-saving technologies are promoted, then there is a possibility that the rate of emission volume growth in China's steel industry will be moderated to a large degree, and analysis of the promotion policies needed is continued. In addition, Figure 2-2-8 shows the results of joint research between the Korean Energy and Economy Research Institute (KEEI), the Korean Environmental Technology Research Institute (KETRI), and the National Institute for Environmental Studies, with AIM again being used to predict the carbon dioxide emission volume in the private sector of the Republic of Korea. The survey hints that the large-scale introduction and spread of solar heat utilizing equipments including solar water heaters and insulating materials could lead to stabilization of carbon dioxide emission volume from the private sector. Analysis of carbon dioxide emission volume from the Republic of Korea's steel industry is also in progress, and the analyses to date predicts that emission volume will continue to increase as long as the current economic growth continues, making clear the necessity for studies into revolutionary policies and technologies.
Fig. 2-2-8 Forecast of Carbon Dioxide Emission of South Korea's Private Sector
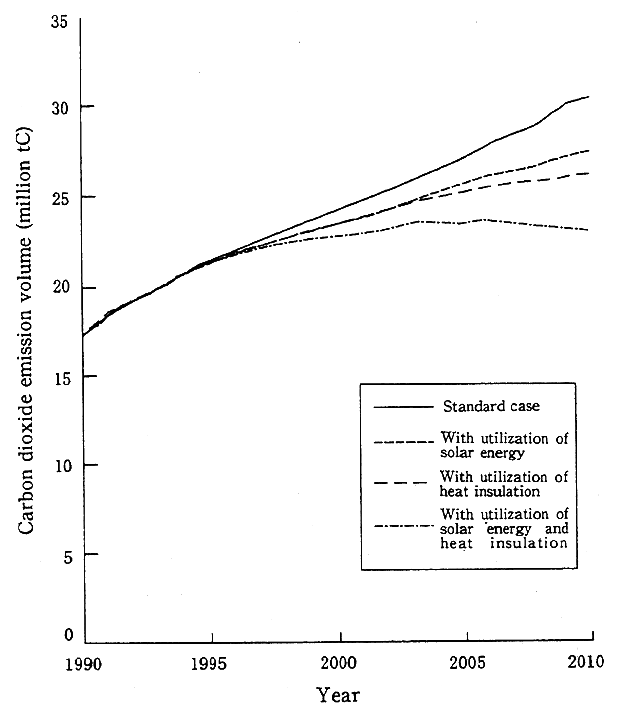
Source: Korean Energy and Economy Research Institute, Korean Environmental Technology Development Institute, National Institute for Environmental Studies
These possibilities, of course, are calculated under a number of assumptions, such as the continuation of exogenous economic growth or the practicability of policies, etc. Further, there are many uncertain factors under which these assumptions will in actuality be satisfied. Nevertheless, in considering the idea of sustainable growth in the Asia-Pacific region, cooperation with institutions that will be involved in drawing up specific policies is highly significant.
Effects of global warming in the Asia-Pacific region are discussed below regarding to sea level rising and agricultural production.
The Asia-Pacific region has a high degree of concentration of population and social infrastructure in coastal areas. Moreover, because of the large number of island nations in the area, it is a region that is particularly concerned about the effects of a rising sea level due to global warming. In particular, the Maldives Islands, where the elevation rises just a few meters above sea level, and the coral atoll nations of the Pacific Ocean, are fearful for the very survival of their respective nations. While avoiding this situation will probably require such measures as raising up sea levees, the costs of these measures will impose heavy burdens on these island nations. According to IPCC calculations, should sea level rise by one meter over the next 100 years, for example, the Maldives, Tuvalu, and other island nations are expected to expend as much as 14% of their GNP each year on countermeasures. Since these island nations are contributing virtually nothing to the greenhouse gas emission that is a cause of global warming, those countermeasures should not be made the problem of the individual island nations, but should be studied within the framework of global countermeasures.
Table 2-2-1 shows calculations using AIM for the potential changes in agricultural production that can be expected in countries in the Asian region due to the effects of global warming. According to these calculations, while some countries, such as China or Bhutan, are predicted to show increases in rice production, major decreases in wheat and maize production are predicted for such global production leaders as China, India, as well as other countries. For example, China in FY1991 was the world's largest wheat producing country, with slightly less than 20% of the world wheat total. Under the effects of global warming, however, production volumes for winter wheat could decline by 15% and by about 21% for spring wheat. India, a nation which produces just under 10% of the world's wheat, is predicted to see a massive 55% decrease in the production volume for winter wheat due to global warming. Considering that large increases in food demand can be expected as population rise, it is feared that the decline in grain production due to the effects of global warming will have an amplified effect on world food supplies. Figure 2-2-9 shows geographically the potential changes in winter wheat production in the Asian region. Regions shaded in red to orange represent areas expected to experience production decline, which include northeast China, Mongolia, central Asia, southeast China, and a broad band spreading across northeast India and Bangladesh. In Japan, rice and winter wheat are predicted to show slight increase, spring wheat to show a slight decline, and temperate zone maize to show a 50% drop in production.
Table 2-2-1 Estimated Climate-induced Changes in Agricultural Production in Asian Countries in 2100
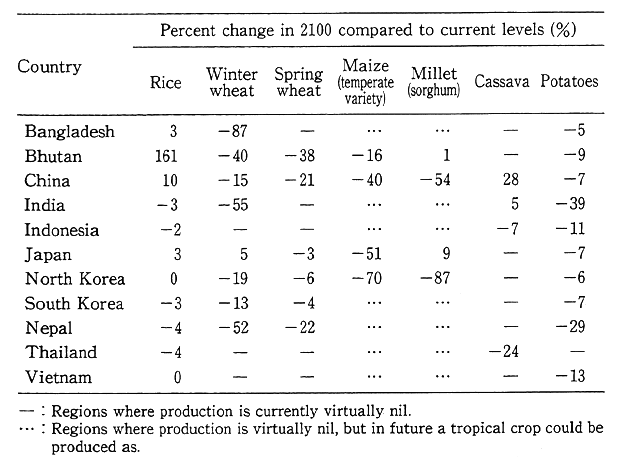
Source: AIM (National Institute for Environmental Studies, Nagoya University)
(2) Increased sulfur dioxide emission volume
A discussion follows on emission forecast for sulfur dioxide, which is an important substance both for local air pollution and for acid rain, the effects of which can spread beyond national borders. While forecast of sulfur dioxide emission volume can vary greatly depending on the degree of emission control measures assumed, under the assumption of an economic growth rate averaging 4.1% in the Asia-Pacific region, and of a population growth rate of 1.4% annually, and that no particular measures are taken, then the emission volume from the Asia-Pacific region could rise in the period from 1990 to 2025 from about 52 million tons S02/year to about 200 million tons S02/year, an increase of 3.8 times. Since the effects of sulfur dioxide are closely related to the location of emission sources, emission intensity (burden of emission per unit of area) by region in China taking population movement into account is shown in Figure 2-2-10. According to this survey, emission intensity in such major cities as Beijing, Shanghai and Chongqing are generally high in 2025 compared to 1985, while emission intensity may fall in such areas as Tibet where population is expected to decline.
Figure 2-2-11 shows forecast of the sulfur dioxide emission intensity and the accumulated population residing in that environment in China by region. It is assumed that the population, which was 1.04 billion people in 1985, will reach 1.54 billion people in 2025, and that the economic growth rate through 2025 will be 5.3% annually, after which it will be 3.9%, and that energy consumption volume will be pushed up in response to increased demand for all kinds of energy services from 25EJ in 1985 to 170EJ in 2050 (at about the level of per capita now prevalent in OECD countries). The sulfur dioxide emission intensity in 1985 reached a maximum 72 tons S02/(km2-year), and was more than 2.5 tons S02/(km2-year) in the regions where half the people lived (hereafter referred to as "50%-region"). Even with these values, some Chinese cities are already suffering from severe air pollution due to sulfur dioxide, as was noted in Section 1. In Japan, the sulfur dioxide emission intensity per unit of land area (national average) was about 13 tons S02/(km2-year) in the late 1960s, when air pollution was at its worst. Not taking into consideration the possibility of population movement, the maximum value for emission intensity in 2025 is predicted to exceed 160 tons S02/(km2-year) while the emission intensity for the 50%-region (equivalent to a population of 770 million) is expected to reach 15.7 tons SO2/(km2-yaer). Furthermore, it is estimated that the 50% region in 2050 (equivalent to a population of 810 million) will have 20 tons SO2/(km2-year) (Figure a). Furthermore, if the population movement is taken into consideration, while the emission intensity for the 50%-region will not change much, regions with higher emission intensity then begin to show huge increases (Figure b). For example, whereas the emission intensity for the vertical axis of 250 million people is expected to be 50 tons SO2/(km2-yaer) in 2025 if no population movement occurs, it rises to 70 SO2/(km2-yaer) a difference of about 1.5 times if population movement is taken into consideration. More-over, it can be predicted that concentration of population into the cities will have a further greater influence on air pollution.
Fig. 2-2-9 Change in Potential Production of Winter Wheat in the Asian Region (1990/2010)
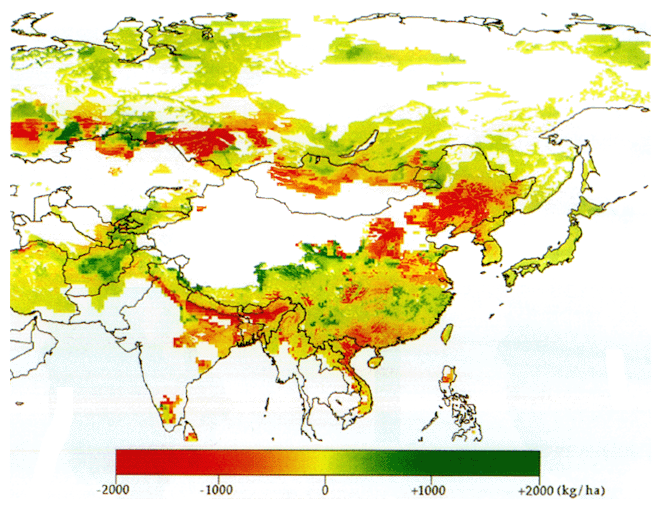
Source: AIM (Nagoya University, Yuzuru Matsuoka, National Institute for Environmental Studies)
Fig. 2-2-10 Sulfur Dioxide Emission Intensity (1985, 2025)
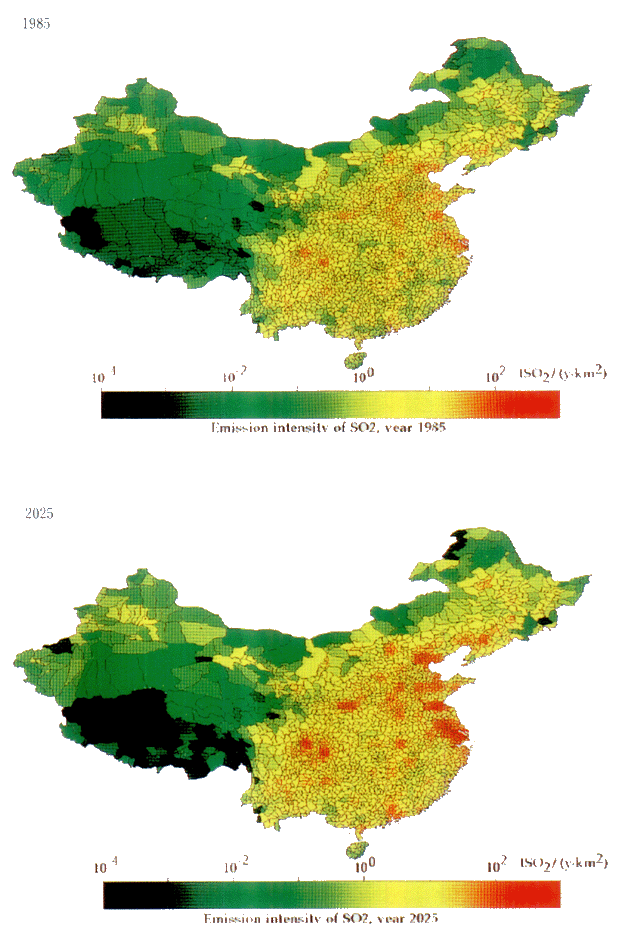
Source: AIM (Nagoya University, Yuzuru Matsuoka, National Institute for Environmental Studies)
Fig. 2-1-11 Forcast of Sulfur Dioxide Intensity and Accumulated Population Living in Such Environments
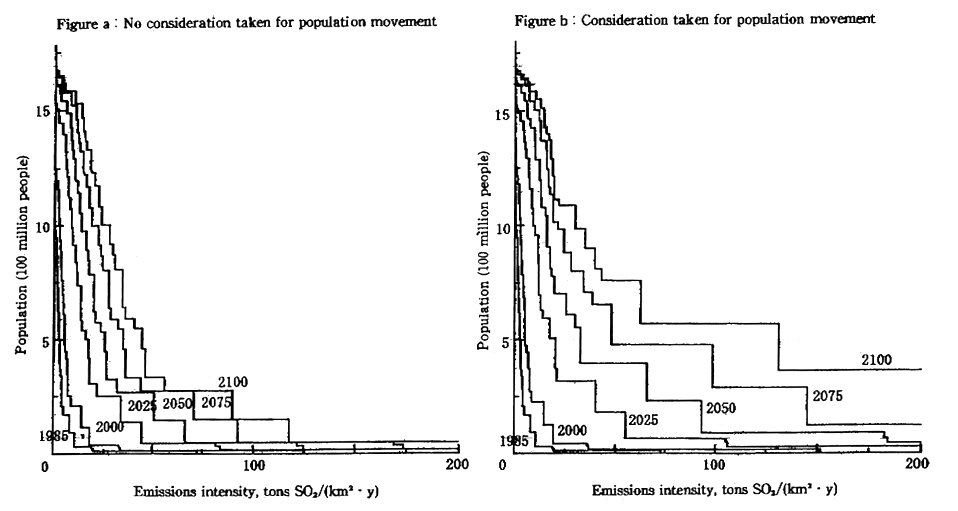
Source : AIM (National Institute for Environmental Studies, Nagoya University)
(3) Decline of tropical forests
The United Nations Food and Agriculture Organization (FAO) has estimated that there were 1,756 million hectares of tropical forest existing in the world as of the end of 1990, of which 52% was found in South America and Caribbean countries, 30% in Africa, and 18% in the Asia-Pacific region. The forest declines in size by as much as 15.4 million hectares every year, of which 3.9 million hectares of tropical forest are being lost every year in the Asia-Pacific region, a region that already had less surviving forest areas than the other regions, with a rate of decline that, at 1.1% annually, is the fastest rate in the world. While the reasons for tropical forest decline include conversion to agricultural land, excessive harvesting of materials for charcoal and firewood, inappropriate commercial lumbering, excessive grazing, and many other factors, the various research results examined to date appear to show that there is a strong mutual relationship between increased population density and declining tropical forest land through the conversion of land to agricultural use, etc. Figure 2-2-12 focuses on this point, using AIM to examine the future population of each country, based on United Nations forecast for life expectancy, birth rates, etc., and then working from those figures to estimate the future degree of tropical forest decline. In this calculation, using population growth as a factor, about 2 million hectares of forest will disappear in Asia each year until about 2015, after which the amount of forest decline will decrease to approximately one million hectares annually in 2050, and to about 0.2 million hectares annually by 2100. As a result, the amount of tropical forest remaining in the Asia region is predicted to fall by more than 40% between 1990 and 2100, from 311 million hectares down to 180 million hectares. Furthermore, since the decline in tropical forests is also greatly influenced by other factors that are not directly related to population growth, such as large-scale development, etc., the actual area of decline will probably be even larger. The actual decline in the amount of forest area itself is smaller than the decline in South America or Africa. However, considering how little area survives even now, it can be expected that the decline will have a huge effect on the global-scale climate adjusting function that the tropical forests fulfill in the Asia-Pacific region, on their wildlife diversity conservation function, and on their carbon dioxide absorbing and fixing function. Their preservation is therefore an urgent issue.
Fig. 2-2-12 Comparison of Tropical Forest Decline Forecast by Region
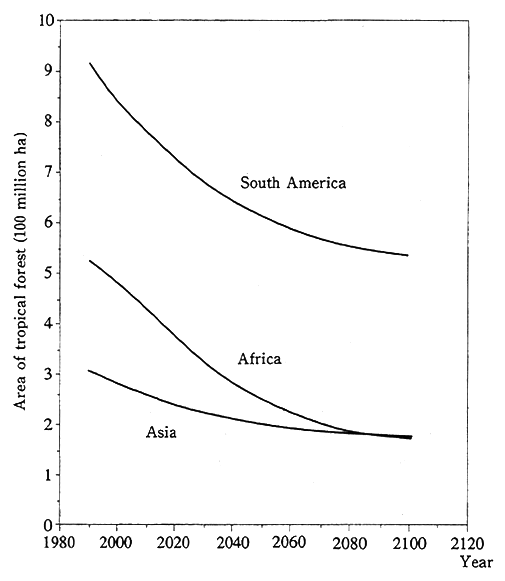
Source: AIM (National Institute for Environmental Studies, Nagoya University)
Section3. Sustainable Development in the Asia-Pacific Region and Japan's Role
1. State of Efforts in Countries of the Asia-Pacific Region
As noted thus far, due to increasing population, poverty, urbaniza-tion, industrialization, the environmental problems of countries in the Asia-Pacific region have become serious. For a look at people's aware-ness of these environmental problems, a Gallup International survey taken in 1992 asked people living in the Republic of Korea, India, Japan, the Philippines, and other countries, considering environmental prob-lems at the local, national, and global levels, at which level they believed the environment was becoming worse. Those in Japan, the Philippines, etc., thought the environment was becoming very bad at the global level, while those in the Republic of Korea and India responded that the environment was becoming very bad at the national level. In addition, asked to consider whether environmental problems can have an effect on health, at the three points in time of 10 years ago, the present, and 25 years after, those in Japan, Finland, etc., were relatively more concerned about future effects than about the effects today, while those in the Philippines, India, and the Republic of Korea responded that they were equally concerned about effects today and in the future (Table 2-3-1).
In addition, one cause of environmental problems in the Asia-Pacific region that has been pointed out is the shortage of technology, capital, and personnel, which has led to a lack of development of drinking water and sewer lines, and other sanitation facilities and infrastructure in the cities where population and industrial plants are congregating, and that the technologies and facilities for environmental protection measures at corporate plants are inadequate. In FY1992, the Institute of Developing Economy joined with the Thai State Economic and Social Development Agency to conduct a survey of Thai corpora-tions (603 companies) concerning their awareness and countermeasures, and found that 36.4% of large corporations, 19.7% of medium-sized corporations, and 11.3% of small corporations believed that pollution prevention facilities were necessary, while those who believed that such measures were not necessary included 53.3% of large corporations, 73.8% of medium-sized corporations, and 75.6% of small corporations, thus revealing a difference in awareness toward the installation of pollution prevention equipment according to corporate size. And in a survey conducted in FY1991 with the Research Center of Science and Technology Promotion and Development of the State Commission on Science and Technology in China (targeted at 211 corporations and 1,734 people), many of the small-scale corporations, with fixed capital assets of 10,000 yuan to 50 million yuan, said that a shortage of capital was the main difficulty concerning the working state of pollution prevention facilities in China. Corporations with fixed assets of more than 100 million yuan, however, tended to respond that the problem lay more with a shortage of technicians than with a shortage of capital (Table 2-3-2).
Table 2-3-1 Awareness of Environmental Problems by Countries
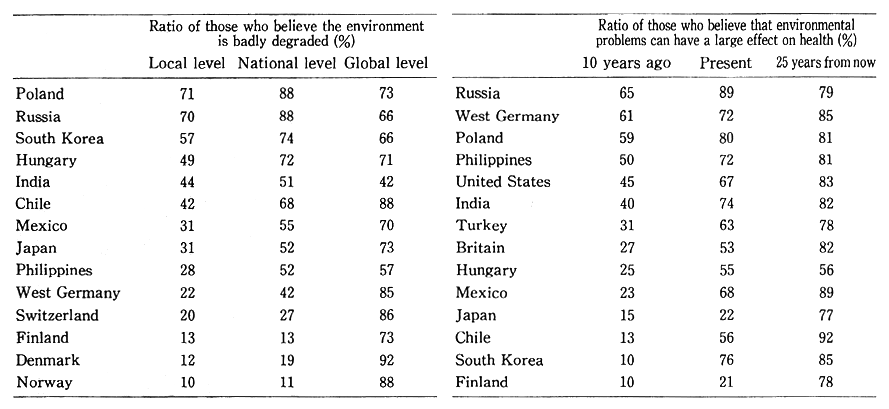
Reference: Gallup International "The Health of the Planet Survey '92"