Quality of the Environment in Japan 1994
The Nordic countries of Sweden, Norway, Finland, and Denmark as well as the Netherlands are introducing environmental taxes on carbon and various other substances in the 1990s with the aim of reducing CO2 emissions, the principal cause of global warming. Besides these taxes, these nations are also changing tax rates, introducing tax exemptions in the production and energy areas, and implementing other policies on a trial-and-error basis. In the United States, a presidential initiative in 1993 called for wide-ranging energy taxes on British thermal units (BTUs). However, the proposal was not ratified and action was limited to a 4.3 cents per gallon increase in the transportation energy tax on gasoline (about one cent per liter). Additionally, Rule 16 of the Rio Declaration adopted at the Earth Summit states that "The authorities in each country, in considering the principles for costs on polluters and weighing the appropriate costs and benefits, must endeavor to promote internalization of environmental costs and use of economic measures without building obstacles to international trade and investment."
In Japan, a report by the Central Environmental Review Board and the Nature Conservation Review Board (Ways of Implementing Basic Environmental Legislation, October 20, 1992) recognizes the need for the following in responding to contemporary environmental problems : "The nation, regional governments and public corporations, businesses, citizens, and all constituents must take active and independent actions and examine the environmental impact of all socioeconomic activities. The adoption of wide-ranging support measures aimed at applying emission controls on polluting substances and other regulations and economic measures; undertaking environmental impact appraisals; and providing necessary capital for active participation by business and citizens are being considered."
Furthermore, the Government Tax Investigation Board submitted two reports, Ways To Apply Future Tax Systems and [Aiming at] An Equitable and Vital Aging Society to Prime Minister Hosokawa in November 1993. Drawing on trends and discussions in Japan and abroad on environmental taxes, the board wrote that: "Discussion on tax systems for combating environmental problems is divided into two groups looking at the matter from different angles, (1) applying "eco nomic measures" for environmental pollution control, and (2) using "resource provision measures" to deal with environmental problems in Japan and overseas. In any event, it is necessary to promote further study and research on tax systems that will prevent environmental problems while looking carefully at progress on this debate in Japan and abroad."
Moreover, the OECD Environmental Performance Review advises Japan to apply further economic measures after pertinent studies and consultation.
In Japan, economic measures applied at the national level include levying taxes through an assessment system on aircraft noise, while efforts at the local level include charging for waste collection.
Against this backdrop, Article 22 of the Basic Environmental Law passed in November 1993 prescribes the provision of necessary and appropriate financial assistance as a means of overcoming obstacles to environmental preservation and provides for economic burden-sharing policies. The law clearly recognizes that these measures are expected to be effective and to follow international recommendations. Moreover, because taxes, surcharges, deposits, and other individual measures have an impact on citizens, it is necessary that pertinent investigations and research be conducted on their effects and economic influence. When individual measures are necessary, efforts based on these investigations and research should be made to secure the understanding and cooperation of citizens in applying burden-sharing measures and overcoming obstacles to environmental preservation. Furthermore, when such measures are on a global scale, international cooperation will be solicited to ensure their effectiveness.
In parallel with the pursuit of the law's objectives, it will be necessary to conduct consultative investigations on technological accomplishments and precedents in Japan and abroad.
(2) Global Application of Economic Measures
As was seen previously, economic measures recommended by the OECD include (1) the levying of surcharges and taxes, (2) the buying and selling of emission rights in the market, (3) the establishment of deposit systems, and (4) the, provision of funding assistance (subsidies). The following are examples of these measures as applied in various foreign countries based on OECD investigations and other sources.
a, Taxes and surcharges
A wide range of taxes are applied under the generic classification of environmental tax. These taxes have the goals of directly or indirect- ly reducing elements negatively impacting the environment or decreas- ing the volume of pollution-causing emissions. Examples of such taxes in effect in foreign countries include carbon taxes to reduce CO2 emis- sions, sulfur taxes to encourage conversion to other energy sources, financial costs to polluters for waste product disposal, and taxes on nonreusable drink containers to promote the establishment of recycling systems.
Surcharges also come in various forms and include disposal surcharges, which are levied based on the quantity or quality of prod- ucts at time of disposal and thus decrease the environmental impact of disposable items as well as user surcharges, which are levied for dis- posal services, the use of public facilities, and the final disposal of nonrecyclable items. Other examples include product surcharges based on quantity or quality that favor treatment of items whose use gener- ates fewer discardable parts after consumption; surcharges for use of nonrecyclable raw materials; and surcharges for collection at the time of production or import. In addition, natural resource surcharges based on quantity and type of products are levied on users at time of import.
(1) Water Quality Preservation
First, compared to their minor position in other environmental areas, economic measures in the water-preservation area have played an important role in OECD nations. Surcharge systems for funding drainage treatment and other purposes have been adopted in almost all OECD nations. There are also examples of surcharges on industries directly discharging fluids into public water bodies. The combination of direct regulations and economic measures for meeting (bio) chemical oxygen requirements is achieving particularly good results. Nitrogen, heavy metals, and other toxic discharges are also common water pollutants in many countries. To prevent water quality deterioration, surcharges are sometimes levied to cover the costs of collection and disposal of discharged liquids, and in some cases, the surcharges aim to reduce water degradation resulting from drainage.
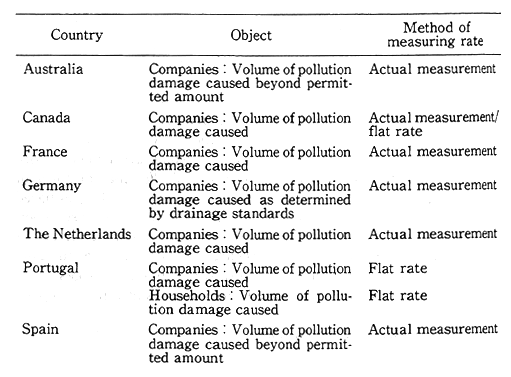
In France, the 1964 Water Deterioration Prevention Law regu-lates a wide variety of water drainage activities. The nation is divided into six regions, each of which maintains a water commission and a public water corporation. These public corporations periodically levy surcharges for drainage and are able to apply the revenue to combat water deterioration. Fees are set for each type of pollutant discharged by individual businesses and multiplied by the volume discharged to compute penalties. Fees are based on the estimated costs of eliminating the external diseconomies. In Germany, drainage surcharges were introduced in 1976 to push reform incentives on water drainage. The federal government has established a surcharge system, with fees imposed on chemical oxygen demand (COD) and heavy metals. After providing proof that they are satisfying substance discharge standards, companies receive reductions in surcharge rates of as much as 75%. In the Netherlands, drainage surcharge amounts are based on the financial costs of improvements in water quality and for sewage treatment. The main organization operating the surcharge system is an independent water commission. Surcharges are imposed on biochemical oxygen demand (BOD) and often on heavy metals. Surcharges are levied both directly and indirectly, and households and small businesses pay a set fee. The surcharges are proving effective in reducing emissions by large companies (Table 3-2-3).
Table 3-2-3 Examples of Drainage Surcharges
Source : OECD materials, 1993
(2) Air Pollution Prevention
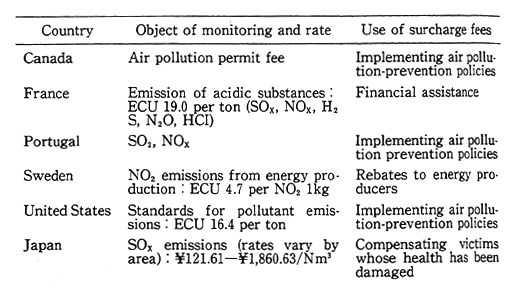
Although regulatory measures have traditionally played the major role in this area, economic measures are now supplementing such: regulations. Many countries impose economic measures merely to generate revenue sources, but energy surcharges can take various forms. Countries have recently been considering broader economic measures to combat air pollution, particularly applied to product and energy use. Sweden introduced a surcharge system for NOx emissions in 1992 with the goal of realizing emission guidelines by 1995. Surcharges are imposed on energy companies that produce more than 50 gigawatt hours of power with an input of more than 10 megawatts with the aim of reducing the discharge of nitrous oxides from boilers and other fixed emission sources, and target 6.5% of Sweden's nitrous oxide emissions. While these measures were expected to lower emissions from such sources by 20% to 25% in 1992, this goal was in fact greatly exceeded, with emissions reduced by some 30% to 40%. France established a public agency to deal with atmospheric pollutants in 1980 with the aim of monitoring air pollution and developing air pollution control technol- ogies, and the agency has the right to order the government to levy special surcharges on polluters. Decisions on how revenues from sur- charges are spent are made by a committee that includes companies paying the levy, and 75% of funds are spent on assistance to such companies for the provision of air pollution prevention equipment and research and development on air pollution technologies. The remaining 25% of funds are allocated for air pollution monitoring networks and other provisions. SOx emission levels are said to have declined 8% throughout France as a result of assistance over the five-year period beginning in 1985 (Table 3-2-4).
Table 3-2-4 Examples of Air Pollution Surcharges
*EUC 1=¥120(March 1994)
Source : OECD materials, 1993
(3) Waste Products
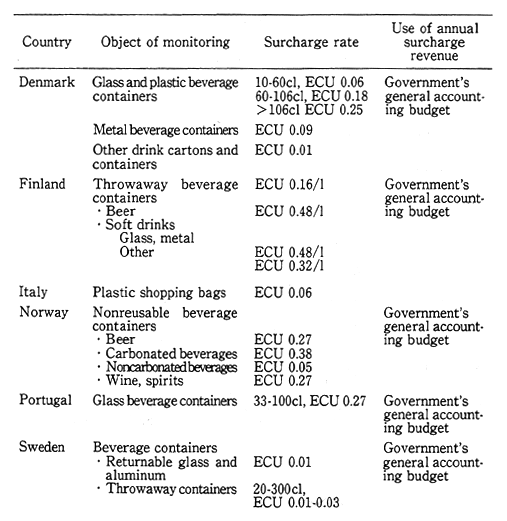
The OECD is classifying and studying surcharges and other taxes on waste products through (1) user surcharges to cover the cost of waste collection and disposal, (2) waste treatment taxes, and (3) surcharges on toxic substances to cover the cost of disposal. In Great Britain, waste collection and treatment is paid for with local tax revenue. In Finland, waste collection for households and businesses is privatized in a number of municipalities. In Sweden, to reduce dry-cell battery disposal, sur-charges have been levied since 1987 on such batteries with combined mercury and cadmium exceeding 0.025% of the total battery weight. Revenue from surcharges on alkali and mercury batteries is allocated for battery collection, final disposal, and publicity. Furthermore sur-charges aimed at lowering the volume of container, packaging material, and other waste after consumption can be found in many countries. In Italy, while consumption of plastic shopping bags decreased 37% between 1983 and 1988, the imposition of surcharges on such items in 1988 has led to a 20% to 30% decline in volume (Figures 3-2-5, 3-2-6).
Table 3-2-5 Examples of Surcharges on Toxic Waste

*EUC 1=¥120(March 1994)
Source : OECD materials, 1993
Table 3-2-6 Examples of Surcharges for Receptacles and Packaging
*ECU 1=¥120 (March 1994)
Source : OECD materials, 1993
(4) Noise
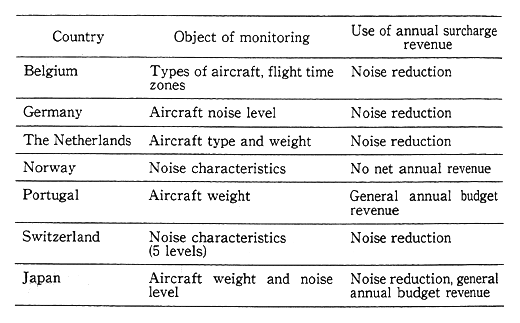
The imposition of economic incentives, although considered to be highly effective in curbing noise pollution, are rarely applied outside the realm of aircraft. According to 1991 OECD guidelines advocating more economic measures, progress on noise-control policies has been slow, and the conditions for introducing such measures have not been favor-able. In various countries, landing fees are imposed based on aircraft weight and noise levels. At two Norwegian airports, noise-linked sur-charge systems have been implemented, and revenue is used to fund private-sector aviation facilities. In addition, as in Germany, the amount of the surcharge varies markedly depending on sound levels, and there has been an increase in the number of comparatively quiet aircraft (Table 3-2-7).
Table 3-2-7 Examples of Surcharges on Aircraft Noise
Source: OECD materials, 1993
(5) Transportation Sector
In the transportation sector, the imposition of regulatory mea-sures and control of licensing approval have been the principal means until now of reducing environmental impact, and the application of economic incentives have been minimal. According to OECD guidelines, many governments try to reach area, production, social, and other policy targets without sufficiently considering the economic costs neces-sary for environmental protection, with the result being further environ mental degradation. In Sweden, environmental taxes have been imposed on domestic aircraft to reduce exhaust emissions since 1989. It is reported that the taxes have contributed substantially to the conversion of combustion chambers and reduced hydrocarbon exhaust levels 90% (Table 3-2-8).
Table 3-2-8 Examples of Environmental Taxes Levied on Automobiles
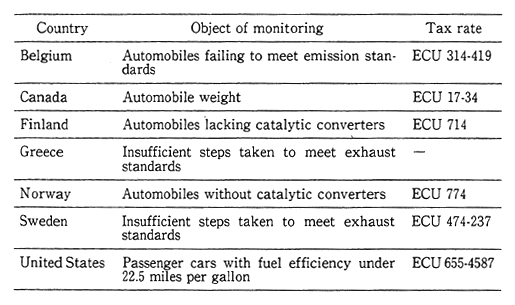
*1ECU=¥12O (March 1994) Source: OECD data, 1993
Table 3-2-9 Examples of Carbon Taxes
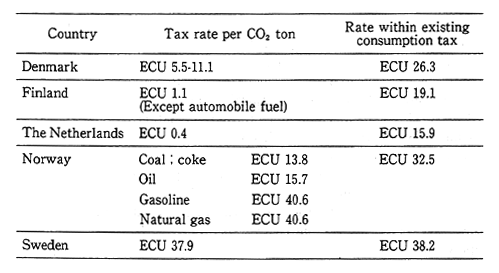
*1ECU=¥l20 (March 1994)
Source: OECD data, 1993
(6) Energy Sector
In the energy sector, there are examples of energy taxes, favorable-treatment policies, and financial assistance.
The EC Commission proposed a carbon/energy tax in September 1991 targeting carbon fuel and energy amounts. After conducting a study of the matter, in May 1992 the EC Commission proposed a new energy tax (carbon tax 50%, energy tax 50%). However, the board of directors has as yet been unable to pass the initiative. Additionally, in the United States, an attempt to introduce a BTU tax failed, and initiatives were limited to the raising of transportation fuel taxes.
In the Nordic countries of Sweden, Norway, Finland, and Den. mark as well as the Netherlands, carbon-fuel and various other environ- mental taxes are being introduced in the 1990s with the aim of reducing CO2 emissions, the principal cause of global warming.
(7) Agricultural Sector
In the agricultural sector, it has been difficult to enforce regula-tions, except in prohibiting use of agricultural chemicals that adversely affect human health, and thus the application of economic measures that clearly assist in preserving the environment have been limited. OECD guidelines call for nations to address problems specifically caused by existing long-term policies that distort prices of agricultural products and that encourage overproduction and overuse of land, exces-sive use of chemicals, and one-crop specialization among individual farms and even whole regions. According to the OECD, many countries are paying greater attention to ways of applying pollution-cost princi- ples to the agricultural sector. They also recognize the difficulty of such an undertaking because of the expenses and other problems entailed in identifying polluters and their activities and in conducting monitoring and surveillance. Many countries are therefore not working diligently to apply such policies. Other prominent policies include imposing sur-charges on investment assets and introducing other economic measures. For example, in 1988, Norway introduced a tax on chemical fertilizer to secure revenue sources for environmental improvements in the agricultural sector and to reduce chemical fertilizer use. In Finland, the Netherlands, and other nations, economic incentives applied for similar purposes have been effective in reducing fertilizer impact on the environment (Table 3-2-10).
Table 3-2-10 Examples of Surcharges on Fertilizers and Agriculturalb Chemicals
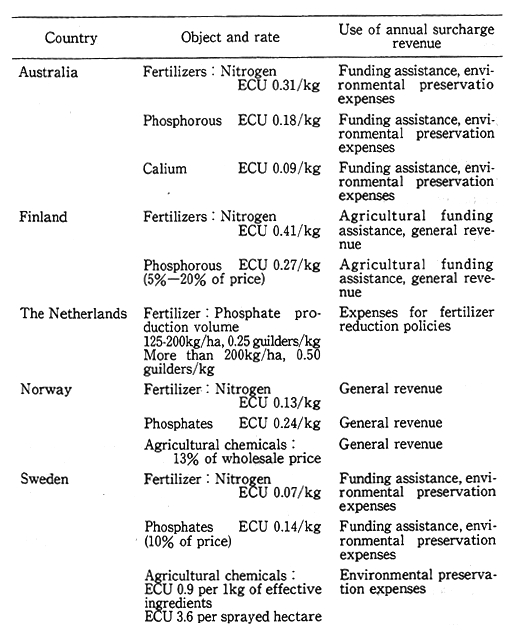
ECU 1=¥120 (March 1994)
Source : OECD materials, 1993
b. Buying and Selling of Emission Rights
The system of emission rights is defined as the allocation in advance of rights to emit certain levels of wastes to individual pro-ducers, with the further provisions for the buying or selling of such rights. The sale of such rights falls into several categories. For example1 according to 1990 revisions in the the U.S. Air Pollution Purity Law, a system for selling approved emission quantities was introduced to help prevent acid rain. The revised law sets targets for CO2 sulphate emis-sions at 890 tons per year, or 1,000 tons below the 1980 level, by the year 2000 for each unit at all U. S. nuclear power plants. The emission amounts allotted to each nuclear power unit are negotiable through sale. The U. S. Environmental Protection Agency is monitoring emission amounts to ensure compliance with the law and will levy surcharges if emissions exceed allotted volumes. In addition, to reduce the production and consumption of ozone-depleting substances, the United States maintains a trading system for CFC and halogen production and con-sumption rights. Production rights are granted to producers based on 1986 amounts, and consumption rights are assigned to producers and importers (Table 3-2-11).
Table 3-2-11 Examples of Transactions of Emission Rights
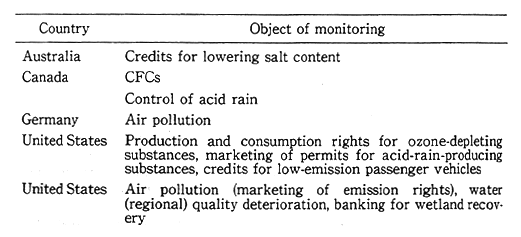
Source : OECD materials, 1993
c. Deposit Systems
The deposit and refund system is 'defined as a system in which deposits are made when purchasing products that are potentially harmful to the environment and payment is reimbursed when such harm is circumvented by the user taking steps to return the product or dispose of its waste byproduct. In various OECD nations, for example, such systems are often used for beverage containers, with an average recov-ery rate of approximately 80%. Other examples are the use of deposit systems for throw-away batteries, plastic, and agricultural chemicals. In Sweden, such a system has been established to deal with the noticeable number of discarded and abandoned cars since the 1970s. First, a commission system for abandoned cars was introduced under which owners were required to pay an automobile tax until undertaking prescribed procedures to discard their vehicles. Then, a Pant system (deposit system) was adopted, and, as a result, the number of illegally abandoned cars is being controlled. The buyer, at the time of purchase, pays a set amount into a fund. Later, the buyer need only go through the established procedures for discarding the vehicle to receive payment from the fund. This repayment exceeds the expenses entailed in discard-ing a vehicle, and the system has been highly effective. Under the deposit system for discarding automobiles used in Greece, repayment only occurs if the buyer purchases a new car meeting EC gas emission standards.(Table 3-2-12)
Table 3-2-12 Examples of Deposit Systems
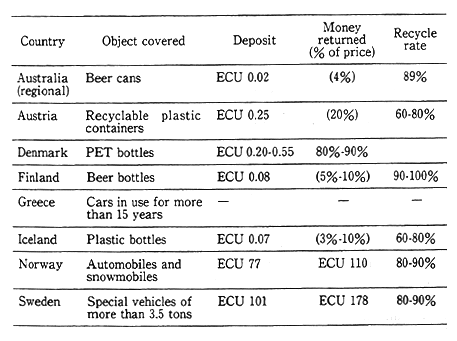
ECU 1=¥120 (March 1994) Source : OECD materials, 1993
d. Funding Assistance (Subsidies)
The Basic Environmental Law stipulates that economic assis-tance for the purchase of pollution prevention equipment be made available to those parties placing undue burden on the environment and for measures to help these polluters undertake their own initiatives in reducing environmental impact. The objective of environmental assis tance is to enable (1) effective efforts by all parties to implement environmental policies, (2) minimal pollution impact from production activities themselves, and (3) individual responses to problems in each nation. Subsidies, which provide incentives for initiating policies through financial assistance, can be considered negative taxes or sur-charges. Therefore, from the government perspective, subsidies serve to internalize or factor in the social costs of pollution. Examples of the use of such policies to combat industrial pollution can be seen in many nations.
In Japan, various assistance measures have been developed for introducing clean energy and promoting energy saving Specifically, the passage by the Diet of the Law for Relevant Legal Provisions to Improve Energy Supply-and-Demand Structures and the Extraordinary Measures for Promoting Business Activities That Use Energy Ration-ally and Employ Recycled Resources have expanded financial assistance.
3-2-3 Environmental Resource Accounting
(1) A Summary of Environmental Resource Accounting
As discussed previously, pollution in urban areas and our daily lives as well as global environmental problems have their basis in general socioeconomic and every-day activities, and to solve these problems, independent and active efforts by all members of society are essential. Therefore, integrating environmental and economic policies is an important goal. To achieve this end, a variety of measures, including the establishment of a basic environmental plan that includes economic measures and environmental accounting as principal components are being considered. To structure a society characterized by sustainable growth and minimal environmental impacts, the importance of compre-hensive environmental and economic evaluation indexes that link environmental considerations with economic growth is increasingly recog-nized internationally. The present System of National Accounts (SNA) takes into account a broad and representative sample of economic activities in Japan and, by calculating changes in the economic value of resource stocks through adjustment accounting, it has a relation with environmental preservation. However, because SNA does not clearly take into account the impact of environmental pollution by the proces-ses of production and consumption on the quality of life, the reduction in wildlife species, or the depletion of mineral resources and other irreplaceable assets that will restrict the choices of future generations, it is necessary to develop a supplementary accounting system to take its place. Internationally, since the end of the 1980s, there has been growing recognition that GNP, GDP, and other economic indexes calculated from the current SNA do not reflect the aspects of environmental pollution, and that developing overall evaluation indexes linking the economy and the environment are necessary for economic policy deci- sion making.
There are a number of different approaches to environmental resource accounting.
Fig. 3-2-1 Chart of Satellite Accounts and Natural Resource Accounting
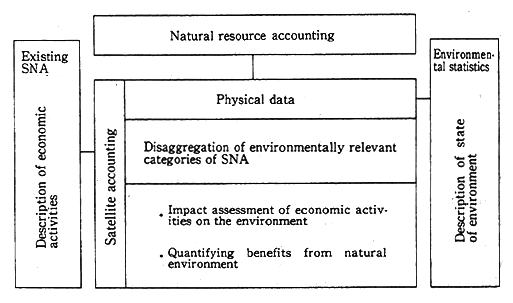
Fig. 3-2-2 Pilot Study of Mexico
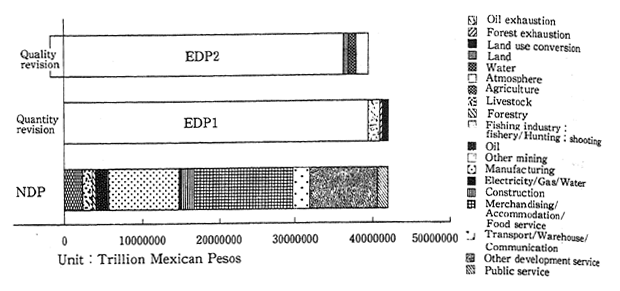
Unit : Trillion Mexican Pesos
One approach is to systematically keep records of stocks and economic activities involving the flow of extraction, conversion, use, and the disposal of such natural resources as forests and water. France, Norway, and the OECD Group on the State of the Environment, which is led by these two nations, are taking this approach. The second approach is to evaluate the economic costs of destruction from pollution and depletion of natural resources and to reassess GNP and GDP from an environmental standpoint through subtracting such costs from the current value of these indexes. The former, often called Natural Resource Accounting, is a quantitative approach, while the latter is a monetary approach to accounting. An example of the latter approach is provided by a pilot study held in Mexico in 1990-1991, which had been conducted through the cooperative efforts of the United Nations, the World Bank, and the Mexican government. Mexico's environmentally adjusted net domestic product (EDPl) is quantitatively calculated first, and then qualitative revisions are added to calculate EDP2. In 1985, Mexico's net domestic product (NDP) was 420,605 billion pesos ($1 =256.87 pesos, 1985 average, according to the IMF). Regarding the effects of petroleum depletion, new oil well discoveries, forest resource depletion, and changes in land use as the quantitative factors, and by applying revisions to these factors, EDP1 amounts to 396,627 billion pesos. Upon further revision to account for qualitative changes, as shown in Figure 3-2-2, EDP2 becomes 364,483 billion pesos. This amounts to approxi-mately 87% of NDP, implying that quantitative and qualitative revi-sions add up to some 13%. Qualitative revisions include such items as soil runoff, solid waste production, underground water use, water quality deterioration as well as the release of SOx, NOx, hydrocarbons, carbon monoxide, suspended particulate matter, and other atmospheric pollutants, all of which are detrimental to the environment. These revisions monetarily take into account the amount of fertilizer needed to balance soil runoff in order to maintain crop production at steady levels, the expense of replacing depleted underground water sources and the cost of reducing water and air pollution levels. While taking different approaches may be necessary for understanding the relation- ship between environmental preservation and economic activities in the industrialized nations, these studies serve as a beneficial example of such relationships in the developing countries.
Fig. 3-2-3 Satellite System for Integrated Environmental and Economic Accounting for SNA
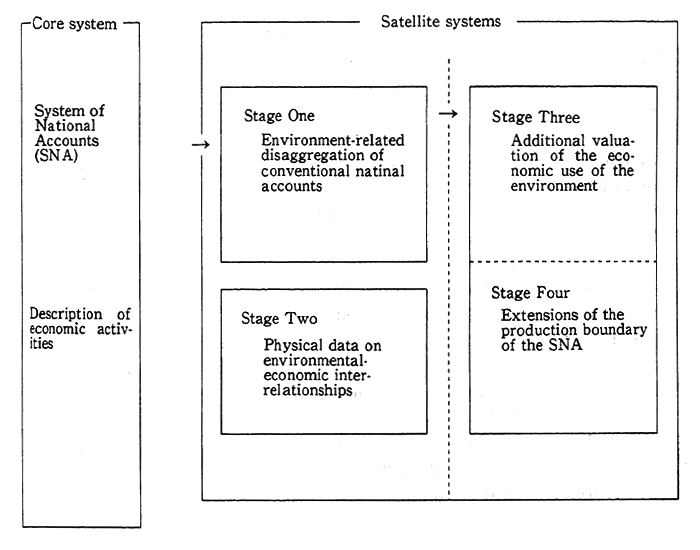
The Expansion and change of concept
The Expansion and change of concept The following summarizes the principal trends in and out of Japan concerning environmental resource accounting.
(2) International Conditions Concerning Environmental Resource Accounting
(1) The Earth Summit
The need to integrate environmental and economic policies was also recognized at the Earth Summit in that, for instance, economic policies were examined from the environmental perspective. In Agenda 21 adopted at the Earth Summit, the importance of the need is stated in Chapter 8: Integrating environment and development in decision-making, D: Establishing systems for integrated environmental and economic accounting, and Chapter 40: Information for decision making."
(2) United Nations
In 1993, the United Nations revised the SNA and decided to introduce satellite accounting, with the Satellite System for Integrated Environmental and Economic Accounting (SEEA) as its main compo-nent. This system is outlined in the National Economic Accounting Handbook, Integrated Environmental and Economic Accounting (work-ing title). SEEA, expanding on the many existing approaches to environ-mental resource accounting, uses both material and monetary account-ing approaches, progresses through stages, and is flexible to accommo-date the availability of statistics from each country. In the first stage, the natural resource flow described in the existing SNA and details on assets are extracted and analyzed. In the second stage, material calcula-tions, based on the balance between materials and energy and naturalresource account concepts, are extracted and combined with SNA data. In the third stage, environmental degradation and natural resource depletion due to economic activities are described in accounting terms. And in the fourth stage, by expanding the traditional production bound-aries, other production activities such as home cooking and recreationare considered, and such matters as refuse disposal from this secondary - production are dealt with.
(3) OECD
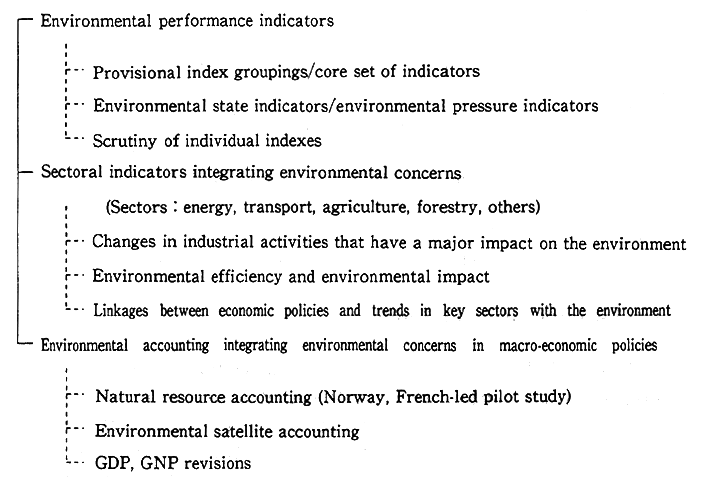
At the 1989 Paris Arche Summit, a statement with the intent to"develop environmental indicators that facilitate decision-making regarding the integration of economic and environmental policies" was incorporated into the economic declaration, and the OECD was entrust-ed with developing such indexes. The OECD is pursuing investigations in three areas: (1) environmental performance indicators; (2) Sectoral indicators integrating environmental concerns; and (3) environmental accounting integrating environmental concerns in macro-economic policies. The January 1991 interim report issued to the OECD Meeting of Environment Committee at Ministerial Level divided environmental and natural resource accounting methods into three areas: (1) natural resource accounting; (2) environmental satellite accounting; and (3) revisions in SNA. The report stated that for the future, it is premature to adopt new economic indexes (generally called Green GNP) that revise SNA itself and reflect environmental changes in place of current GNP. The present focus is on developing supplementary accounting (satellite accounting) reflecting environmental and natural resource conditions beyond the scope of the current SNA. The report also advocated cooperation between the World Bank, United Nations organizations dealing with statistics, and other agencies to achieve this development. Studies by the OECD Group on State of the Environment Conditions are proceeding, and debate on how to use environmental resource account- ing is expected to take place at a meeting scheduled for September 1994.
Fig. 3-2-4 Framework for Development of OECD Environ mental Indicators
(4) Foreign Countries
In the United States, the President's budget proposal of 1994 included appropriations for investigations on green GDP. In concrete terms, the proposal calls for studies to be promoted in three stages. The first stage calls for making preliminary estimates of the economic value of nonrenewable natural resources (coal, petroleum, natural gas, ura-nium, rare mineral resources); devising GDP measurement systems that take into account the depletion of these resources ; and developing frameworks to integrate economic and environmental calculations for renewable natural resources and a broad range of other environmental assets. Next, it requires expanding nonrenewable natural resource accounting to include recyclable natural resources (forests, soil, water, fish). Last, it calls for increasing the scope of numerical accounting values to include such environmental assets as clean air and renewed resources. This last step, however, is extremely difficult to instigate in conceptual terms and in terms of gathering data. In Canada, satellite accounting for natural resource stocks and their use, waste and other pollution emission, and pollution prevention is under development. The main purposes are to conduct qualitative and quantitative evaluation of resources, provide a framework for collecting environmental data, and improve planning for economic sustainability. Elsewhere, France will be promoting research on national property accounting in the coming years. Conceptually, the system will incorporate ecological, economic, social and environmental considerations. In Germany, research to pro-mote the development of environmental satellite accounting is under way. The aim is to gain an understanding of the physical conditions affecting the environment and examine the relationship between economic activities and changes in physical circumstances. Norway is approaching the subject by studying physical resource accounting. By gaining an understanding of natural resources and pollutants, the nation will analyze the relationship between this flow and economic activities.
(3) Japanese Investigations
The Basic Environmental Law recognizes that developing a new comprehensive evaluation index system that links environmental and economic concerns is an important matter, that clarifying the mecha-nisms of the changes in the environment is essential as a technology for environmental preservation, and that, in addition to reducing the burden on the environment from human activities, environmental preservation and socioeconomic activity are clearly linked.
Specifically, Article 30 stipulates that structural changes in the environment should he clarified and technologies that provide compre-hensive appraisal mechanisms for reducing the environmental impacts of economic activities and lessening environmental costs should be promoted.
Following the preparatory research in fiscal 1991, in fiscal 1992 the Environment Agency's National Institute for Environmental Studies, the Economic Planning Agency's Economic Research Institute, and the Ministry of Agriculture, Forestry, and Fisheries' Forestry Research Center and Agricultural Research Center began working to establish environmental resource accounting systems using general funding for global environmental research. These institutes are also examining supplementary systems that integrate environmental and economic accounting (including investigations of SEEA methods) with SNA.
The National Institute for Environmental Studies has already conducted a "Sustainable Growth" concept review to facilitate the development of accounting systems that reflect global environmental changes. The institute is devising a program to draw up trade OD matrix charts for major nations and regions and is making sample calculations using basic data to understand international environmental impact and CO, emissions.
(4) Future Issues
There are great expectations regarding the effectiveness of environmental resource accounting in Japan and abroad. However, a large number of problems must be resolved hef ore this approach can actually be used as a decision-making tool. First, from the standpoint of methodology, economic methods of appraising environmental values are not sufficiently developed. The second problem concerns data collection. Environmental problems are, of course, linked with every possible economic activity, and collecting the relevant informaticyn requires a comprehensive technological, well-organized, and systematic approach. The development of a methodology is currently the central issue, but in the future it will be necessary to establish and review information-gathering systems for the use and management of environmental resources to facilitate the calculation of numerical values and prepara-tion of reports.
In the future, it will be necessary, based on the trends in interna-tional research, to develop comprehensive appraisal mechanisms for environmental resource accounting and the evaluation of other enviroyn-mental and economic conditions, instigate measures to put these mecha- nisms into use, and promote integrated environmental and economicpolicies.
3-3 New Environmental Policy Initiatives by Regional Governments and Public Corporations
3-3-1 The Formation of New Regional Comprehensive Frameworks
(1) Environmental Regulations
Regional governments and public corporations are implementing the Basic Environmental Regulations and stepping up efforts to promote comprehensive and systematic regional environmental preservation policies in response to wide-ranging day-to-day, urban and global prob-lems. Kumamoto Prefecture and Kawasaki adopted the Basic Environ-mental Regulations in October 1990 and December 1991, respectively. These regulations identify global environmental preservation policies; clarify the responsibilities and tasks to government, business and indus-try, and the public ; and stipulate that local governments pass the Basic Environment Plan to ensure that comprehensive environmental policies are effectively implemented. (Kawasaki passed the plan in February 1994.)
Tokyo issued a report informally adopting the Basic Environmen-tal Regulations in November 1993, while Osaka Prefecture adopted the regulations in March 1994. Furthermore, Kobe completely revised its Kobe Citizens Environmental Preservation Regulations in March 1994 as a result of recommendations put forth by its basic environmental planning committee and its adoption of the Basic Environment Law.
(2) Policies and Planning Concerning Global Environmental Preservation
Many regional governments have initiated global environmental preservation policies and plans in recent years. These include Yamana-shi Prefecture's Policy Initiative on Global Environmental Problems (July 1990), Aichi Prefecture's Policy Initiative on Global Environmental Problems (July 1990), and Tochigi Prefecture's Policy Initiative on Global Environmental Problems (November 1990). As of October 1992, 45 prefectures and municipalities had introduced such environmental plans, and studies are under way in other lcycal jurisdictions.
In May 1992, the Tokyo Municipal Government passed the Global Environmental Protection Action Plan to focus efforts on addressing such important global environmental issues as global warming, acid rain, and ozone depletion. Other policy measures initiated at the prefectural level include Shizuoka's Earth-Friendly Practical Action Plan (June 1992), Kanagawa's Agenda 21 Kanagawa (February 1993), Hiroshima's Econet 21 Hiroshima (August 1993), and Chiba's Global Environmental Preservation Plan (November 1993).
The Agenda 21 plan adopted at the Earth Summit attaches particular importance to initiatives by regional governments and public corporations to achieve sustainable economic development and calls for the adoption of the Local Agenda 21 plan to focus on concrete domestic action programs at the regional and local levels. The provisions of the Agenda 21 Kanagawa and the Econet 21 Hiroshima plans are based largely on this program for regional action, which encourages dialogue between citizens and businesses and sets out concrete action plans for government, the public, and companies to help tackle local environmental problems from a global perspective. Also, many regional public agencies are investigating ways to adopt such comprehensive environmental plans. The Environment Agency held a study session for establishing guidelines in line with the Local Agenda 21 plan in December 1993 and is continuing to promote the plan.
Other efforts are being made to adapt the existing environmental management plans of regional governments and public corporations to better accommodate the needs of the international community. The Hokkaido Environmental Management Plan (February 1989), the Osaka Municipal Environmental Management Plan (July 1991), and the Osaka Prefecture New General Environmental Plan (September 1991) were passed by their respective regional governments to take into account global environmental concerns in addition to those pertaining to local matters.
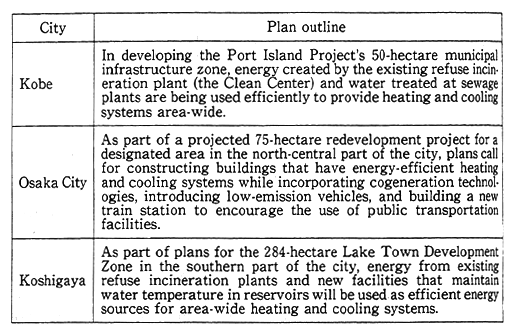
Regional governments and public corporations can be expected to play an active role in implementing action plans to prevent global warming. To ensure cooperation in coordinating policy at the national level, pertinent agencies are being supplied with information and basic policy guidelines, and support measures are being devised to ensure the effective implementation of policy initiatives. The Environment Agency created a system to help local businesses establish global-warming prevention programs and address various aspects of this problem in specific municipalities in fiscal 1992. The agency also established Guidelines for Implementing Regional Promotion Plans for Preventing Global Warming to further the process of regional governments and public corporations in confronting this environmental problem. In line with these guidelines, the support system for helping these regional governments introduce regional promotion plans (master plans) for combating global warming was expanded in fiscal 1994. The following is an outline of municipal business plans to prevent global warming that were initiated in the cities of Kobe, Osaka, and Koshigaya (Table 3-2-13).
Table 3-2-13
In fiscal 1993, the Environment Agency assisted Aichi, Hyogo, Saga, and Oita prefectures and the municipalities of Sendai, Chiba, and Fukuoka in setting up regional environmental promotion plans and Okayama Prefecture in establishing a regional business plan.
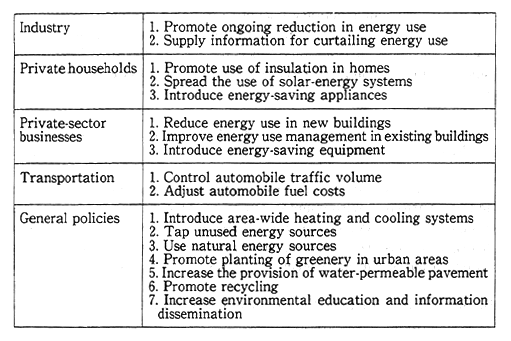
(3) The municipality of Yokohama established the Yokohama Energy Vision plan in December 1993 to promote more efficient use of energy by the public, business, and governmen ; to address the problems of global warming and atmospheric pollution; and to conserve energy resources. The plan sets two basic targets for promoting efficient energy use. The first target, under the premise of meeting the Oil-Substitution Energy Supply Goal and in line with the long-tem outlook for energy demand, is to keep the average annual increase in demand for energy consumption in the city between fiscal 1990 and fiscal 2010 from exceeding 1.2%. The second is to work to stabilize per-capita CO2 emissions at approximately the 1990 level in line with goals of the Action Plan for Prevention of Global Warming. All publicand private-sector organizations are expected to clearly state measures to be introduced and promoted as well as to calculate the effectiveness of these measures in reducing energy and attaining these goals.
Table 3-2-14 Yokohama Energy Vision (Implementation and Promotion Policies)
(4) Charters and Declarations Concerning Global Environmental Preservation
Several regional governments and public corporations have drawn up charters and declarations concerning global environmental preservation. These include the Tokyo Declaration for Global Environmental Preservation (1991) and the Fukuoka City Declaration for an Environment-Friendly City (1992).
3-3-2 New Developments in Regional EnVironmental Education
A heightened awareness of the environment and increased involvement by individuals are of key importance in solving urban and other pollution problems affecting people's daily lives; in addressing global environmental problems; in satisfying public needs for pleasant living environments surrounded by abundant nature; and in expanding activities to help solve environmental problems beyond their current scope. Toward this end, the Regional Environmental Preservation Fund for Japan's 58 prefectures and government-designated municipalities with a population of more than 500,000 was established and funded by the fiscal 1989 supplementary budget to provide ongoing dissemination of information and education on the environment to all of Japan's regions and local jurisdictions. Since fiscal 1991, the fund has helped support a diverse range of environmental preservation activities at the local level.
A. Dissemination of Information and Education on Environmental Preservation Issues
Twenty organizations are assisting in providing books that address various environmental issues to schools, 11 agencies have designated 123 model schools for environmental education, arid another 27 organizations are sponsoring 36 symposiums to promote environmental education at the local level.
B. Support for Practical Environmental Preservation Activities
Twenty-nine organizations are providing support to citizen groups that are implementing practical programs for environmental improvement. For example, in fiscal 1992 assistance was provided for 61 separate activities by citizens groups in Tokyo to measure acid rain, hold environmental conferences, and undertake other beneficial programs. In Yokohama, funding was supplied for 26 different environmental preservation activities.
C. Basic facilities for Environmental Preservation Activities
Twenty-three organizations are establishing environmental cen ters, information corners, libraries, and other facilities for citizens groups undertaking their own environmental activities. The Miyazaki Prefecture Environmental Information Center, for example, is used by some 17,000 people per year. Another seven organizations have set up data bases listing personnel and relevant groups to better coordinate environmental activities. Toyama Prefecture, for instance, has such a data base registering some 500 recycling and environment beautification groups.
D. Commissioning of Advisers
Ten organizations have commissioned advisers to assist in promoting local environmental preservation activities. Another 15 organizations offer leadership training sessions for representatives of local organizations.
E. Establishment of Basic Policies for Regional Environmental Preservation Activities
Thirty-seven organizations have implemented or are studying long-term policies for promoting regional programs, education, and business planning. For example, the city of Osaka established a basic environmental education policy in 1991 and set up the necessary infrastructure for implementing the policy in 1992.
3-3-3 Promoting International Cooperation at the Local Level
Throughout Japan, special initiatives are being implemented at the local level to gather the knowledge gained by regional governments and public corporations and industries in combating environmental problems and provide this know-how to other nations.
(1) Local Organizations Promoting International Environmental Cooperation
The number of organizations at the regional level that are promoting international cooperation in environmental preservation activities continues to grow.
The first such organization was the nonprofit International Wetlands Environment Commission, which was established in Shiga Prefecture in 1986. This commission was set up to promote proper environmental management of the world's wetlands and water sources, mainly in developing countries. A scientific commission composed of members from 19 different nations provides a data base on the world's wetlands, holds the World Wetland Conference, and undertakes other activities in cooperation with UNEP and relevant international organizations. Furthermore, the commission supports the business community and regional governments in coordinating activities with UNEP's International Environmental Technology Center. The 5th World Wetland Conference sponsored by the commission was held in Italy in May 1993 and representatives of 44 countries participated. The next conference is scheduled to take place in Ibaraki Prefecture, Japan, in 1995.
Another nonprofit organization with connections to UNEP's International Environmental Technology Center is the Global Environmental Research Center, which was established in 1990 by the Osaka Prefecture and Osaka Municipal governments. The center gathers data and technology on comprehensive environmental management in large cities in industrialized countries; transfers these environment-friendly technologies to developing counties via UNEP's International Environmental Technology Center ; works to raise awareness and disseminate information on environmental problems through conferences and symposiums; and promotes international cooperation in environmental preservation and technological development through personnel and trainee exchange programs with organizations in developing countries.
The first meeting of the International Conference on the Environmental Management of Enclosed Coastal Seas (EMECS) to discuss the protection and proper resource exploitation of inland waterways was held in Kobe in 1990 and was attended by the governor of Hyogo Prefecture, the mayor of Kobe, and other community leaders from areas surrounding the Seto Inland Sea. The second conference was held in the U. S. state of Maryland in 1993 and was attended by representatives of 47 countries. The third conference is scheduled for Stockholm, Sweden in 1996. Participants agreed in principle to build an international EMECS center in Kobe, Hyogo Prefecture, and a declaration supporting this plan was adopted at the second conference.
In other areas, the nonprofit International Environmental Technology Transfer Research Center (IETTRC) and the Kita-Kyushu International Technology Cooperation Association's (KITA) Environmental Cooperation Center were founded to address the issue of industrial pollution. Established in Yokkaichi, Mie Prefecture, in 1990, mainly by local industries, IETTRC makes available Japan's environment-friendly production technologies and administrative skills for preventing environmental destruction and renewing resources to other nations by providing training, technological guidance, R&D know-how, survey results, and data related to industrial pollution. The Environmental Cooperation Center was established in 1992 in Kita-Kyushu, Fukuoka Prefecture, by local industries. This center supplies pollution-prevention technologies developed in-house by these industries in the process of overcoming their own challenging environmental problems as well as human resources to developing countries, thus facilitating more effective and greater all-around international support in solving environmental problems and contributing to environmental preservation on an international level.
(2) Cooperation Through International Conferences in Japan
In fiscal 1992, 13 international conferences on the environment were held in Japan. These included the International Wet Plains Preservation Forum (Hokkaido), the Japan Sea-Rim Environmental Cooperation Conference (Niigata), and the Asia Marshland Symposium (Shiga), as well as the opening ceremonies for the UNEP Environmental Technology Center.
(3) Dispatch of Personnel from Regional Governments and Public Corporations and Acceptance of Trainees from Developing Countries
JICA has gradually increased the number of people dispatched from regional governments and public corporations to developing nations to provide technological cooperation and administrative support in environmental preservation activities. Personnel from 16 organizations were sent abroad to provide assistance for 18 projects during fiscal 1993. For example, employees of the Tokyo and Nara prefectural governments were sent to the Thailand Environmental Research and Training Center and personnel from the municipality of Nagoya were dispatched to the Indonesia Environmental Management Center for long-term assignments. To ensure that personnel sent overseas are capable of providing the necessary services to meet the needs of developing nations, cooperation is advocated in raising the language ability of participants and ensuring that they have a thorough understanding of the purpose of their assignments.
Conversely, trainees from developing countries are being enthusiastically welcomed in Japan, with personnel from 21 different organizations enrolled in 24 programs, mainly under the auspices of JICA.
(4) Other Assistance to Developing Countries
Other environmental assistance measures include the provision of clean-fuel-burning vehicles and clean technologies to developing nations (Tokyo Prefecture) support for the Youth Wing Enterprise, an organization that helps young people in Southeast Asia undertaking rainforest protection activities (Fukuoka Prefecture) and assistance to Shanghai for establishing a master plan to curtail noise pollution (Osaka City).
(5) International Environmental Conferences by Local Governments
International cooperation by regional governments and public corporations has expanded beyond the local level to encompass such international forums as the International Council for Local Environmental Initiatives (ICLEI). With assistance from UNEP, ICLEI was founded as a "worldwide conference of local governments working to achieve a sustainable future" and has its headquarters in Toronto, Canada. The nonprofit Earth and Human Environmental Forum was set up in October 1993 at ICLEL's Asia-Pacific offices and Japan bureau. Yamanashi Prefecture, Kita-Kyushu, and seven other regional and local governments in Japan are members. ICLEI is promoting four strategic plans to create local communities capable of sustainable growth. First, the commission is working to improve the ability of member governments to attain sustainable development within their own communities. Second, the commission is using its network of member governments to test new methods for addressing specific problems, such as climatic change and waste-disposal. Third, a new concept in local government administration, Human Ecosystem Management, is being created. Finally, assistance is being provided to link the environmental policies of local governments with those of national governments and international organizations in line with the above strategies. ICLEL maintains a regional office in Frankfurt, Germany, and plans to establish other branches in Africa, the Middle East, and North America by the end of 1996.
Chapter 4. Current State of the Environment
4-1 Current Environmental State of the Atmosphere
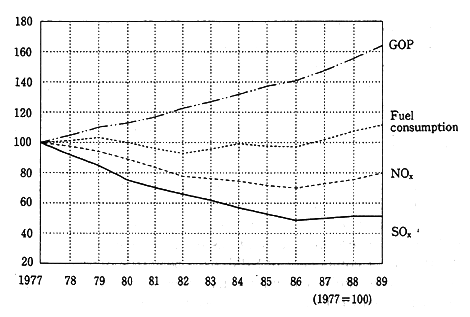
Japan imports natural resources in great volume from other regions to support its economy. At the same time, Japan emitted a great deal of substances which have a negative impact on the global environinent. Moreover, as discussed in Chapter 1, the lifestyles of individuals have become key factors affecting the global environment. It is well known that industrial expansion is a major contributor to air pollution. Nowadays, besides, transportation systems, urban and regional development, and even changing lifestyles are having increasing impact on the environment. Since 1986, the volume of NOx and SOx emissions, which hitherto had been declining, began rising, reflecting the general surge in Japan's economic development (Figure 4-1-1).
Fig. 4-1-1 Trends in the Volume of SOx and NOx Emissions
Source: Environment Agency
The overuse of natural resources and the production of much waste are prime factors upsetting the balance of natural ecosystems. Qualitatively and quantitatively such activities are often related with environmental problems, at times in complex ways, and worsen the global environment. These environmental problems have long-term effects over increasingly wide areas. Their growing environmental impact is not only having bad effects on the environment on a global scale but will affect future generations.
4-1-1 Current Atmospheric Conditions
Reductions in air pollution caused by NOx are negligible in urban areas due to the increase in automobile and diesel-powered vehicle use. Moreover, there continues to be no improvement in atmospheric levels of suspended particulate matter (SPM) or photochemical oxidants. In addition, there are fears of new sources of harmful atmospheric pollutants.
Previously, the most prominent cause of environmental damage was industrial production. Recently, however, automobiles are having a highly significant impact. It is therefore imperative to take an integrated approach to environmental protection that embraces measures regulating automobile use as well as production activities. The Automobile NOx Reduction Law went into effect in December 1993. In addition to the measures undertaken with this law, automobile unit regulations are being strengthened in line with recommendations of the report of the Central Council for Environmental Pollution Control of 1989 and the use of low emission vehicles are being promoted by means of a variety of supplemental provisions. In addition, the Central Environment Council is deliberating the framing of comprehensive policies toward vehicle traffic noise.
In the same vein, studies and reviews of pollutant sources are being carried out to determine optimal comprehensive measures con cerning SPM and photochemical oxidants that will supplement measures hitherto undertaken. Regulations on diesel emission particulates (DEP), the maj or component of SPM, have been strengthened, covering particulates as a whole, and will be strengthened more according to the report of the Central Environment Council of 1989.
In regard to harmful new atmospheric pollutants, levels of trichloroethylene and tetra-chloroethylene have been established as "indicators of atmospheric pollution," and provisional policy guidelines are being established and studies are being undertaken concerning such substances. It is imperative to take systematic, comprehensive measures in regard to a variety of substances, and therefore comprehensive studies to understand their effects on health and determine atmospheric concentrations are under way.
(1) Nitrogen Oxides
Nitrogen oxides ( NOx) such as nitrogen monoxide (NO) and nitrogen dioxide (NO2), generally associated with combustion, are generated by fixed sources such as plant boilers and mobile sources such as automobiles. High concentrations of NO2 can have detrimental effects on the lungs, and NOx contribute to acid rain and photochemical atmospheric pollution.
In regard to NOx, Japan has set environmental quality standards -desirable standards for preserving and maintaining human health -for concentrations of pollutants in the environment and these act as targets for countermeasures against NO2. These standards are based on average daily levels sampled hourly and are set in a zone ranging from 0.04 ppm (parts per million) to 0.06 ppm or lower.
A number of General Environment Air Monitoring Stations have been established to track general air pollution conditions. At 15 of these stations, which have been constantly monitoring concentrations of NO2 since 1970, the annual average level registered in fiscal 1992 was 0.028 ppm. Similarly, at 21 Motor Vehicle Exhaust Monitoring Stations,
which have been continuously monitoring concentrations of nitrogen dioxide since 1971 in the vicinity of roads, the annual average value registered at these stations in fiscal 1992 was 0.041 ppm. These values are about the same as those in fiscal 1991 (Figure 4-1-2).
Fig. 4-1-2 Trends in Average Annual Values for NO2
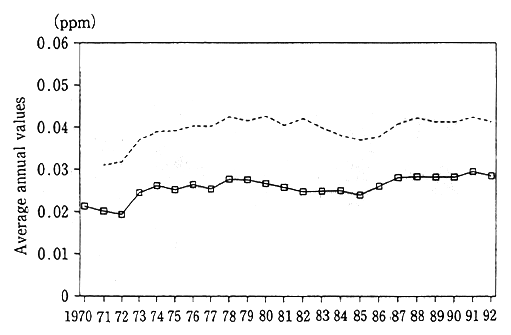
(average at stations maintaining continuous observations)
![]() average at 15 General Environment Air Monitoring Stations
average at 15 General Environment Air Monitoring Stations
- average at 21 Roadside Air Pollution Monitoring Stations
Source: Environment Agency
Fig. 4-1-3 Trends in Compliance with NO2 Environmental Quality Standards
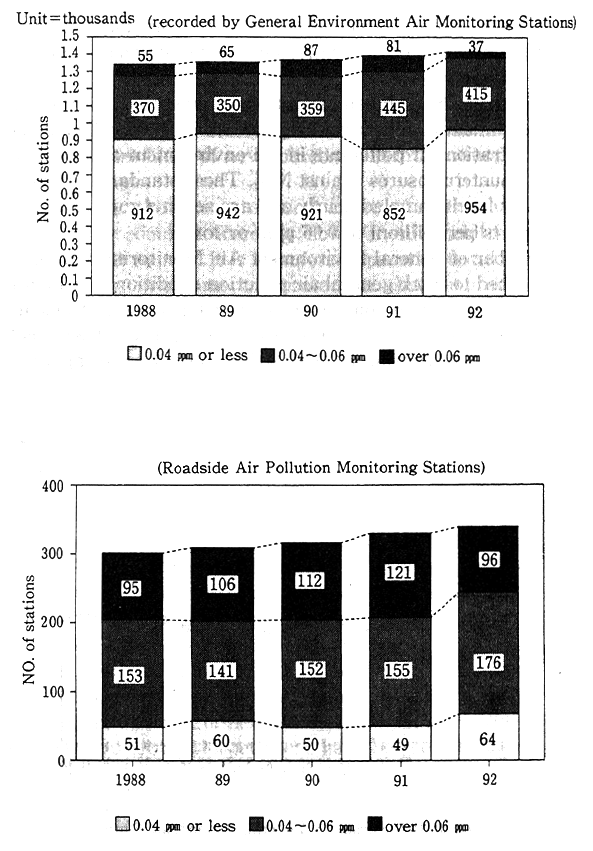
Source: Environment Agency
The deadline for complying with environmental quality standards for NO2 (standard values were revised in 1978) was in principle set for 1985 ; as of 1992, however, the rate of compliance remained at low levels in large cities.
A nationwide examination of the rate of compliance with environmental quality standards shows that in fiscal 1991, the proportion of effective monitoring stations nationwide (stations that carry out monitoring for 6,000 hours or more per year) that exceeded the upper limit of 0.06 ppm was 5.9% (81 stations of 1,378, as opposed to 2.6% (37 stations of 1,406) in fiscal 1992.
At Motor Vehicle Exhaust Monitoring Stations, the corresponding figures were 37.2% (121 stations of 325) for fiscal 1991 compared with 28.6% (96 stations of 336) for fiscal 1992. In both cases, declines were posted (Figure 4-1-3). Similar trends appear elsewhere. Restrictions on the total volume of NO2 emissions at factories and other fixed sites have been established for three regions: Tokyo's 33 wards, Yokohama, and Osaka. A check of the compliance with environmental quality standards in these regions shows that the proportion of General Environmnent Air Monitoring Stations recording excess levels declined from 52. 7% in fiscal 1991 (59 stations of 112) to 29.7% in fiscal 1992 (35 stations of 118). Among Motor Vehicle Exhaust Monitoring Stations, the proportion of stations registering high levels dropped from 93.1% in fiscal 1991 (67 stations of 72) to 73.6% in fiscal 1992 (53 stations of 72).
Rates of compliance with environmental quality standards in regions specially designated under the Law on Automotive NOx Emissions show a similar trend. The proportion of General Environment Air Monitoring Stations recording excess levels declined from 26.6% in fiscal 1991 (81 stations of 305) to 11.5% in fiscal 1992 (36 stations of 313). Among Motor Vehicle Exhaust Monitoring Stations, the proportion fell from 72.0% in fiscal 1991 (08 stations of 150) to 53.9% in fiscal 1992 (82 stations of 152). Similarly, figures for all monitoring stations showed a decline, dropping from 41.5% in fiscal 1991 (189 stations of 455) to 25.4% in fiscal 1992 (118 stations of 465).
Japan led other nations in carrying out a wide variety of initiatives to regulate pollution sources such as factories and automobiles and to restrict the total volume of emissions of factories and workshops permissible in regions where pollution levels are particularly high. Moreover, Japan is putting in place emission standards on factories and other fixed sources of emission, taking into account the category and scale of the facilities that emit nitrogen oxides.
Focusing for the moment on emission controls governing factories, the Japanese government imposes areawide total pollutant load controls with relaxation of emission volumes applied factory by factory in three regions (Tokyo's 23 wards, Yokohama, and Osaka) where the attainment of environmental quality standards is particularly difficult.
Turning to NOx emitted by automobiles, in June 1992 Japan enacted special provisions (the Automobile NOx Law) concerning the reduction of the total volume of NOx emitted by automobiles in specially designated regions. Under these provisions, metropolitan Tokyo and metropolitan Osaka and Hyogo were given special designation as regions in which the attainment of environmental quality standards was recognized as particularly difficult due to high concentrations of vehicular traffic. In these regions, the responsible local government officials are enacting plans to reduce the total volume of emissions, in accordance with a basic plan for the reduction of total emission volume formulated by the national government.
In addition, the government enacts emission standards that apply to specially designated vehicles that are registered for use within the specially designated regions and imposes regulations on the types of vehicles in use in order to promote switching to types of vehicles that emit smaller amounts of NOx.
Moreover, the relevant Minister stipulates the policies for ration-alization of automobile utilization to be followed by the business operators within his jurisdiction and implements guidelines and other directives based on these policies.
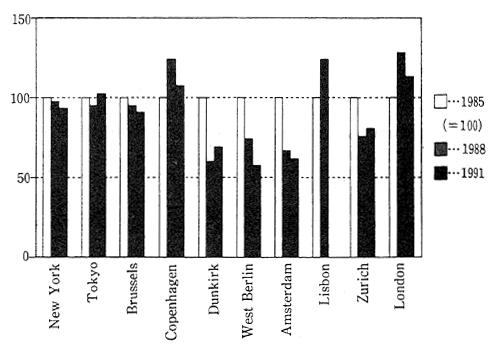
An examination of data on foreign countries shows that major cities of the developed countries-Dunkirk in France, Amsterdam in the Netherlands, and London, England-all posted a modest deterioration in atmospheric pollution from NOx from 1985 into the early years of the 1990s. This indicates the limited effectiveness of policies to counter NOx pollution (Figure 4-1-4).
Fig. 4-1-4 Trends in NO2 Pollution in Various Major Cities in Developed Countries
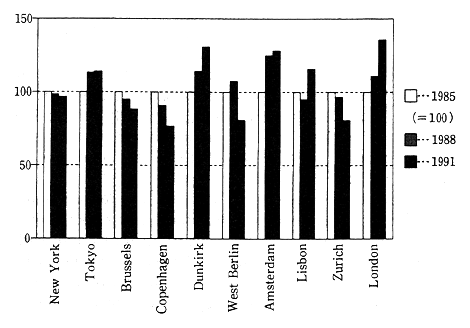
Source: OECD Environmriental Data 1933
(2) Sulfur Dioxide
Sulfur dioxide (SO2) is a byproduct of the combustion of oil and coal that has sulfur content. SO2 has a debilitating effect on the lungs and is the causative agent in such pollution diseases as Yokkaichi Asthma, named after the industrial city where it originated. It is also implicated in acid rain, which damages forests and inland waters.
Japan's environmental quality standards for SO2 are set at an average daily value based on the hourly values of 0.04 ppm or less and the hourly value is set at 0.1 ppm or less. In fiscal 1992, the concentration of SO2 was found to have an average annual value of 0.009 ppm at 15 General Environment Air Monitoring Stations that had continuously monitored concentrations since 1965. The same value of 0.009 ppm was found at 16 Motor Vehicle Exhaust Monitoring Stations that had continuously monitored concentrations since 1973, which indicates substantial improvement. In regard to compliance with environmental quality standards, in fiscal 1991 99.7% of General Environment Air Monitoring Stations attained environmental quality standards (5 stations did not) while in fiscal 1994, 99.6% of the stations attained standards (6 stations did not). The corresponding figures for the Motor Vehicle Exhaust Monitoring Stations were 98.6% in fiscal 1993 (1 station did not) and 98.7% in fiscal 1994 (1 station did not).
Atmospheric pollution due to sulfur dioxide rose sharply at the time of Japan's strong economic growth due to its large-volume consumption of fossil fuels. Japan established its first environmental quality standards for SO2 in February 1969, and the government implemented a variety of policies aimed at realizing these standards. These policies included the regulation of the sulfur content of fuels, emission controls corresponding to the type of soot-generating facility (K value controls), and the implementation and tightening of areawide total pollutant load controls on a factory-by-factory basis in 24 regions nationwide. Responding to policies to reduce SOx, companies undertook a variety of countermeasures, including an increase in imports of low sulfur oil, efforts to lower the sulfur content of fuel by eliminating the sulfur in heavy oil, and the addition of flue gas desulfurization facilities.
As a result, the concentration of atmospheric SOx (as measured at Air Pollution Monitoring Stations) showed noteworthy improvement, declining from a peak value of 0.059 ppm in fiscal 1967 to 0.100 ppm in fiscal 1986 (Figure 4-1-5).
Fig. 4-1-5 Trends in Average Annual Values of SO2
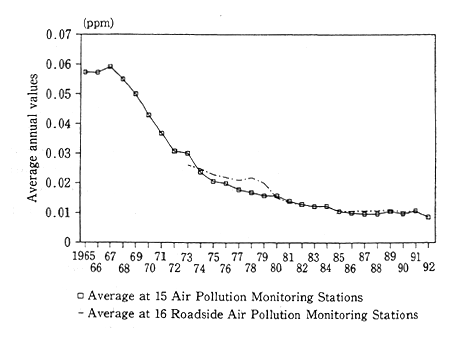
(avarage at stations maintaining continuous observations)
![]() Average at 15 Air Pollution Monitoring Stations
Average at 15 Air Pollution Monitoring Stations
- Average at 16 Roadside Air Pollution Monitoring Stations
Source: Environment Agency
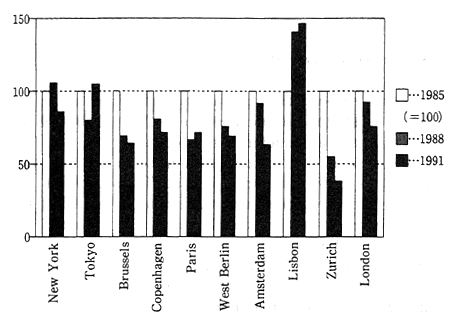
In foreign countries, although vast improvements in the volume of sulfur dioxide emissions appeared from 1985 in many major cities in the developed countries, such as West Berlin and Amsterdam, pollution worsened in certain cities (Figure 4-1-6).
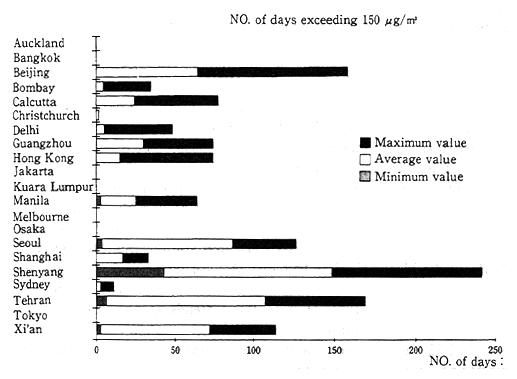
Moreover, according to a report issued in 1993 by the Economic and Social Commission for Asia and the Pacific (ESCAP), which is part of the United Nations, more developing countries than developed countries exceed the air quality guidelines (150fÊg/m3) for concentrations of SO2 established by the World Health Organization (WHO). Cities in China, Iran, and Korea show particularly marked air pollution. According to the Global Environment Monitoring System (GEMS), residents of approximately two out of three cities breathe air that exceeds the control values for ambient SO2 concentrations established by WHO (Figure 4-1-7).
Fig. 4-1-6 Trends in SO2 Pollution in Major Cities in Developed Countries
Source: OECD Environmental Data 1993
Fig. 4-1-7 Air Pollution (SO2) in Major Cities
GEMS, UNEP, and WHO, 1988
Source: ESCAP, State of Urbanization in Asia and the Pacific, 1993
(3) Suspended Particulates
The term "suspended particulate matter" (SPM) refers to particles of matter (suspended particulates, aerosols, etc.) that float in the atmosphere and have a diameter of 10 microns or less.
SPM is so small that it can remain in the air for long periods. It can affect the respiratory system if inhaled. The sources of SPM are classified into two categories : man-made sources, including the soot and dust emitted in connection with the combustion of factories as well as the soot contained in diesel exhaust gas, and natural sources such as wind-blown soil and dust. Primary particles emitted directly into the atmosphere from generating sources-as well as sulfur oxides, nitrogen oxides, and other gases emitted-change in the atmosphere into secondary particles of particulate matter.
Japan's environmental quality standards for SPM, which were established in January 1972, set a daily average value from hourly values of 0.10 mg/m3 or less as well as an hourly value of 0.20 mg/m3 or less. To attain these environmental standards, Japan is implementing emission controls covering soot, dust, and particulates from factories and workshops and sooty exhaust from vehicles.
In fiscal 1992, 39 General Environment Air Monitoring Stations that have been conducting monitoring continuously since 1974 reported concentrations of SPM with an average daily value of 0.038 mg/m3, and 6 Motor Vehicle Exhaust Monitoring Stations that have been conducting monitoring continuously since 1975 reported an average daily value of 0.048 mg/m3 (Figure 4-1-8).
The rate of compliance with SPM environmental standards has been rising. In fiscal 1991, 49.7% of General Environment Air Monitoring Stations (670 stations of 1,348) reported acceptable levels, and in fiscal 1992, the rate increased to 57.6% (597 stations of 1,408). Similarly, 30.1% of the Motor Vehicle Exhaust Monitoring Stations (50 stations of 166) reported acceptable levels, and in fiscal 1992, this figure rose to 33. 5% (61 stations of 182). Despite these trends, however, the rate of compliance remains somewhat low.
SPM includes soot and dust (shredded matter, various other wastes associated with machine processing, and dispersed particulates). Most particulates are relatively large and tend to fall to earth; this settling is referred to as "dust fall." Dust fall levels in Japan remain relatively stable. In fiscal 1992, the average annual reading reported at 16 observation points that have been conducting long-term monitoring was 3.5 tons/km2/month, which was unchanged from the figure reported for fiscal 1991.
Fig. 4-1-8 Trends in Average Annual Concentrations of SPM (Average at statious maintaining continuous obser vations) ]
![Fig. 4-1-8 Trends in Average Annual Concentrations of SPM (Average at statious maintaining continuous obser vations) ]](/content/900456326.gif)
![]() General Environment Air Monitoring Stations
General Environment Air Monitoring Stations
+ Roadside Air Pollution Monitoring Stations
Source: Environment Agency
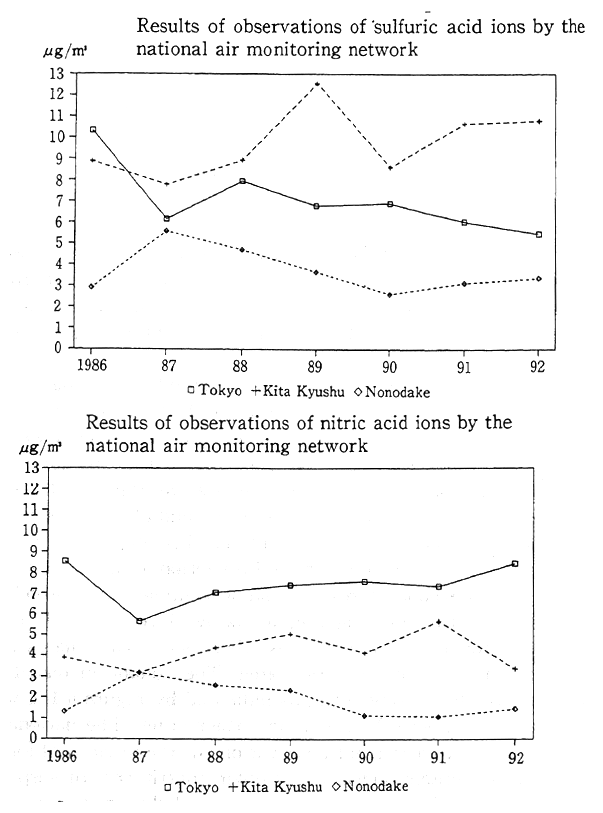
Dust fall associated with the use of studded tires has been a problem since around 1975 in regions such as Hokkaido, Tohoku, and Hokuriku, which are subject to large snowfalls and cold winter weather. In such regions, widespread use of studded tires causes the abrasion of particulates from roads, especially in urban areas. The resulting dust soils people's bodies, the clothes people wear, and clothes hung out to dry. Generally disliked, it is a significant social problem. The Environment Agency, acting on the Law on the Prevention of the Generation of Particulates from Studded Tires, took steps to implement a prohibition of the use of such tires in designated areas by March 1994. More than 98% of cities, townships, and villages where such particulates are a problem have already been so designated. The volume of dust fall is showing noteworthy improvement, as indicated by Figure 4-1-9, which shows trends in Sapporo, Morioka, and other cities. The national air monitoring network carries out observations of the nitric acid ion and sulfuric acid ion content and levels of other constituents of suspended dust. The results of these observations are revealed in the trends shown in Figure 4-1-10.
Fig. 4-1-9 Annual Changes in Dust Fall

Fig. 4-1-10 Changes in Concentrations of Sulfuric Acid Ions and Nitric Acid Ions within Suspended Dust
Source : Environment Agency
SPM is generated by a variety of sources. Diesel exhaust particles (DEP), which account for 20-40% of SPM, are drawing attention for their effects on health. There is concern that DEP may negatively affect health, including acting as possible carcinogens and creating asthma and pollen allergies. Studies of these effects are currently under way.
As countermeasures against DEP, the Environment Agency has long enforced regulations on black smoke from diesel-powered vehicles. In addition to regulations on black smoke, controls on total particulate matters were imposed in 1993. Moreover, the Environment Agency has a long-term target of reducing the emission of particulate matters more than 60% and is contemplating introducing a comprehensive set of measures to attain this target as soon as possible.
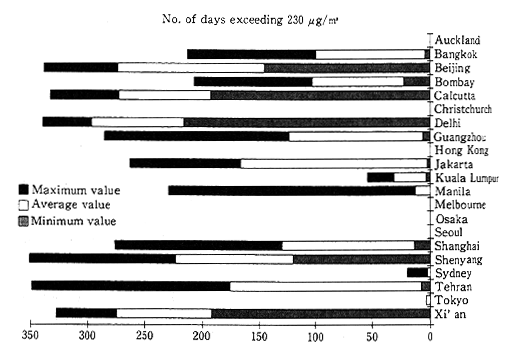
Turning to the situation in foreign countries, most major cities in OECD countries have posted declines in concentrations of SPM since 1985 (Figure 4-1-11). According to a report issued in 1993 by ESCAP, a number of cities in China, India, Indonesia, and Iran markedly exceed the air-quality guideline (230 fÊg/m3) established by WHO regarding the number of days per year that concentrations of SPM exceed this guideline. It is obvious that the pollution situation remains severe in many large cities in the developing countries.
According to a report by ESCAP based on data from GEMS, in 1987, 70% of the world's urban population lived in cities that exceeded WHO's guidelines on SPM levels (Figure 4-1-12).
Fig. 4-1-11 Trends in SPM Pollution in Major Cities in the Developed Countries
Source: OECD Environmental Data 1993
Fig. 4-1-12 Air Pollution (SPM) in Major Cities
Source: ESCAP, State of Urbanization in Asia and the Pacific, 1993
(4) Photochemical Oxidants and Nonmnethane Hydrocarbons
Photochemical oxidants such as ozone are substances with strong powers of oxidation. They are generated as a byproduct of a sunlight -induced photochemical reaction between nitrogen oxides (NOx) and hydrocarbons (HCs) in the atmosphere. Photochemical oxidants are causative factors in photochemical smog, have ill effects on human health, including detrimental effects on membranes and the respiratory system, and have been observed to exert ill effects on agricultural produce and plants in general. Ozone has a more powerful greenhouse effect than carbon dioxide.
Environmental standards established in May 1973 set an hourly value of 0.06 ppm or less for photochemical oxidants. When concentrations of photo chemical oxidants reach an hourly value of 0.12 ppm or more and it is apparent that meteorological conditions favor a continuation of this condition, a photochemical alert will be issued and a variety of measures will be taken to prevent damage to health, such as discouraging outdoor exercise. A review of the average number of days per observation station at which concentrations of photochemical oxidants exceeded alert levels shows a rising trend. The figures for the General Environment Air Monitoring Stations rose from 1.6 days for fiscal 1991 to 1.7 days for fiscal 1992, and the corresponding figures for the Motor Vehicle Exhaust Monitoring Stations increased from 0.2 days for fiscal 1991 to 0.5 days for fiscal 1992 (Figure 4-1-13). The frequency of incidence in the metropolitan Tokyo and Osaka regions indicates that photochemical air pollution remains serious in those areas.
Fig. 4-1-13 Trends in the Average Number of Days per Monitoring Station when Concentrations of Photochemical Oxidants are 0.12 ppm or Higher
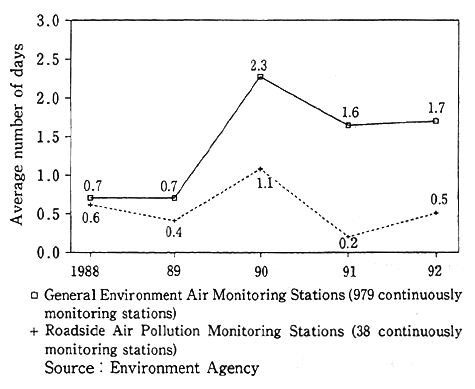
![]() General Environment Air Monitoring Stations (979 continuously monitoring stations)
General Environment Air Monitoring Stations (979 continuously monitoring stations)
+ Roadside Air Pollution Monitoring Stations (38 continuously monitoring stations)
Source: Environment Agency
The causative agent for photochemical oxidants in hydrocarbons is nonmethane hydrocarbons (NMHCs) in the atmosphere; methane itself is not photochemically reactive. Concentrations of NMHCs have remained relatively unchanged in recent years. The simple average value of the annual average measured in continuous monitoring of mornings from 6:00 to 9:00 by six General Environment Air Monitoring Stations declined from 0.53 ppmC for fiscal 1991 to 0.49 ppmC for fiscal 1992, and the same simple average value of the annual average measured in continuous monitoring of mornings from 6:00 to 9:00 by 9 Motor Vehicle Exhaust Monitoring Stations declined from 0.51 ppmC for fiscal 1991 to 0.46 ppmC for fiscal 1992. The term ppmC refers to the converted concentration calculated from the total volume of carbon included in various hydrocarbons.
No environmental quality standards have been established for NMHCs. Guidelines to prevent the generation of photochemical smog have been established with the average value from 6:00 to 9:00 AM set between 0.20 ppmC and 0.31 ppmC. Like NOx, nonmethane hydrocarbons are emitted by automobiles as well as by painting and printing factories and workshops that use solvents containing hydrocarbons. For these reasons, a wide range of countermeasures are being undertaken to ensure compliance with the guidelines, including the application of emission controls for automobiles and administrative guidance to help factories keep emissions down.
(5) Carbon Monoxide
Atmospheric carbon monoxide (CO) is generated by incomplete combustion of fuels. Automobiles are thought to be the major source. When carbon monoxide combines with hemoglobin in the blood it can impede the body's transportation of oxygen. It is also known to lengthen the life of methane in the atmosphere, methane being one of the causes of the greenhouse effect.
Japan's environmental quality standards for CO, which were established in February 1970, set an average daily concentration from hourly figures of 10 ppm or less and the average 8-hour concentration from hourly figures at 20 ppm or less. In addition, emission controls were imposed on automobiles.
Following significant reductions in the concentrations of carbon monoxide from around 1975 through 1985, progress has been flat (Figure 4-1-14). Concentrations of CO, as measured in fiscal 1992 at General Environment Air Monitoring Stations that have been conducting continuous monitoring since 1971, showed an annual average concentration of 0.66 ppm.
Measurements at 14 Motor Vehicle Exhaust Monitoring Stations that have been conducting continuous monitoring since 1971 similarly showed an annual average concentration of 2.0 ppm. The rate of comnpliance with environment quality standards was 100% at all 534 of the General Environment Air Monitoring Stations and Motor Vehicle Exhaust Monitoring Stations.
Fig. 4-1-14 Changes in Average Annual Concentrations of CO
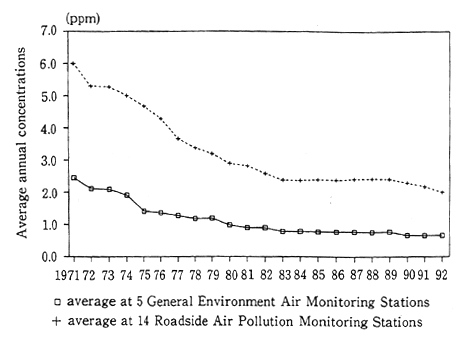
(average at stations maintaining continuous observation)
![]() average at 5 General Environment Air Monitoring Stations
average at 5 General Environment Air Monitoring Stations
+ average at 14 Roadside Air Pollution Monitoring Stations
Source: Environment Agency
(6) Other Atmospheric Pollutants
Airborne substances such as cadmium and chlorine, which are treated as toxic substances under the Air Pollution Control Law, are subject to a variety of countermeasures including emission controls that establish emission standards for sources such as factories and workshops. There is concern that some as yet uncontrolled pollutants in the atmosphere that are not yet at problematic concentrations will in the future become problems. For this reason, it is essential to monitor trends in concentrations of these substances. Toward this end, the Environment Agency has been conducting studies of uncontrolled atmospheric pollutants since fiscal 1985. Studies in fiscal 1990 and 1992 focused on formaldehyde dioxins, and those in fiscal 1991 and 1993 focused on asbestos, mercury, and organic chloride compounds such as tricholorethylene and 1,1,l-trichlorethylene (Table 4-1-1). Studies in fiscal 1992 established that concentrations of certain substances in the general environment posed no particular problems. These substances included formaldehyde, a colorless, flammable, irritating gas with applications in phenol rubbers, antimildew agents, and bactericides; dioxins, such as polychlorinated dibenzo-p-dioxin (PCDD), a toxic byproduct formed during chemical compounding or combustion; and polychlorinated dibenzofuran (PCDF). In addition to maintaining the monitoring program, the Environment Agency will undertake studies on preventing pollution, making particular efforts to learn more about the actual status of various pollutants.
Chemicals are used in a huge range of applications and produced in a wide range of categories. It is thought that the number of industrial chemicals alone amounts to approximately 100,000. A wide variety of studies are being conducted on systematically selected substances to investigate their environmental safety. A study, on chemical substances in the air conducted in fiscal 1992, with the objectives of rapidly detecting possible residues of chemical substances in the general environment and determining levels of concentrations, identified two substances of eight suspects in the air. It is thought, however, that this does not pose any new problem as the frequency of identification was uniformly low.
Studies are proceeding on the environmental residues of a total of nine substances that include chemical substances designated under the Law Concerning the Examination and Regulation of Chemical Substances and two types of specially designated chemical substances. Six of these substances are being subjected to exposure pathway studies on the amount of chemical substances, broken down by transmission medium, that human beings come in contact with in the course of daily life. An evaluation of the results of these studies does not as yet indicate a need for major changes in the pollution situation.
According to studies, concentrations of such harmful air pollutants as organic chloride solvents pose no direct problem ; however, they are being monitored in view of concerns of their effects on health Trichlorethylene, found in washing agents used to clean oils from metals and in solvents, and tetrachloroethylene, a solvent used in dry cleaning and washing agents to clean oils from metals and an ingredient in the production of CFCs, have been detected across broad areas in low concentrations in the atmosphere. Studies on regulatory standards for as yet uncontrolled air pollutants carried out by the Environment Agency identified instances in which relatively high concentrations were found locally in the vicinity of sources. To provide desirable guidelines for preserving human health, in April 1993 the Environment Agency established provisional air environmental guidelines for trichiorethylene and tetracholorethylene. In addition, the Environment Agency has put together a set of provisional guidelines for countermeasures on emissions into the air of these two substances and is requesting local authorities to study the actual situation, measure concentrations, and keep emissions down.
Turning to the situation abroad, the United States' Clean Air Act was revised in November 1990 and regulations were strengthened, with the number of toxic substances covered significantly expanded from 9 to 189.
In addition, international organizations are engaged in chemical risk assessment and working to reduce risks. The Environment Agency, for its part, is keeping a close watch on trends in international approaches to as yet unregulated air pollutants. The Agency is strengthening and expanding its role in such initiatives as the gathering of information on the effects on health of substances that need to be given priority and the monitoring of sources.
4-1-2 Global Atmospheric Environmental Conditions
Air pollution is not merely a regional problem ; air pollution may have effects across borders. These effects include depletion of the ozone layer, global warming, and acid rain.
Following the revision of the Montreal Protocol (Montreal Protocol on Substances that Deplete the Ozone Layer), the Japanese government took steps to reinforce regulations concerning substances that contribute to the depletion of the ozone layer. Such steps included accelerating the schedule for reducing substances covered under existing regulations, and adding new substances to the list of those covered, in accordance with the application and revision of the Law Concerning the Protection of the Ozone Layer through the Control of Specified Substances and Other Measures. Other steps included the development of alternative substances with low environmental loads and high safety levels, the provision of information to encourage small and mediumsized businesses to switch to alternative substances, deliberations on the optimal social systems that would facilitate the recovery, recycling, and the destruction of CFCs, and research and study on technology to destroy CFCs.
The government is taking positive action on the issue of global warming. Japan accepted the Framework Convention on Climate Change and the Convention entered into force on March 21, 1994. In line with the signing and the subsequent entry into force on March 21, 1994, the Convention aims to stabilize the concentration of greenhouse gases in the atmosphere. Under these circumstances, the government recognized it contributed to the objective of the Convention that is to stabilize emissions of greenhouse gases to 1990s' levels by the end of the 1990s, and the government sent information on Japanese government policies, measures taken, and estimates of their effects to the parliaments of signatory nations as well as participating in negotiations to consider ways of facilitating the implementation of the Convention.
In regard to acid rain, the government is undertaking a comprehensive approach through a wide range of studies and initiatives designed to clarify actual conditions and recommend measures to be taken in response. These measures include a reinforcement of monitoring and measuring networks; a clarification of quantitative cause-effect relationships between acid rain and pollutants ; the monitoring of precipitation, soil content, and plants, and the development of models for predicting a wide range of effects. The government also hosts international conferences and is engaged in the construction of a network to monitor acid rain in the East Asia region.
(7) Stratospheric Ozone and CFCs
The depletion of the ozone layer refers to the depletion of a layer of ozone in the lower part of the stratosphere (from about 15 to 30 km in altitude) by man-made substances like CECs. The depletion of the ozone layer increases the amount of harmful ultraviolet rays from the sun (which are absorbed by the ozone layer) that reach the earth's surface, and this radiation may well have negative effects on humans and ecological systems.
CFCs are used as aerosols, refrigerants, cleaning agents, and foaming agents. They are extremely stable compounds that have no odor and are noncombustible and, when released into the troposphere (the portion of the atmosphere up to 15 km above the earth's surface), they remain unchanged until they reach the stratosphere, where they release chlorine atoms liberated by the action of ultraviolet rays. Such atoms act as catalysts in a chain reaction that decomposes the ozone. In addition to CFCs, the fire extinguishing agent halon, carbon tetrachloride; 1,1,1-trichloroethane; hydrochlorofluorocarbons (HCFCs) ; and methyl bromide are also harmful to the ozone layer. Furthermore, CFCs, which are greenhouse effect gases, have greater global warming potential than carbon dioxides.
A phenomenon called the Ozone Hole has appeared over the Antarctic. The ozone there has decreased dramatically each spring since the late 1970s. Measurements show that the ozone hole has been at its largest for five consecutive years, from 1989 through 1993. This growth is illustrated in Figure 4-1-15, which shows the distribution of the average total ozone over the southern hemisphere in September 1993. There are the circular regions that contain the total ozone under 150m atm-cm (m atm-cm refers to the unit of the total ozone included in the vertical column of the atmosphere) centered on the poles, and these regions have more than doubled their area in the previous year. Regions at 150m atm-cm or lower in the distribution chart of monthly average total ozone in September and October have appeared only three times since observation began, and a region at 125m atm-cm or lower has appeared for the first time. As is apparent in Figure 4-1-16, the minimum total ozone and amount of ozone depletion reached peak in 1993. A comparison with 1983 shows that the area of the ozone hole and the amount of ozone depletion have increased 2.3 times, and the minimum total ozone has decreased 57%.
Fig. 4-1-15 Distribution of the Average Total Ozone in the Southern Hemisphere during September-October 1993 and Comparison with the Previous Year's Average
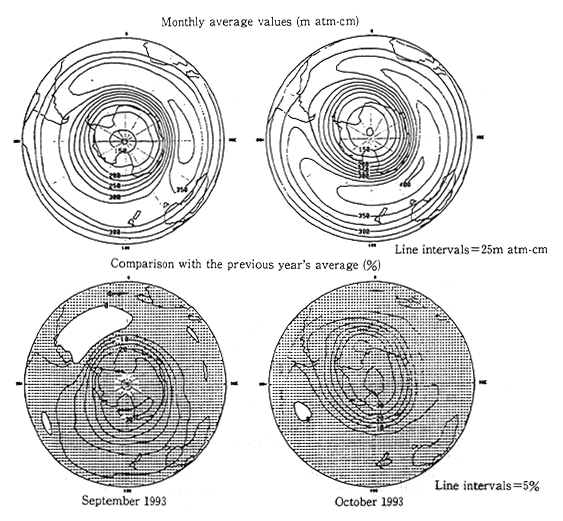
Note : Comparison with the previous year's average refers to the percent deviation from the average aggregate annual value, broken down by month, of the period from 1979 to 1992. Figures were arrived at by comparing data from NASA with values observed by Dobson spectrophotometers.
Source: Japan Meteorological Agency
Fig. 4-1-16 Trends in Three Aspects of the Antarctic Ozone Hole
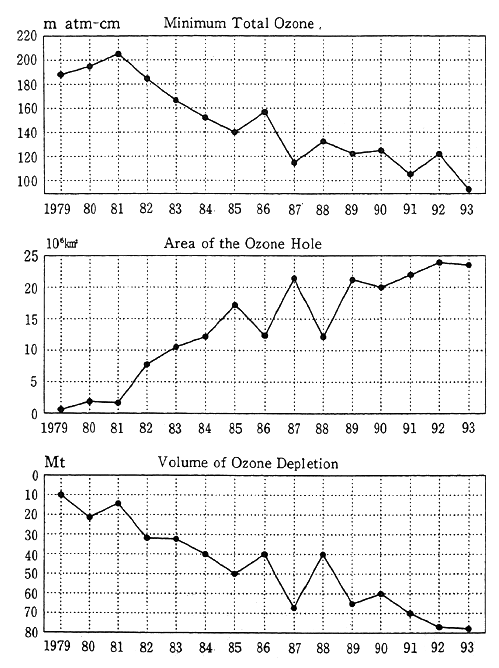
Note : Shown are annual extremes of three factors of the ozone hole from 1979 to 1993-minimum total ozone from the upper layer down, area of the ozone hole, and volume of ozone depletion. The three factors of the ozone hole (below 45 degrees south latitude) are defined as follows: minimum total ozone refers to the minimum value of total ozone ; area of the ozone hole refers to the area with the total ozone under 220 m atm-cm ; volume of ozone depletion refers to the amount of ozone that would have to be added to maintain the total ozone at 300m atm-cm. Figures were made by comparing TOMS data from NASA with values observed by Dobson spectrophotometers.
Source: Japan Meteorological Agency
The main features of the total ozone in 1993 were that it was lower worldwide in every month than previous years' averages and that a decrease in ozone appeared at high latitudes in the northern hemisphere in winter.
Fig. 4-1-17 Distribution of the Total Ozone over Japan (year-round)
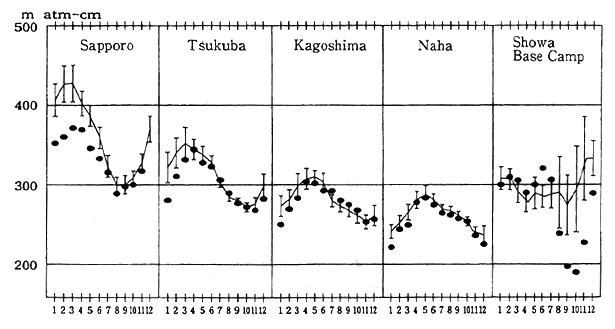
Note : This chart shows the monthly average values of total ozone at four domestic locations (Sapporo, Tsukuba, Kagoshima, and Naha) and at the Showa Base Camp in Antarctica. The black dots show monthly average values in 1993 ; the solid line shows cumulative yearly average values by month (1961 to 1990; Naha: 1974 to 1990) ; and the vertical bar shows standard deviations.
Source: Japan Meteorological Agency
Figure 4-1-17 shows trends in the monthly average total ozone recorded in 1993 at four locations in Japan (Sapporo, Tsukuba, Kagoshima, and Naha, Okinawa) in the upper atmosphere. The lowest values for January ever recorded were at all of the four locations in January 1993, and Sapporo continued to record minimum monthly values through June.
It is known that the amount of harmful ultraviolet radiation (known as UV-B, consisting of radiation in the 280-315 nm band) reaching the earth's surface is increasing due to the depletion of the ozone layer, and it is feared that the increase will have deleterious effects on human health, leading to increases in skin cancer and cataracts, and impede the growth of plants and plankton, which live in shallow waters and are the foundation of marine ecological systems. Japan began monitoring UV-B levels from 1990. Observations to the end of 1993 revealed no large deviations from estimated average annual values. However, analyses of ozone and UV-B levels observed in 1990 at Tsukuba confirmed an increase in the amount of UV-B reaching the earth's surface due to ozone depletion, assuming conditions other than ozone had remained unchanged. This indicated the necessity to continue monitoring (Figure 4-1-18).
Fig. 4-1-18 Levels of Harmful UV-B at Four Domestic Locations
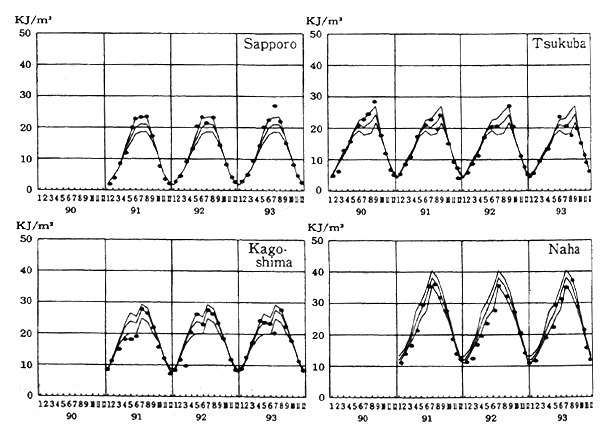
Note : The black dots show observed values from 1990 to 1993. Within the three trendlines, the center one shows the estimated average annual values from 1981 to 1991, and the two outside trendlines show estimated standard dleviations.
Source: Japan Meteorological Agency
Fig. 4-1-19 Changes in Atmospheric Concentrations of CFCs and Other Substances
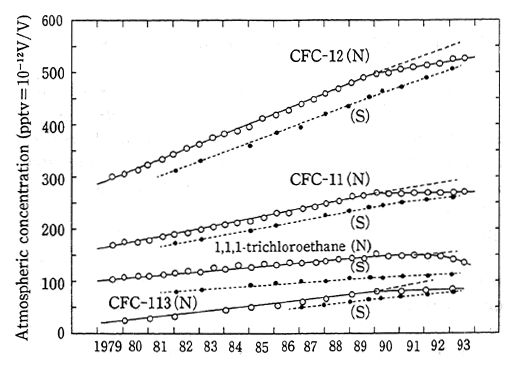
Note : N : Hokkaido ; S : Showa Base Camp in Antarctica
Sources : T. Tominaga, Journal of the Japan Chemical Society and Pure and Applied Chemistry. 64, 529 (1992) ; Y. Makide, L. Chen, and T. Tominaga, 65th Annual Spring Lecture of the Japan Chemical Society (Tokyo, 1993) : Y. Makide, L. Chen, and T. Tominaga, Proceedings of the International Symposium on Global Cycles of Atmospheric Greenhouse Gases, March 7-10, 1994, Sendai, Japan, 52.) (ppt=concentration of 1 part per trillion)
Reference : According to observations carried out by the Japan Meteorological Agency at Ryori, Sanriku town, in Iwate Prefecture, concentrations of CFC-11 and CFC-12 in 1993 were 300 ppt and 540 ppt, respectively.
Japan is also monitoring concentrations of CFCs and other atmospheric pollutants that contribute to the depletion of the ozone layer in mid-latitude areas of the northern hemisphere (in Hokkaido and Ryori, Sanriku town, in Iwate Prefecture) and in south polar regions (at Japan's Showa Base Camp in Antarctica). As shown in Figure 4-1-19, the increase in concentrations of CFC-11 and other substances in midlatitudes of the northern hemisphere has recently come to a virtual standstill. Nonetheless, the concentrations of ozone depleting substances remains high compared to those in the 1970s before the ozone hole was found.
Given this situation, it is necessary to expand and tighten the regulatory framework to promote countermeasures to protect the ozone layer as exemplified by revisions to the Law Concerning the Protection of the Ozone Layer through the Control of Specified Substances and Other Measures (Ozone Layer Protection Law), which was triggered by the Amendment in 1992 of the Montreal Protocol, which added a list of new substances covered by regulations.