Quality of the Environment in Japan 1994
Part I
FOREWORD
This year's White Paper on environmental administration in the first to be based on the Basic Environment Law, which was approved in November of 1993.
The annual White Papers, which have to now been based on the Basic Law on Pollution Policy, span the quarter century since the first report in June of 1969. This year's White Paper, the 26th, is the first to be issued as part of the new activities to implement the ideals and objectives of the Basic Environment Law.
The third chapter of the first White Paper, entitled "Issues for Future Pollution Policy," states :"Japan's economic development, which is viewed as a miracle by the rest of the world, undeniably has a dark side ; that is, it has brought on the deterioration of our environment. Pollution is already a serious problem ; moreover it harbors within itself the reasons for its further spread. It will be exceedingly difficult to resolve pollution problems, but unless these problems are conquered, the order and harmony of nature will be destroyed, and there will be no society of any kind tomorrow. The advancement of genuine human welfare will be impossible. Therefore, we must bear up under these difficulties as we grapple with these problems."
Ono notable circumstance leading to the approval of the Basic Environment Law was the worsening of environmental problems on a global scale. These problems, most particularly global warming and the destruction of the ozone layer, are posing a grave threat to the global environment, the foundation of human existence. The search has now begun for ways of coming to grips internationally with problems that transcend national boundaries. A pressing issue for the industrfalized countries in particular is a serious reappraisal of the long-term viability of their current economic structures while continuing to engaga in mass production, mass consumption, and mass dumping of industrial wastes. Thus, with the passage of a quarter century the nature of environmental issues has been transformed from the domestic level to the global level, and it is therefore necessary to develop a new understanding different from that presented in the first White Paper, mentioned above.
The White Paper for this fiscal year is divided into two parts, a general introduction and discussions on specific issues. In each discussion a presentation on a measure regarding environmental conservation in each field is included. In the preface to the general introduction, there is an overview of trends in socioeconomic activities around the world and in Japas, which are intimately tied to global environmental problems. In addition, consideration is given to topics such as nitrogen and material recycling, critical to an economic society capable of sustainable development. Next, in Chapter 1, it is pointed out that today's lifestyles put a great burden on the environment. It is also introduced concretely that urban dwellers make efforts to take a new view of their environmentally destructive lifestyles and to begin creating new lifestyles that are environmentally friendly. And it is noted that in order for these ideas to be disseminated to people, held in common, and fixed in place as a new life-protecting culture, new measures are needed. Chapter 2, focusing on the relationship between the environment and the economy, introduces voluntary efforts in andindustrial world to solve the problems from the viewpoint of an economic society that is capable of sustainable development. An analysis of the influence of environmental conservation investment on the economy is also included. Furthermore, along with a survey of Eco-Business, which is growing today, an overview of industrial world issues requiring future consideration is presented. Chapter 3 discusses what must be done, principally by the goverment, to create an economic sohiety that is capable of sustainable development. Ustil last year the contents of Chapter 4, the final chapter, were inculded in Chapter 1, but in this White Paper the arrangement has been changed. The Introduction through Chapter 3 provides background on specific problems, while Chapter 4 presents the underlying data for this report.
Today's environmental problems are expanding, spreading over ever larger areas and requiring increasing amounts of time for analyses and the implementation of solutions. People generally believe that responding to these problems is extremely difficult. However, a quarter century ago, when Japan was beset by dangerous pollution problems, Japanese society developed the determination to conquer them. This conquest came true as the Government, local governments, corporation, and the people of Japan came together in a consensus to make this effort. Now, when Japan looks back on this experience, it is expected that thecreation of an economic society capable of sustainable development within its environment-which is today's most pressing issue-will be undertaken with a new determination and with the various segments of society once again renewing thjir efforts an one to tackle these problems.
PREFACE
The Environment from the Perspective of Population and Socioeconomic Trends and the Energy and Materials Cycles
Nature provides humans with food and resources, including such energy resources as firewood and petroleum, which are consumed and discharged back into the natural environment as waste. In nature's ecosystems, there are various types of cycles, an example being the food chain whereby microorganisms decompose the carcasses of dead animals to provide the nutrients that nourish plants that are then eaten by animals as foodL The consumption of resources by humans and subsequent emission of waste have unavoidable effects on the natural environment, but when the volume of consumption and waste were very small, the emitted waste was reconverted into resources by nature's recycling systems, minimizing any detrimental effects on the environment. As the scale of socioeconomic activities expanded following the industrial revolution, however, the volume of resources extracted from the earth far surpassed nature's recycling capabilities, while the amount of waste emitted into the environment exceeded nature's absorption capabilities. As a result, serious regional environmental problems began to emerge. Since that time, humans maintained and expanded their socioeconomic activities, while developing new materials not indigenous to the natural environment and seeking additional supply sources for raw materials and new places and methods for discharging waste. A precipitous rise in the volume of resources extracted and waste emitted that accompanied an expansion in population and socioeconomic activities led to the depletion of resources, the extinction of some species, and the accumulation of pollutants, engendering a greater awareness that the earth's resources are finite. Based on this history, it can be concluded that today's environmental problems are attributable to the fact that the volume of resources extracted as well as the quantity and quality of waste discharged has exceeded nature's recycling capabilities.
In Section 1 of the Preface, the long-term trends in principal socioeconomic activities are outlined. These activities are linked to increases in both Japan's and the world's population and economic growth as well as to such environmental-related issues as energy use, agricultural production, and the usage of forest, water, and other resources. In Section 2, the focus is on recycling, or circulation, and determining the actual extent of the environmental load and related issues by examining the materials and energy cycles at various levels, including the global and domestic levels and among specific countries.
Section 1. Long-Term Trends in Population and Socioeconomic Activities in Japan and Around the World
An examination of long-term population and socioeconomic trends-both of which are deeply related to environmental problems -reveals a large expansion in population and socioeconomic activities since the beginning of the 20th century, with particularly sharp exponential increases following World War II. This rise in population and socioeconomic activities, however, has been accompanied by a deterioration in the resource situation and an abrupt rise in emitted waste. From a regional perspective, although population growth in developed countries has stabilized as these societies mature, the environmental load in these nations is extremely large because of carbon dioxide and other waste emissions. Furthermore, the environmental load in developed countries is slowly on the rise. In developing countries on the other hand, although the per capita environmental load is low, it is nonetheless continuing to expand steadily, reflecting explosive population growth these countries. We would now like to examine long-term trends in each of the following categories.
(1) Population increase
Population is the most basic indicator of the level of society's activities. It is therefore axiomatic that increases in population are strongly related to human-caused changes in the environment.
For many centuries growth in world population was extremely moderate. World population, which stood at 300 million people around the year A.. D. 1, grew to approximately 430 million by 1500. In more recent centuries, however, the rise in world population has increased at a faster rate. Around 1750, at the beginning of the industrial reviolution, world population was 730 million, but 100 years later, in 1850, it had burgeoned to 1.26 billion. In the 20th century, world population has grown in exponentially, swelling from 2.5 billion in 1950 to 5.3 billion in 1990. In recent years in particular, there has been a conspicuous jump in the population of developing countries, where the population has risen from 1.77 billion in 1950 to 4..2 billion in 1990. As a percentage of the world total, the population of. developing countries has risen from 70%, to 79% during this period. Population growth is especially high in poor countries and is resulting in an acceleration of poverty-caused environmental destruction.
Although the world population growth rate is gradually slowing, a continued large increase in the absolute population is expected in the future. Various estimations have been made regarding this future increase, including those by the United Nations. According to the United Nations' moderate-range estimate, which is believed to be the most plausible of all its estimates, world population is expected to grow from around 8.5 billion in 2025 to approximately 10 billion in 2050, before peaking at around 11.6 billion in 2150. It is believed that the overwhelmingly largest portion of this population increase will be in developing countries. To this end, it is forecast that developing countries will account for 97% of the 4.73 billion rise in the world's population expected by 2050. In particular, Africa's population is expected to expand at an explosive rate, growing 3.5 times from 640 million in 1990 to 2.27 billion by 2050. In contrast the populations of developed countries are expected to stabilize, growing from 1.09 billion in 1990 to a peak of around 1.24 billion in 2025, before decreasing slightly to 1.23 billion in 2050. Regard-ing the previously mentioned UN estimates, it is important to note that high-end forecasts foresee world population exceeding 20 billion by the early part of the 22nd century (Figure 1-1).
Fig. 1-1 Trends in and Forecasts of World Populations
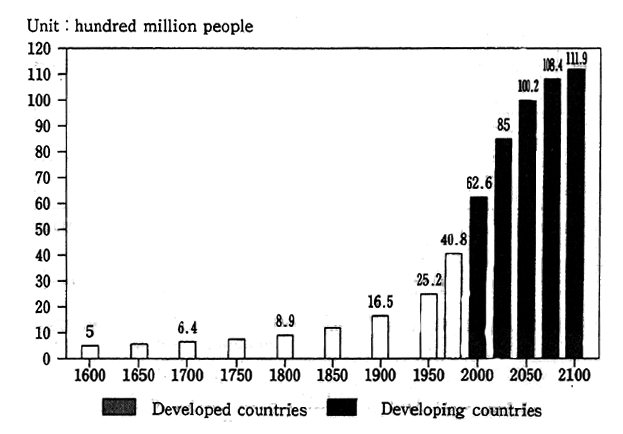
Sources : United Nations, World Population Projections (1992)
Compiled by the Environment Agency using the Ministry of Health and Welfare's World Population Statistics
Note: Figures for after 2001 are forecasts based on moderate-range growth rates.
Paralleling the rise in world population has been a trend toward increased urbanization. In 1950, 83% of the population of developing countries lived in agricultural regions. By the end of the 20th century, however, this percentage is expected to decline to 60%. Also, by the first part of the 21st century, more than half the world's population is expected to be residing in urban areas. In developing countries, the past 20 years have witnessed the emergence of ultra-large cities, or so-called megacities (megalopolis). In 1950, 7 out of the world's 10 largest cities were in developed countries and none of these cities had a population exceeding 15 million. By the end of the 1990s, however, 8 out of the world's 10 largest cities will be in developing countries, and it is likely that each of these cities will have populations greater than 15 million (Figure 1-2).
Fig. 1-2 Trends in and Forecasts of the Proportion of Population Living in the World's Cities
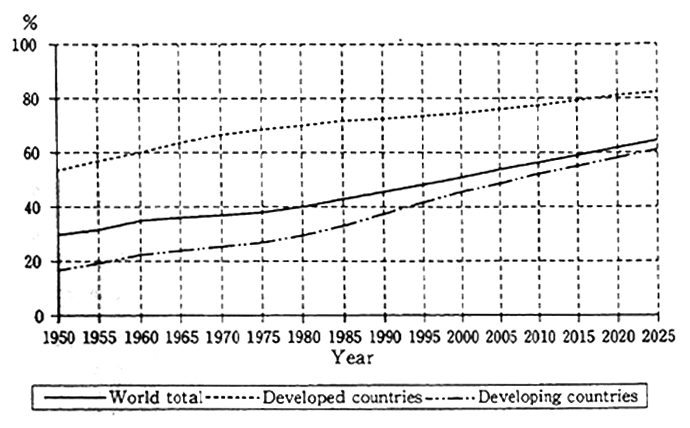
Source: United Nations (1990), World Urbanization Prospects 1990
It is likely that the populations of large cities in developing countries will grow without any corresponding progress being made in. the establishment of public infrastructures, including sewage and wastetreatment facilities, public transportation systems, and roads. Because of the lack of an infrastructure, these cities are confronting a host of serious water- and air-pollution problems.
Japan's population, after growing sharply from the beginning of the Edo Era, stabilized at around 30 million during its period of isolation from the world. The nation's population began surging from the beginning of the Meiji Era, reaching about 72 million in 1940 prior to the beginning of World War II and more than 100 million in 1970. From the mid-1970s, however, this growth rate has decelerated. In 1992, Japan's population was 124.45 million, a mere 0.33% higher than the previous year. According to a moderate-range projection by Japan's Ministry of Health and Welfare, Japan's population will peak at 130 million in 2010, before declining to 96 million in 2090 (Figure 1-3).
Fig. 1-3 Trends in Japan's Population: Top range: Moderate range Lower Range
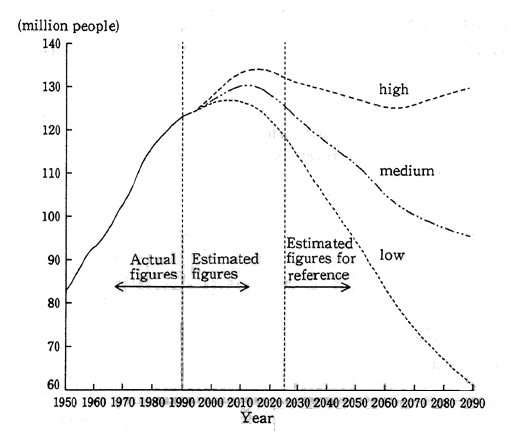
Source: Ministry of Health and Welfare, Future Estimates of Japan 's Population.
Against this background, the graying of Japan's society is continuing. In 1950, people aged 65 and over accounted for about 5% of Japan's population, but by 1990 this figure had risen to 12%. The number of people in this age category is forecast to continue rising before peaking at approximately 28% around 2040. As the percentage of elderly people increases, the size of the working population is forecast to decline from about 87 million in 1993 to 63 million in 2050. Furthermore, it is expected that as Japan's population ages, consumption will rise as a proportion of total household budgets, while investment capabilities decline. Thus during the few remaining years of the 20th century, it is vital to establish a solid infrastructure, including an infrastructure in environmental protection-related areas.
(2) Size of the economy
Along with population, economic growth is a fundamental indicator of people's overall activities. With the exception of the periods corresponding with the two oil crises, global GNP has expanded significantly since World War II, registering a fivefold increase in real growth between 1950 and 1990. During this same 40-year period, per capita GNP rose only 2.3 times, reflecting the large increase in world population (Figure 1-4).
Fig. 1-4 Trends in World GNP
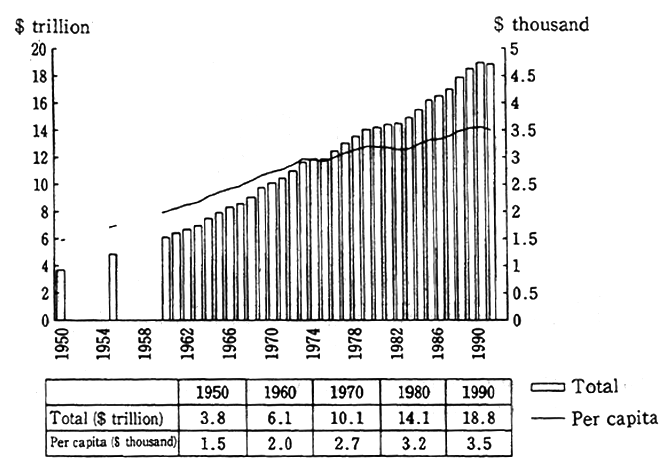
(Calculations based on 1987 prices)
Sources : Lester Brown, Projections of the Future Environment; compiled by the Environment Agency from materials provided by the World Bank and International Monetary Fund.
There are large discrepancies worldwide in per capita income. From 1960 to 1980, per capita GDP on average was around 10 times greater in developed countries than in developing counties, and this gap widened to approximately 12.7 times in 1990. Looking at developing countries by region, per capita GDP in southern and eastern Asia grew 2.7 times from 1960 to 1990, with particularly strong growth in the 1980s. On the other hand, per capita GDP in the African countries south of the Sahara region contracted 0.9 times between 1960 and 1990.
According to forecasts on future per capita GDP made by the Secretariat of the United Nations, per capita GDP will rise 1.29 times in developed countries and 1.22 times in developing countries from 1990 to 2000, and there is not expected to be a significant change in the overall gap between the so-called north and south countries (Figure 1-5).
Fig. 1-5 Trends and Forecasts of Per Capita GDP
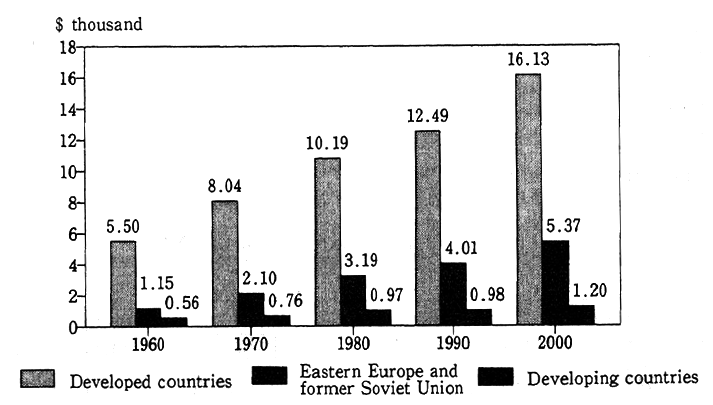
Source : Compiled by the Environment Agency from the United Nations, The World in the Year 2000.
Notes: 1. The figures for 2000 are forecasts based on the basic on the basic scenario.
2. Calculation are based on 1980 dollar prices and exchange rates.
To examine the ultra-long-term outlook for the world economy, we used scenarios from forecasts on global warming published by the Intergovernmental Panel on Climate Change (IPCC) in 1992. According to this report, the developed countries can expect to post stable economic growth, but that developing countries will record high rates of growth against a background of population increases. The economic growth rates for both developed and developing countries are expected to gradually slow as the year 2100 approaches (Table 1-1).
Japan's real GNP increased 9.3 times between 1955 and 1990. Along with this rise in real GNP, the nation's GNP as a percentage of total world GNP also increased, from 6.8% of world GNP in 1972 to 15. 3% in 1992 (Figure 1-6).
Table 1-1 Scenarios for World Economic Growth (IPCC)
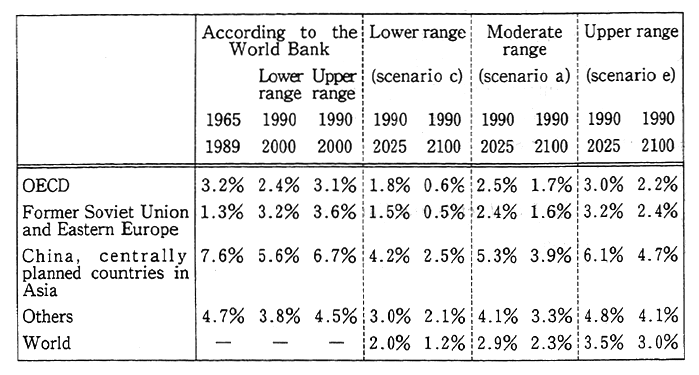
Source :IPPC Annual Report, 1992
Fig. 1-6 Japan's Share of World GNP
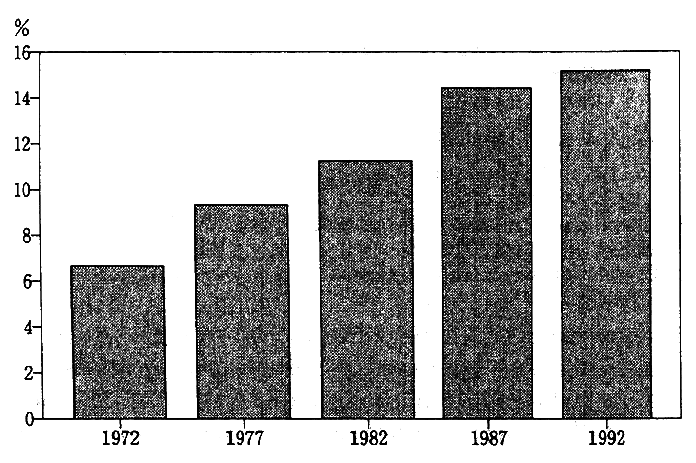
Source : Compiled gy the Environment Agency from the World Bank, The World Bank Atlas.
During Japan's period of rapid economic growth from 1955 to 1970, real GNP expanded at an average annual rate of 10.0%. From 1970 to 1990, a period of stable growth, the increase in Japan's real GNP slowed to an average annual rate of 4.3%. Following the bursting of Japan's economic bubble, real GNP growth fell to 4.6% in 1991 and to 0.7% in 1992.
According to projections published by the Economic Council in 1991, the decline in growth rates of Japan's population occurring with the graying of society will be accompanied by a steady decline in Japan' s economic growth rate, which is expected to gradually decrease until 2010, from an average annual rate of 4..6% in the latter half of the 1980s.
(3) Increase in the volume of energy consumption
Next, we will outline long-term trends in energy consumption and make estimations of future energy use. Energy use is the most basic indicator of socioeconomic activities. However, the emission of such substances as CO2 and NOx that accompanies the use of energy places a load on the environment.
From 1860, when statistics were first compiled, the volume of primary energy supplied, excluding such biomass as firewood, continued to expand at an average annual rate of around 4% up to the beginning of World War I in the first half of the 1910s. From this time until the outbreak of World War II in the early 1940s-a period that corresponded with a worldwide economic slowdown-the volume of energy supplied grew at the relatively low rate of just under 2%. From the end of World War II until the first energy crisis in 1973, the volume of energy supplied increased sharply, rising at a high annual rate that exceeded 5%, due largely to the discovery of large oil fields in the Middle East and a corresponding drop in oil prices. The volume of energy supplied, which amounted to 1,900 million petroleum-equivalent tons in 1950, increased to around 4,700 million petroleum-equivalent tons by 1970, a 2. 5 times increase during this 20-year period. After this, demand for oil slowed, reflecting the implementation of energy conservation measures prompted by skyrocketing oil prices resulting from the first oil crisis in 1973 and the second crisis in 1979. From 1986, however, demand once again picked up as oil prices plummeted (Figure 1-7).
Fig. 1-7 Long-Term Trends in World Primary Energy Supplies
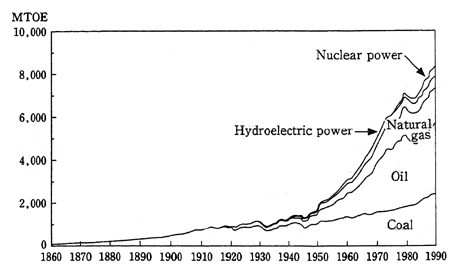
Source : Agency of Natural Resources and Energy, A Brief History of Energy Strategies and Outlook for the Future.
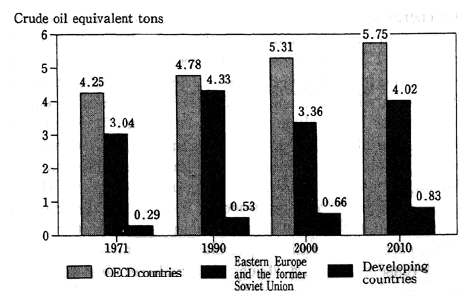
In April 1993, the International Energy Agency (IEA) published its estimations on future trends in oil demand. In the most natural case, which assumes the continuance of current trends with no implementation of any new strategies, demand for petroleum is expected to increase approximately 1.48 times, from 7,768 million petroleum-converted tons in 1990 to 11.476 million petroleum-converted tons in 2010. Growth in demand will be particularly high in developing countries, and therefore demand for primary energy in developing countries as a proportion of total worldwide demand is expected to rise from 26% to 39%. Among developing countries, growth in demand for energy from south and east Asian nations is forecast to be especially high. Regarding per capita consumption of primary energy, there is a large divergence between consumption in north and south countries. In 1990, per capita energy consumption in developed countries, at 4.78 petroleum-converted tons, was 9 times higher than the 0.53 petroleum-converted tons per capita in developing countries. Although this ratio is expected to shrink by 2010 because of anticipated strong growth in per capital energy use in developing countries, it will still be 6.9 times (Figure 1.8).
Fig. 1-8 Projections and Trends in Per Capita Energy Consumpition
Source : Compiled by the Environment Agency from OECD, World Energy Outlook.
Note: Estimates based on the continuance of present trends without the implementation of new strategies.
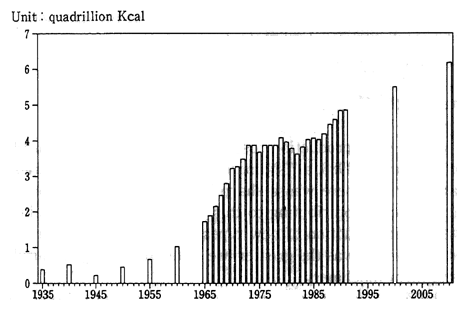
Following World War II, Japan recorded a high rate of growth in primary energy supplies, which rose 6.01 times from 1955 to 1973. From 1973 to 1986, a period that spans the two oil crises, although Japan's GNP increased 1.6 times, the volume of its primary energy supplies grew at almost a parallel rate of 1.04 times. From 1986, however, against a background of falling oil prices and the economic expansion during the period of the so-called bubble economy, energy supplied once again began growing at a high rate-albeit at a rate somewhat lower than that in the period of Japan's rapid economic expansion. Looking toward the future, the Alternative Energy Target (announced in October 1991) aims to increase supply volume at a rate of 1.29 times, from 499 million kl (petroleum-converted) in 1989 to 657 million kl (petroleumconverted) by 2010 (Figure 1-9).
Fig. 1-9 Trends and Targets for Japan's Supplies of Primary Energy
Source: Compiled by the Environment Agency from Japan 's 100 Years, A Profile of Japan, and Outlook for Energy Supply and Demand.
We have briefly outlined past trends and provided estimates on future energy use. In making use of various energy sources, it is also important to introduce energy sources that produce no or low levels of CO2. To ensure stable energy supplies, efforts are progressing at the national level to further develop nuclear energy, natural gas, hydroelectric power, and geothermal energy sources, and to introduce combined -cycle and solar power generation.
(4) Expansion in the production and consumption of agricultural, forest, and marine products
By supplying food and timber products, the agriculture, forest, and marine products industries provide the most basic support for human existence. In regions involved in agriculture, forest, and marine product related activities, the environmentally-conscious pursuit of these activities is helping maintain the environmental-protection capabilities of agricultural regions and forests. On the other hand, as production activities are carried out, a load is placed on the environment because of changes in the intended use of resources. Examples of this include the conversion of forests to agricultural land, primarily in developing countries, the fouling of water from the use of fertilizers in Europe and North America, and the emission of methane gas (CH4), a type of greenhouse gas, by livestock.
A. The production of staple foods
World grain production rose from 1,006 million tons in 1965 to 1,743 million tons in 1988, a 73% increase. In developing countries during this same period, there was a sharp 106% rise in grain production. A significant factor contributing to this worldwide jump in grain production was the introduction of new types of seeds. Also supporting a rise in food production was the greater use of fertilizers, agricultural chemicals, and farm machinery.
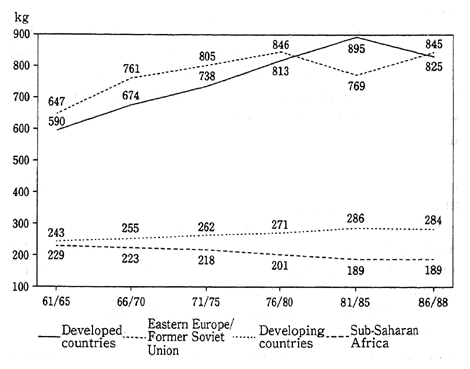
There is a wide variation in per capita staple food production by region. Looking at a three-year average from 1986 to 1988, per capita staple food production exceeded 800 kgs in developed nations, the East European nations, and the former Soviet Union. In contrast, per capitastaple food production in the developing countries was a mere 284 kgs (Figure 1-10).
Fig. 1-10 Trends in Per Capita Harvests of Staple Foods (grains, soybeans, and root vegetables)
Source : Compiled by the Environment Agency from the United Nations, The World in the Year 2000.
On a consecutive-year basis (during this 1986-1988 period), per capita staple food production rose 1.4 times in developed countries and 1.43 times in the Eastern European countries and the former Soviet Union. In developing countries, however, the increase in per capita staple food production was a mere 1.17 times. In areas south of the Sahara region in Africa, per capita staple food production declined.
Many nations worldwide are gradually becoming dependent on trade for grain supplies, as evidenced by the steady increases in exports of grains from developed countries to developing countries.
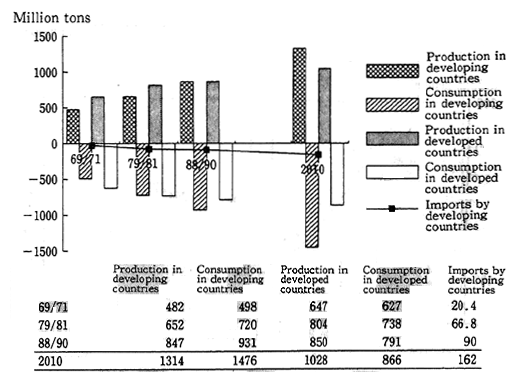
FAO has made projections on future grain production. According to these FAO projections, grain production in developing countries is expected to rise 55%; however, increases in demand due to population growth will exceed this figure, and therefore net imports by developing countries will likely expand. It is also forecast that developed countries, including eastern European countries and the former Soviet Union, will maintain surplus export capabilities that slightly exceed the net import volume of developing countries (Figure 1-11). Whether or not countries with low amounts of income can afford to secure grain imports, however, will pose a significant problem.
Fig. 1-11 Trends in and Forecasts of Production, Consumption, and Import Volumes of Grain
Source : Compiled by the Environment Agency from FAO, Agniculture : Toward the Year 2010.
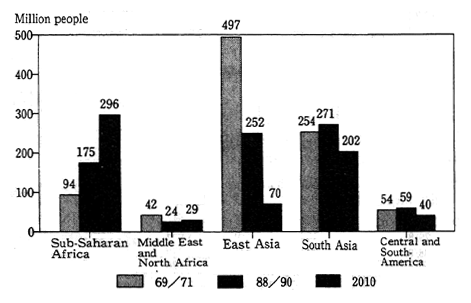
The number of people suffering from malnutrition worldwide is expected to decline from 780 million--the three-year annual average annual between 1988 and 1990--to 640 million in 2010. Nevertheless, the number of malnourished people in African countries south of the Sahara region is expected to rise sharply (Figure 1-12).
Fig. 1-12 Trends in and Forecasts of the World's Undernourished Population
Source: Compiled by the Environment Agency from FAO, Agriculture : Toward the Year 2010.
On the other hand, accompanying the expansion in agricultural production has been a sharp rise in the volume of materials introduced for use in agriculture. The use of fertilizers, a typical material used in agriculture, has contributed significantly to the jump in agricultural production. On the downside, the use of fertilizers has had such adverse effects as the pollution of water, including a rise in density levels of nitrogen in groundwater--a problem in Europe and the United States --as well as the release of NO2, a greenhouse gas, into the atmosphere.
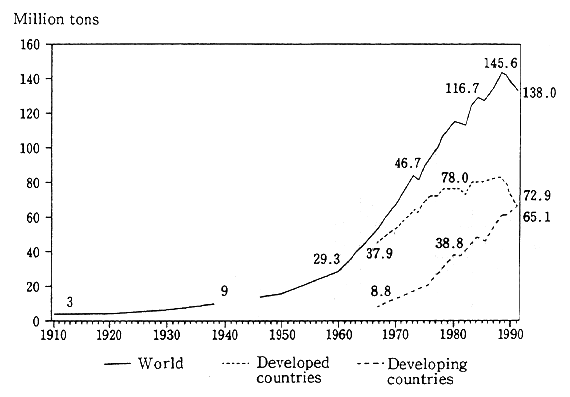
Fertilizer consumption has risen steadily since the beginning of this century, from about 3 million tons around 1910 to about 9 million tons in 1938 prior to World War II. After World War II, fertilizer consumption expanded geometrically, rising from 21.30 million tons in 1955 to approximately 46.70 million tons in 1970 and to around 116.70 million tons in 1980.
By region, developing countries, which lag developed countries by more than 50 years in the use of fertilizers, began expanding their use of fertilizers from 1960, and this trend has continued. In developed countries on the other hand, the rate of increase in the use of fertilizers began to slow from the middle of the 1970s. From the latter half of the 1980s fertilizer consumption in developed countries began a downward trend, reflecting such factors as grain production adjustments. As a result, overall world fertilizer consumption began declining from around 1988 (Figure 1-13).
Fig. 1-13 Trends in Worldwide Use of Fertilizers
Sources : Compiled by the Environment Agency from FAO, Fertilizer 1961, Annual Fertilizer Review (1972), and Yearbook Ferti-lizer 1992.
FAO has made forecasts of future fertilizer consumption in developing countries, with the exception of China. According to these forecasts, the use of fertilizers is expected to grow 2.2 times from the 1988-1990 three-year annual average to 2010.
B. Forest resources
The world's forested areas are decreasing. Over the 15-year period from 1974 to 1989, although there was almost no change in the area covered by forest land in developed countries, forested areas in developing countries declined 6.8%. According to the FAO's Forestry Resources Evaluation, there was an especially large decline in tropical forests, which shrank at an average annual rate of 154,000 square kilometers from 1981 to 1990.
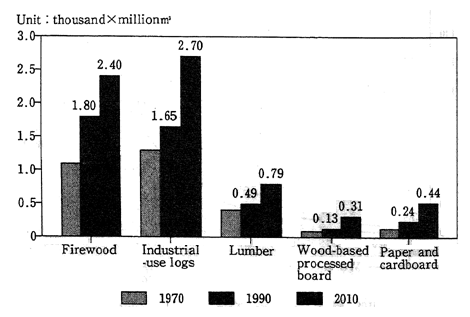
Fig. 1-14 Trends in and Forecasts of World Timber Product
Sources Compiled by the Environment Agency from FAO, Fertilizer 1961, Annual Fertilizer Review (1972), and Yearbook Ferti lizer 1992.
Consumption of forest products has been rising. Looking at principal trends in consumption of forest products, the consumption of firewood rose from 1.1 billion cubic meters annually in 1970, to 1.8 billion cubic meters in 1990, a 1.74 times increase. During this same period, the consumption of industrial-use logs rose 1.29 times, from 1.28 billion cubic feet, to 1.65 billion cubic feet.
FAO has made projections about future trends in forest product consumption. According to these projections, the consumption of forest products is expected to continue rising sharply until 2010, with a particularly high rate of growth forecast in developing countries (Figure 1-14).
C. Marine products
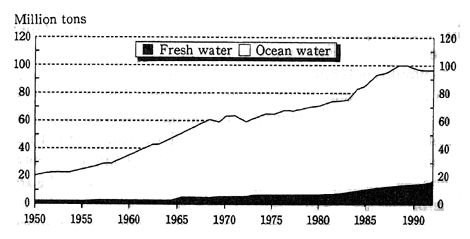
Total worldwide production volume of freshwater and ocean marine products, which was over 20 million tons in 1950, reached 100 million tons in 1989, with ocean marine products accounting for 86,400 tons. Because of a decline in catches of ocean marine life, worldwide production dipped to 97 million tons in 1990 (Figure 1-15).
Fig. 1-15 The Total Worldwide Volume of Ocean and Fresh water Catches (1950-1952)
Source : FAO, Agriculture: Toward the Year 2010.
The UN's FAO has made projections on the future harvests of marine products. According to these projections, if fishing activities are carried out in their present form, total maximum potential annual catches will not likely exceed 100 million tons by a large margin, and will probably be less than this amount. There is thus little probability of any significant increases in total catches of ocean marine life. In 2010, combined potential catches for ocean and freshwater marine life are expected to range from between 90 million tons to 110 million tons. Average annual production of farmed fish in the three-year period from 1989 to 1991 amounted to 12 million tons. When considering the growth rate in recent years, however, this figure will probably rise to between 15 million tons and 20 million tons by 2010. In developing countries, demand for marine products is expected to climb sharply in tandem with increases in population. On the other hand, as can be seen by the recent slump in production by the fishing industry, stable supplies cannot always be guaranteed as production is subject to fluctuations in the availability of resources. It is therefore believed that there could be a tightening of supply and demand depending on future trends in production in the fishing industry. Therefore, to carry out sustainable fishing activities, the continued promotion of resource control and environmental protection in coastal areas is of paramount importance.
Section 2. The Current State of Issues Related to the Environmental Load from the Perspective of the Materials and Energy Cycles
1. The Development of Economic Activities and the Materials and Energy Cycle
In carrying out its economic activities, Japan consumes large volumes of natural resources, including mineral and biological resources. Once these resources are used or consumed, their waste products are discharged back into the natural environment in such forms as wastewater, exhaust gas, and refuse. To gain a better understanding of the use of these materials, let us examine the materials balance (the inflow and outflow of materials), which is a comprehensive calculation of the flow of materials within the structure of Japan's economic activities. In fiscal 1992, the total volume of natural resources consumed in Japan and overseas amounted to 2 billion tons. Including imports of 60 million tons of finished products, a total of 2.33 billion tons of materials were newly introduced by Japan to carry out its economic activities. As a result, about 790 million tons of waste materials were discharged, approximately 90 million tons were exported as finished products, and the other 1.24 billion tons accumulated in the form of buildings and consumer durables. Approximately 200 million tons were reintroduced as recycled resources (Figure 2-1).
Fig. 2-1 Japan's Materials Balance (Inflow and Outflow of Materials)
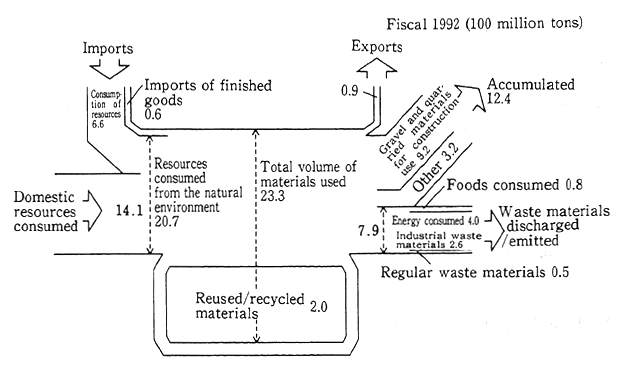
Note: Along with revisions of various statistics, the figures from the materials balance listed in the Environment Annual Report for Fiscal 1994 have also been revised.
Source: Calculations made by the Environment Agency using various statistics.
In fiscal 1991, the volume of materials consumed was 1.4 times higher than that recorded 20 years previously, and the volume of waste materials discharged grew 1.8 times over t he same 20-year period.
Along with Japan's economic activities, the volume of resources consumed and waste materials discharged/emitted has continued to rise, leading to an ongoing increase in the environmental load. Against this background, to minimize the environmental load resulting from Japan's economic activities, the use of resources and the discharge/ emission of waste materials must be in balance with nature's ecosystems and the volume of resources consumed and waste materials discharged must be reduced.
To achieve these objectives, last year's Environment Annual Report stressed the need for reducing the use of materials with low utility and lessening energy waste; promoting the sustainable use of bioresources and the use of natural (environmentally friendly) types of energy; and focusing on nonpolluting means of discharging waste material into the environment and on easily dissolvable forms of waste.
In this annual report, we will examine specific examples of the materials cycle while exploring the influence that the various activities of society have on the materials cycle and on the environment. The materials and energy cycles are inherently complex and subtle, and gaining a full understanding of these circulation mechanisms is extremely difficult. Therefore, we will examine the circulation process from the perspective of 1) nitrogen, which, in several forms, is involved in various environment problems, beginning with urban and lifestyle-related pollution; 2) energy, primarily fossil fuels, which is indispensable for people' s everyday lives; and 3) forest resources, which are a renewable resource, with special focus on tropical forest resources, the preservation of which has been threatened in recent years. In examining these areas, we will look at circulation, movements, and related topics and offer suggestions as to how to solve these environment problems.
2. The Nitrogen Cycle
First, we will outline the nitrogen cycle and then examine the effects of the present state of the nitrogen cycle on our environment. Nitrogen is an essential component of the Earth's atmosphere, making up 78% of the Earth's atmosphere. There are approximately 3,800 trillion tons of nitrogen in the atmosphere and about 14,000 trillion tons of nitrogen, fixed in the earth's crust. In addition, there is about 4,000 trillion tons of biologically combined nitrogen, which includes animal carcass and dead vegetation, as well as approximately 20 trillion tons of nitrogen in the oceans (Figure 2-2).
Fig. 2-2 The volume and Flows of the Earth's Nitrogen
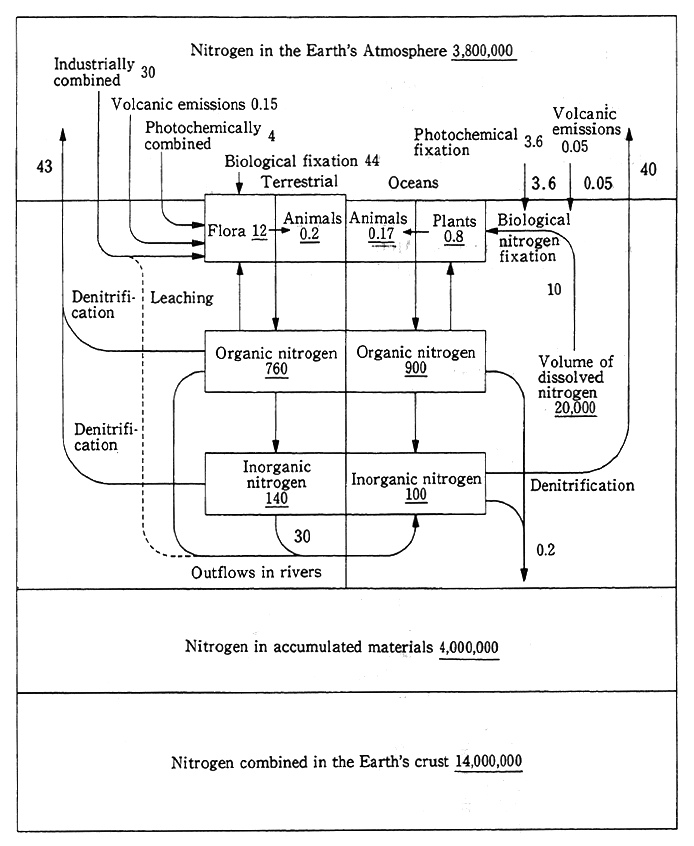
Units : million ton N/year except figures underlined which are 1 billon t N/ year.
Source : Delwiche, Scientific American, 1970.
As a structural element in such basic organic substances as materials as protein, nitrogen supports all life on the Earth. The system by which nitrogen circulates has evolved over the life of the planet and its existence has made possible the development of such biological entities as humans. Most biological entities are unable to use nitrogen gas directly from the atmosphere by themselves. For example, almost all flora can use nitrogen only after it becomes a chemical compound such as ammonia salt or nitrate. In modern times, human beings have cr-eated chemical fertilizers designed to increase food production and have become able to industrially produce nitrogen compounds from nitrogen in the air. Nitrogen that is consumed by biological entities is transformed, into organic nitrogen, or biologically fixed, and then excreted; at death, biological entities decompose and the organic nitrogen they contain is broken down by microorganisms into inorganic nitrogen. There have been various preliminarily calculations on the nitrogen cycle. According to calculations made by Delwiche, the amount of biologically fixed nitrogen from biological entities is about 54 million tons (44 million N tons per year from terrestrial biological sources and 10 million N tons per year from biological sources in oceans) and 30 million tons per year is produced industrially by humans.
First, let us examine how the nitrogen cycle is related to mankind's principal and peripheral socioeconomic activities. The use of nitrogen by humans can be classified as it relates to three broad categories : fossil fuels; industrial fixation, primarily fertilizers ; and clothing, food, and housing, particularly food. The proportional volume of nitrogen used in these three categories is calculated at 4 :2: 1 (Figure 2-3).
Fig. 2-3 The Nitrogen Metabolism-The Relationship Between Human Society and the Environment
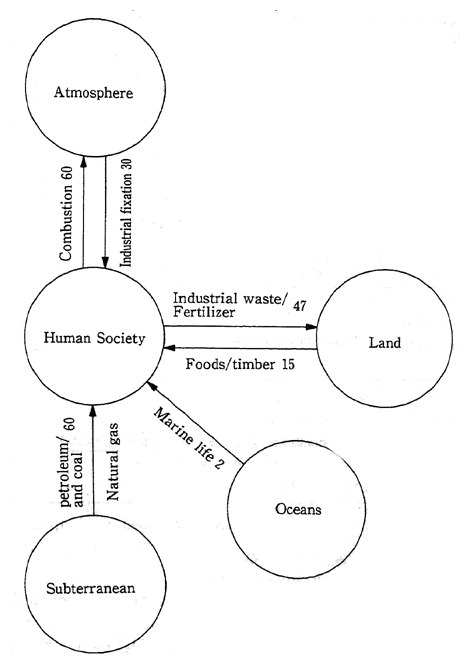
(Million tons N/year, 1969) Compiled by Takeuchi and Hasegawa.
Fig. 2-4 The Flow of Nitrogen through the World Food Trade
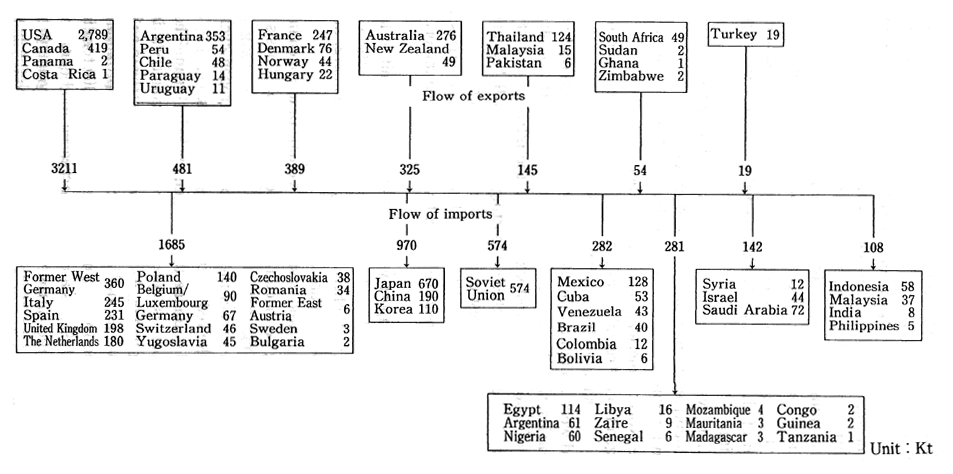
Source: 1979-1981, FAO, Food Supply and Demand Chart (MIWA 1990).
On the other hand, it is thought that a total of 107 million tons of nitrogen is discharged into the environment each year, including about 60 million tons through the combustion of fossil fuels and approximately 47 million tons from fertilizers and waste materials.
Nitrogen is a vital structural element of ecosystems and forms an important component of fertility, including flora production, and playing a crucial causal role in eutrophication in lakes and marshes. Therefore, the nitrogen balance on the Earth is an important indicator of the condition of the basic foundations needed to support the existence of human life.
First, we will outline nitrogen is redistributed through trade among countries, using trade in food from 1979 to 1981 as an example. An examination of trade flows that large volumes of nitrogen move from the North American continent to other areas worldwide. Outflows of nitrogen from Argentina, France, and Australia were approximately 10% of that shipped from North America, while the outflows from Thailand were about half this latter amount. It is necessary to note that for countries with large amounts of nitrogen exports resulting from exports of grains and livestock meat, if the nitrogen exported is not replenished, the land in these exporting nations will become barren. Japan is the world's largest importer of nitrogen, with imports surpassing those of the former Soviet Union. The European countries, Mexico, and Egypt also have a relatively high level of nitrogen imports (Figure 2-4).
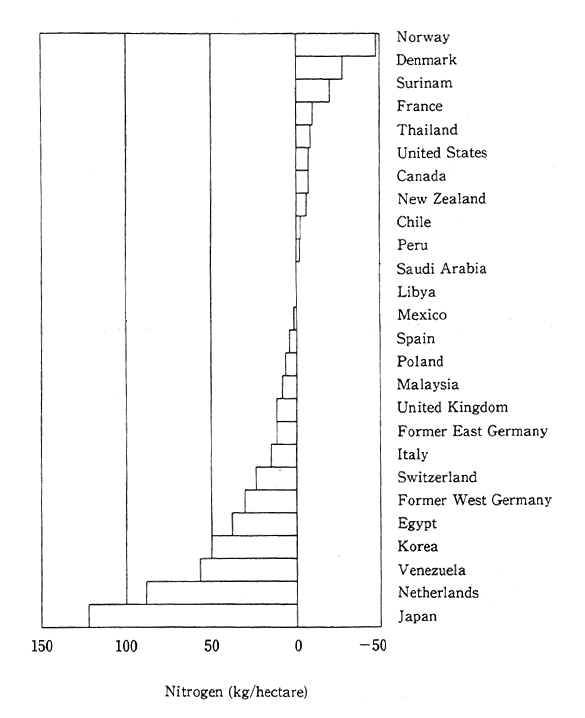
Looking at the import volume of nitrogen per unit of land from the perspective of the load being placed on the land, the volume of imports by Japan, the Netherlands, Belgium, Luxembourg, and Korea are showing increases (Figure 2-5).
Fig. 2-5 Imports of Nitrogen per Unit of Agricultural Land
From MIWA 1990
On a per unit of land basis, import volume of nitrogen in Japan is equivalent to 130/kg per hectare, a high level on a global basis. Norway and Denmark have high export levels of nitrogen.
As can be seen from these examples, the nitrogen cycle among countries is highly skewed toward certain countries.
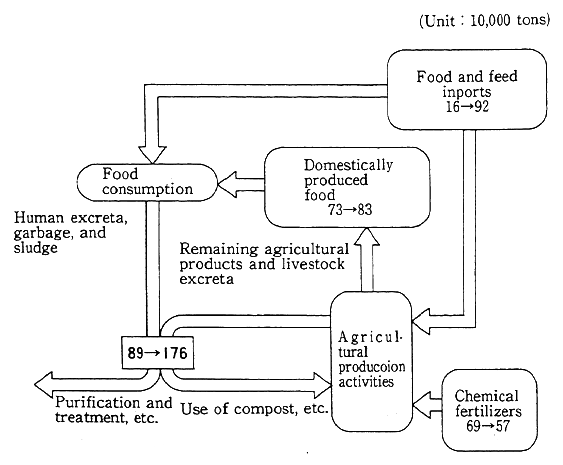
Next, we will examine the nitrogen cycle in Japan. The flow of nitrogen within Japan is deeply related to the country's industrial activities and eating habits. A look at the flow of nitrogen as it relates to dietary considerations in Figure 2-6 reveals an approximately twofold increase in the movement of nitrogens, from 890,000 tons in 1960 to 1.76 million tons in 1993, as a result of increased food consumption.
To examine the nitrogen cycle on a single-country basis, we would like to focus on research carried out in the Netherlands as an example of being at the forefront in research on the materials balance, an important structural element in environmental resource accounting (Figure 2-7).
Nitrogen flows into the country through the import of industrially fixed nitrogen fertilizers and foods and feeds as well as through rivers. On the other hand, nitrogen flows out of the country through the export of foods and through emissions into rivers and oceans. It is calculated that in 1990, there was an inflow of 4,676 million kg of nitrogen into the Netherlands, including 3,252 million kg of imported industrial fixed items, 424 million kg of imported feed, and 362 million kg from rivers. The outflow of nitrogen from the Netherlands is calculated at 3,931 million kg, including 2,556 million kg in exports of organic and inorganic nitrogen chemical compounds, 402 million kg in exports of foods, and 363 million kg in treated nitrogen, including nitrogen at sewage treatment plants. Therefore it is calculated that 745 million kg of nitrogen remained in the Netherlands. The preceding flow analysis, which uses the environment resource method to ascertain the relationship between human activities and the environment, is also believed to be extremely effective, and therefore it is hoped that it can be implemented in Japan in the future.
Fig. 2-6 The Nitrogen Cycle in the Food Supply System (Changes in the volume of nitrogen from 1960 to 1992)
Source: Agriculture White Paper, 1993.
Note:1. The values in the chart (1960-1992) show changes in the volume of nitrogen.
2. The figures for the volume of nitrogen passed (89-176) are preliminarily calculated as the total nitrogen from domestically produced food and imported food and feed.
Fig. 2-7 A Flow Chart of Nitrogen Circulation in the Netherlands in 1990 Unit : 1,000tN
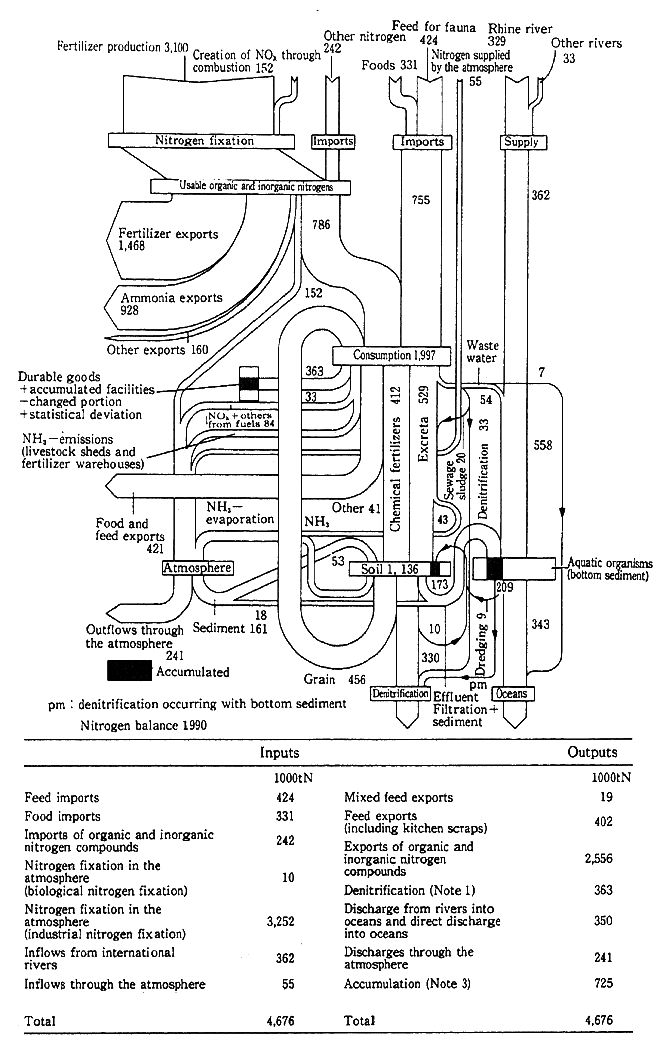
Note : 1. Rough estimates, only for agricultural land and public waste treatment facilities ; no data for estimation of denitrification volume in bottom sediment
2. Source: RIZA
3. Including nitrogen in finished products and incorporating statistical deviation.
Source: CBS
(2) Environmental problems arising from a skewing of the nitrogen cycle
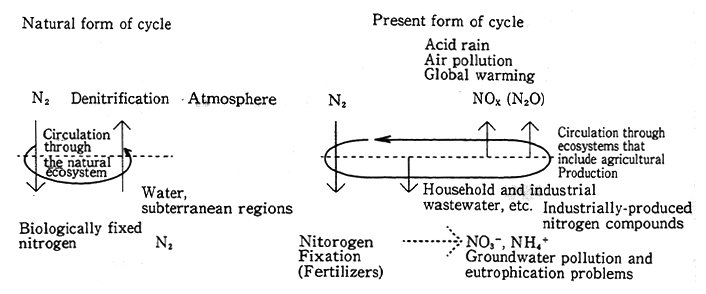
Besides industrially fixing atmospheric nitrogen for use in such products as fertilizer, humans also release NOx into the environment through fossil fuel combustion. When industrially produced nitrogen compounds are used, nitrogen that normally occurs in an atmospheric form is utilized by plants, which in turn return this nitrogen to the natural circulation system. In the latter case, nitrogen is discharged into the environment as NOx. Both of these cases result in various environmental problems. The following includes examples of an environmental load that occurs when the nitrogen cycle is not properly balanced (Figure 2-8).
Fig. 2-8
In recent years NOx emissions into the environment, particularly in large cities, resulting from fossil fuel combustion has caused various environmental problems. Looking at estimated volumes of NOx emissions in large urban areas in fiscal 1985, it is estimated that 52,700 tons of NOx were emitted in the Tokyo region, 54,700 tons in the Yokohama region, and 42,400 tons in the Osaka area. An examination of trends in emissions by source from fiscal 1983 to fiscal 1985 reveals that annual emissions from such mobile sources as vehicles decreased from 43,000 tons to 38,200 tons, while those from fixed sources, including factories and other places of business declined, from 15,300 tons, to 14,500 tons. However, after 1986, emissions of NOx in Japan began rising (Chapter 4, Section 1).
When NOx is emitted into the atmosphere it, along with SOx, are absorbed by cloud particles where they undergo a repeated complex chemical reaction resulting in precipitation with a high level of acidity, and the precipitation of dry particles. In other words, this is the cause of acid rain. The effects of acid rain are being felt worldwide, including in Europe, North America, and China, and can be seen in the extirpation of fish in lakes and marshes in Sweden, Norway, and Canada (See Chapter 4, Section 1).
In naturally forested areas, concentrations of nitrate nitrogen in groundwater rarely exceed 5mg/1. In cases where high densities of nitrate nitrogen are found, the cause is thought to be related to human activities, including excessive fertilizing and land treatment of wastewater from livestock and households. Nitrogen used in agricultural areas may produce such acidic compounds as HNO3 that permeate the soil and then is carried down further to contaminate groundwater as water seeps to lower levels. NO3- NO2-, and NH4+ in water and soil are a cause of groundwater pollution and eutrophication-related problems in lakes, bays, and other enclosed water areas.
One example of groundwater pollution caused by a nitrogen load the resulted from fertilizer is the case of HNO3 pollution in Kakamigahara City, in Gifu Prefecture. During the late 1960s and early 1970s, Kakamigahara City developed as a bedroom community near Nagoya, and many large-scale multidwelling public housing complexes were built. To supply water to these complexes, test drilling for water sources was carried out in local agricultural areas primarily used for carrot cultivation. This drilling produced water with nitrate nitrogen levels far exceeding the drinking water quality standards of 1Omg/1. In an anaerobic environment, nitrate nitrogen reacts to give off nitrite nitrogen, which breaks down to produce nitrous gas. The nitrite nitrogen drinking water quality standards were established because nitrite nitrogen can cause methemoglobinemia (cyanosis), especially in infants. The results of an investigation conducted by a group of specialists over a period of several years pinpointed fertilizer as the cause of the nitrate nitrogen pollution problem in Kakamigahara City. Agricultural groups indicated their understanding of this scientific evidence and, working with local government administration and producers, began improving their methods of fertilizing. By cutting the amount of fertilizer used 30%, they reduced the areas where nitrate nitrogen concentrations exceed more than 20mg/1. These new methods afforded a rise in yields of salable carrots owing to a reduction in excessive leaf growth and blight-causing insects, and as a result, productivity in the region has risen 15%.
Next, we would like to examine examples of eutrophication in the Tokyo Bay basin. The source of the nitrogen load in the Tokyo Bay basin is thought to be primarily wastewater from households, factories, and livestock production and farming.
There has been a precipitous rise in both population and the number of livestock in the Tokyo Bay basin, especially since the 1950s, as well as a decline in rice paddies and other cultivated land as demand for housing expands. Table 2-1 shows trends in the nitrogen load in the Tokyo Bay basin.
According to this table, the volume of the nitrogen load has been leveling off in recent years, with a load of 364.9 tons per day in fiscal 1979, 334.4 tons per day in fiscal 1984, and 319.5 tons per day in fiscal 1989.
Figure 2-9 shows preliminary calculations on the flow of nitrogen, primarily foods, in the Tokyo Bay basin.
On a daily basis, 295 tons of nitrogen originating from outside the basin and 45 tons of nitrogen from agricultural production are furnished as food for residents of the Tokyo Bay basin. After being consumed as food, 319 tons of nitrogen is emitted as household and 78 tons of nitrogen is emitted as waste from agriculture.
A portion of this nitrogen is treated and purified and a portion is returned to the atmosphere through natural denitrification. Therefore, the daily nitrogen load in the Tokyo Bay basin is calculated at approximately 294 tons of nitrogen, including 171 tons from humans. It is important to note that these preliminary calculations are based on the assumptions that there is no use of recycled nitrogen in agricultural production and to keep in mind that the volume of nitrogen inflow from outside the region for use in industry is uncertain.
Table 2-1 Trends in Nitrogen Load by Region and Type of Source
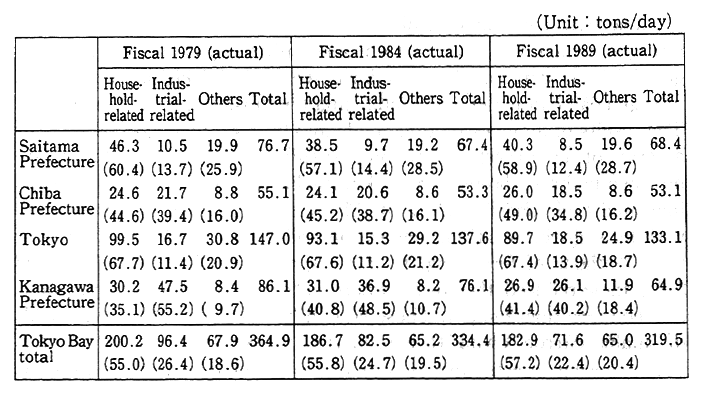
Fig. 2-9 Nitrogen Circulation in the Tokyo Bay Basin
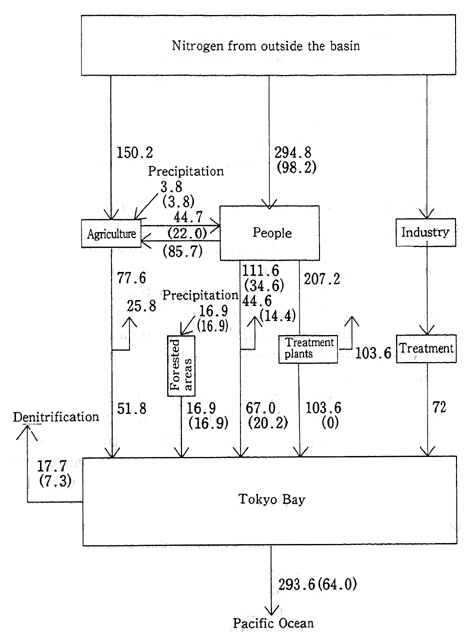
Reference : Preliminary calculations were made based on materials from the Agricultural Environment Technology Research Center and are 1990 values.Figures in parentheses are values for 1935.
Nevertheless, when looking at changes in the overall flow of nitrogen over many years, it is evident that the volume of nitrogen inflows has risen sharply. In 1935, the daily inflow of nitrogen into Tokyo bay was 71 tons, about one quarter the volume in 1990. The principal factors underlying this rise are thought to be the increased population and the growing concentration of industry in the Tokyo region, which have led to a jump in the use of fossil fuels and higher demand for food. These socioeconomic factors are skewing the nitrogen cycle.
The inflow of the nitrogen load into Tokyo Bay in this manner has caused the "eutrophication phenomenon," causing damage to beneficial water use.
Dinitrogen monoxide (N2O) is produced by natural sources, including oceans and soils, as well as by such man-made sources as the combustion of fossil fuels and such biomass as firewood, and the use of fertilizer on agricultural land. In the case of natural sources, through so-called denitrification, micro organisms cause a reaction that reduce nitrate or nitrite nitrogen into gaseous nitrogen (N2) or NOx (NO or N20). For man-made sources of nitrogen, there is nitrification in which N2 0 is created from ammonium nitrogen after being turned into nitrate nitrogen by nitrification.
Denitrification: NO3- NO2- NO N2O N2 N2O
Nitrification: NH4+ NH2 OH NO2- NO3+
Looking at dinitrogen monoxide over a 100-year time frame, it is believed that a specified volume of dinitrogen monoxide has a greenhouse effect 290 times higher than the same volume of CO2. It is calculated that the per-year volume of dinitrogen monoxide produced is in the range of 4.4Tg to 10.5Tg (= 1012). In recent years, particularly in the last 20 to 30 years, there has been a conspicuous rise in the volume of dinitrogen monoxide emitted, and it is necessary to focus on soils that use nitrogen fertilizers and the combustion of biomass.
The exact volume of dinitrogen monoxide emitted from fertilizers is not precisely known at present but is believed to range from 0. 01Tg to 2.2Tg, and, as was mentioned previously, the consumption of nitrogen fertilizers globally has grown sharply since around 1960 (Section 1). It is forecast that the latent environmental load from nitrogen fertilizers will increase.
(3) Toward the correction of the nitrogen cycle
Up to this point, we have examined the nitrogen cycle both on a global basis as well as in Japan. We have also provided vivid examples of how the nitrogen cycle has become skewed and that various environmental problems have emerged because nitrogen has become widespread on a regional basis as a result of the overuse of fertilizers, and the emission of nitrogen in amounts that exceed self-purification capabilities.
Overseas, Sweden has instituted a NOx emission surcharge system aimed at curtailing emissions of nitrogen oxides from such fixed sources as boilers. Also, the member countries of the EC have proposed an ordinance that covers pollution caused by nitrates from various sources to the protection of fresh and saltwater bodies and coastal waterways. Under this ordinance, so-called environmentally weak areas are designated, including those regions where if countermeasures are not implemented, the concentration of nitrate nitrogen in fresh surface water will exceed prescribed standards and regions that are encountering problems in maintaining the quality of groundwater. The ordinance is also aimed at establishing such countermeasures as restrictions on the use of organic and inorganic fertilizers.
In the United Kingdom, the government has prepared a Good Agricultural Methods for Preserving Water Quality guide for farmers in those regions that are easily affected by nitrates. If a farmer's operations become unprofitable as a result of having followed these guidelines, the farmer can receive income credits from regular government financial sources. In other countries as well, there are examples of economic measures being instituted to regulate the production and consumption of fertilizers and fossil fuels.
In Japan, which has abundant rainfall and is mountainous, forested areas comprise almost 70% of the nation's landmass. Because of these natural conditions, the institution of such measures is probably not appropriate. In Japan's agricultural industry, which is a materials circulation type industry, it is necessary to promote environmental protection oriented agricultural methods. Such methods should include a review of fertilizing standards and a promotion of efficient fertilizing through soil cultivation and diagnostics.
In this manner, to reduce the environmental load caused by such factors as the overabundance of NOx and nitrogen compounds on a regional basis, it would be effective to consider various types of countermeasures that incorporate a view of the overall nitrogen cycle.
3. The Energy Cycle
(1) An outline of the circulation and use of energy
On Earth there is a large flow of energy that includes complex relationships among energy from the sun (the influx of solar radiation), the flows of heat from the earth, and the tidal friction caused by the moon. The diagram in Figure 2-10 shows the balance of energy on the Earth's surface and atmosphere, with the volume of solar energy supplied to the Earth given value of 100. Of this amount of solar energy supplied, 30 is directly reflected back by clouds and so on, and the amount of solar energy actually penetrating the clouds and absorbed by the Earth's surface is about 50.
Fig. 2-10 The Earth's Energy Balance
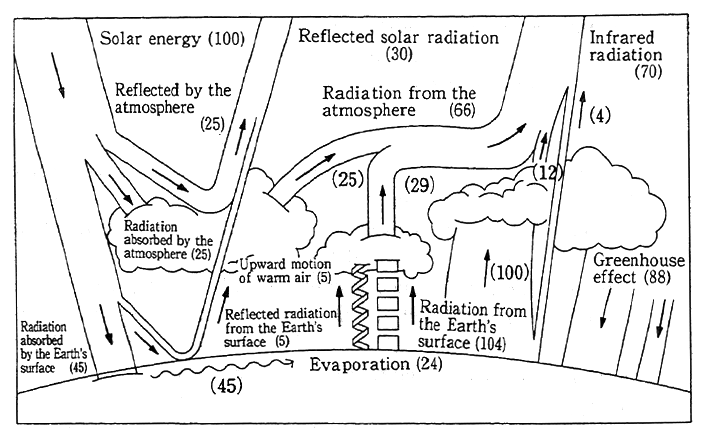
Source: S. H. Schneider, Scientific American 256 : 5,72-80,1987,Climate Modeling
On the other hand, energy radiated by the Earth's surface is absorbed by the clouds, which then radiate a large portion back to the surface of the Earth. In other words, the atmosphere and clouds allow solar radiation to penetrate with relative ease, but thermal radiation emitted by the Earth can not so easily pass through the atmosphere and clouds, and is thus reradiated back to Earth, warming the surface of the Earth. Through this mechanism, the Earth is able to maintain an appropriate temperature for sustaining the existence of biological creatures. Over a one-year period, solar energy equivalent to about 6. 55 ラ1020 kilocalories reaches the Earth. Also, the amount of energy consumed in the whole world in one year is approximately 7.13× 10¹⁶ kilocalories, and this manner of energy consumption affects Earth's complex and subtle mechanisms. The following is an overview of the current status of energy consumption.
First, to fully grasp world trends in the flows of primary energy, let us look at trends in production and consumption of fossil fuels. Figure 2-11 shows a calculation of the trade flow of fossil fuels produced in the various regions of the world, and the countries where these fossil fuels are consumed.
In 1990, North America produced 1906 metric ton oil equivalent (MTOE) of primary energy and consumed 2,116 MTOE, with per capita consumption amounting to 7.64 TOE, a figure far exceeding that of any other country or region. Although Europe produced 2,704 MTOE, it consumed 3,099 MTOE. Per capita consumption, at 3.67 TOE, was thus at a high level. Africa produced 511 MTOE and consumed 219 MTOE, and its per capita consumption, at 0.42 TOE, was low. Australia produced 170 MTOE and consumed 102 MTOE, with a high per capita consumption of 5.1 TOE. At 962 MTOE, the Middle East produced a high level of energy, but its consumption was at the low level of 238 MTOE, and its per capita consumption was 1.82 TOE, which is not considered overly high. Japan's energy consumption, at 428 MTOE, is overwhelmingly higher than its production of 69 MTOE. Japan's per capita energy consumption of 3.45 TOE is less than half that of North America but still remained at a high level compared with those of developing countries. Asia, excluding Japan, produced 1,146 MTOE and consumed 1,173 MTOE, with a per capita consumption of 0.43 TOE. The flows of energy can be seen by following the arrows in Figure 2-11, which shows conspicuous disparities between consumption and production and per capita consumption between the so-called north and south countries.
We would now like to examine Japan's energy consumption by looking at an energy flow chart (Figure 2-12).
Fig. 2-11 World Production, Consumption, and Trade of Fossil Fuels
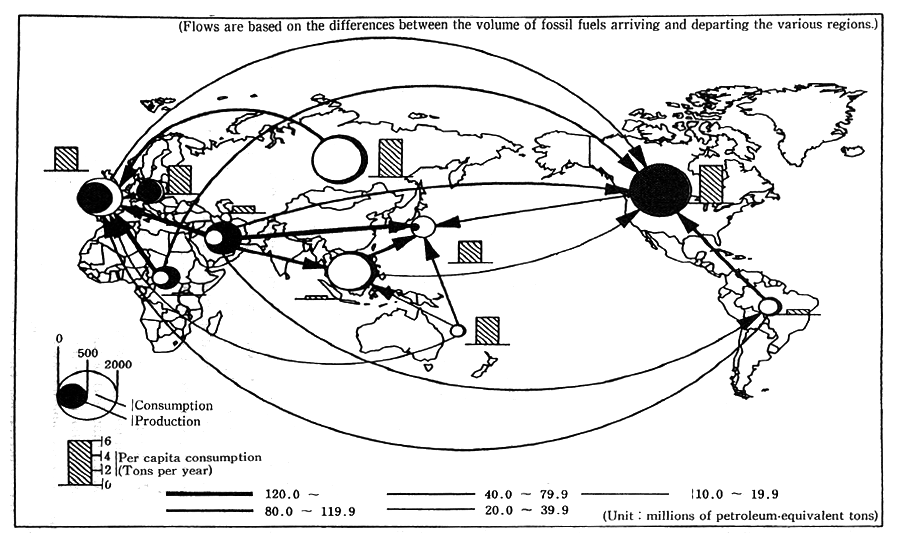
Reference: Compiled by the National Institute for Environmental Studies from UN trade and energy statistics. Figures are for 1988
Fig. 2-12 Flow Chart of Japan's Supplies and Consumption of Energy
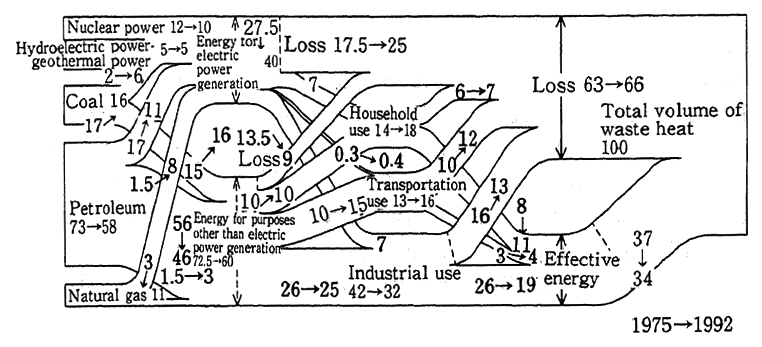
Reference: Compiled by Hirata, Tokyo University
More than half of the heat from Japan's imports of energy fuels is discharged back into the environment as unused heat. More specifically, Japan's energy loss by type of fuel use is 62.5% for power generation, 38.8% for household use, 75% for transportation use, and 40.6% for industrial use. Of Japan's inputs of primary energy, a mere 34% is used effectively, while 66% is directly discharged back into the environment as waste heat. The cause of this low efficiency rate can be traced to the energy released by combustion not being effectively used between the time the use the fuel generates a high temperature and the time it returns to the prevailing temperature. An example of this inefficiency is gasoline-powered automobiles : when idling time is taken into account, less than 20% of the energy is being used effectively. Moreover, to achieve a room temperature of 25-C, around 1,500-C of heat is required, and thus several hundred degrees of heat are discharged as waste energy.
(2) Environmental problems occurring with the use of energy
The use of energy also produces various types of environmental loads, which cause environmental pollution problems. In the combustion of fossil fuels, there is the possibility that various types of pollutants will be released into the environment. In Japan, atmospheric pollution from the emission of soot particles (black smoke and soot) from coal and petroleum combustion has become one of the more conspicuous environmental problems caused by the use of energy. Soot, which has large-radius particles, falls to earth as dust. Pollution caused by this soot became a very serious problem from the 1950s through the mid 1960s. Furthermore, because soot particles of less than 10 microns can adhere to the trachea and lungs and have an adverse influence on the respiratory system, environmental standards for suspended particles were established, but minimum requirements were low. The combustion of such fossil fuels as coal and petroleum, which contain sulphur, creates SOx. In the 1960s, mining and industrial activities, centering around heavy and chemical industries, were responsible for a sharp rise in energy consumption (a threefold rise over a period of 10 years). Nevertheless, petroleum accounted for most of this rise in demand for energy, and serious atmospheric pollution problems were caused by SOx emissions. Furthermore, there was also oxidation (combustion) of atmospheric nitrogen gas during high-temperature combustion and the creation of nitrogen oxides from the combustion of nitrogens in fuel. In addition, increased levels of CO produced by incomplete combustion from partially unburned fuel, and atmospheric pollution from photochemical oxidase created by combustion of NOx and hydrocarbons, also contributed to local atmospheric pollution problems.
SOx and NOx resulting from the combustion of fossil fuels are materials that cause acid rain and their production is closely related to the quality and amounts of fossil fuels consumed. In Japan, environmental damage from SOx and NOx has not become extensive (refer to Chapter 4), but there are concerns that such damage will become a serious problem even in developing countries, where demand for energy is expected to soar.
In urban areas, density of energy consumption is high. Furthermore, because the landscape of most cities consists mainly of such dried materials as asphalt and concrete, there is little prospect of temperatures being lowered through evaporation of moisture. In places where there is much greenery there is almost no accumulation of solar heat because of evaporation, but in cities asphalt and similar materials store solar radiation heat, which is discharged at night, thus preventing temperatures from falling. This results in a phenomenon whereby the temperature of a city is higher than that of its suburbs (refer to Chapter 4).
Global warming is a problem that directly threatens the foundations that support human life. It is urgent that measures to cope with the global warming issue be promoted. It is believed that global warming occurs due to a combination of factors, including the discharge of greenhouse gases and the diminishing of forested areas, which serve as a source for absorbing CO2. It is estimated that energy-related emissions account for 46% of the greenhouse gases emitted from human related activities (Figure 2-13).
Fig. 2-13 The Contribution of Human Activities to Global Warming by Category in the 1980s
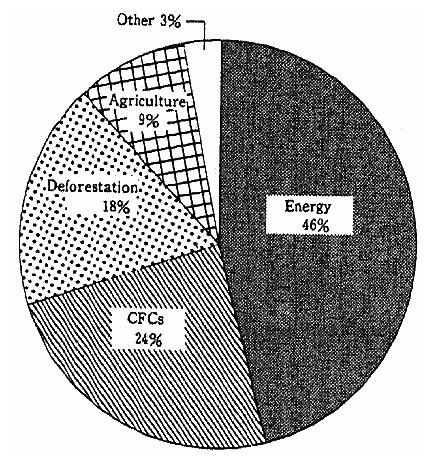
Estimates by the IPCC's Third WG.
Table 2-3 Actual Examples of the Use of City Gas
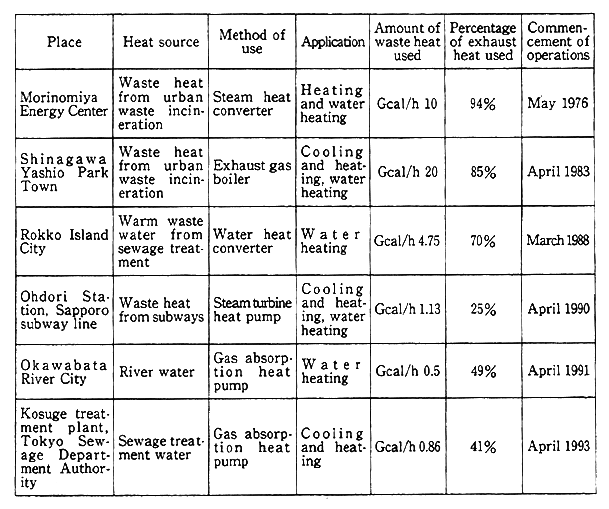
Source: Survey conducted by the Japan Gas Association
(3) Toward the effective use of energy
In searching for ways to use energy effectively, measures have been considered from various perspectives. At this point, from the perspective of eliminating waste in the use of energy, we would like to examine unused energy, cogeneration systems, and power generation using waste.
A. Current status of the utilization of unused energy
Most energy supplied to large urban areas is ultimately lost as heat to the atmosphere, rivers, and oceans. It would be highly beneficial to focus on effectively using this energy. This energy is emitted by various types of facilities, including waste incineration plants, thermalfired power plants, electric power transmission and transformer facilities, factories, and sewage treatment plants, as well as subways and underground arcades. In Japan, waste heat from waste incineration plants, sewage and sludge incineration, and subways, as well as sewage water, treated sewage water, and river water are being used in various ways.
In regions of extreme cold, such as northern Europe, supplying locally procured energy for heating purposes is a vital public undertaking, and thus the utilization of waste heat is being pursued vigorously (Table 2-4).
Table 2-4 The Performance of Absorption Heat Pumps in Northern Europe
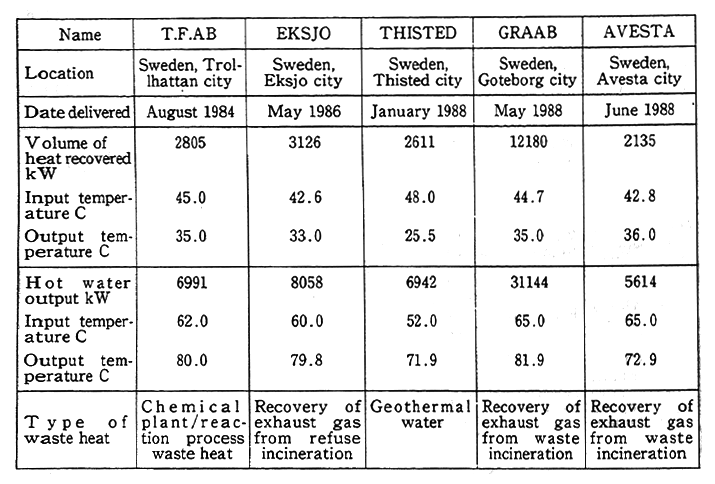
Source : Survey conducted by the Japan Gas Association
For example, in Goteborg, Sweden's second largest city, Goteborg Public Corporation is providing regional heating using waste heat from waste incineration plants. The corporation's waste incineration plants (annual waste processing volume of 300,000 tons), generate 14,000kW of electric power using the largest steam turbine in Europe. At the same time, a portion of the steam is extracted and is used as a heat source for an absorption heat pump. This absorption heat pump raises the temperature of 40-C waste heat emitted by a scrubber for treating exhaust gas to between 75-C and 115-C, and this heat is then used for regional heating.
In the United States, regional cooling and heating facilities are very advanced, reflecting the extremes of local climatic conditions. The Midland Cogeneration Venture (MCV), in Midland, Michigan, has converted an uncompleted nuclear power plant into a combined-cycle cogeneration electric power generation plant. The conversion of this facility was completed in 1990. The facility has twelve, 85MW gas turbine power generators that supply waste heat to twelve steam energy recovery units and energy to one of two steam turbines. By combining equipment in this manner, the plant can generate 1,380MW of electric power as well as provide steam and 60MW of electricity to a neighboring chemical company.
In the future, it will be necessary to more aggressively utilize high-temperature and low-temperature waste energy.
B. Cogeneration systems
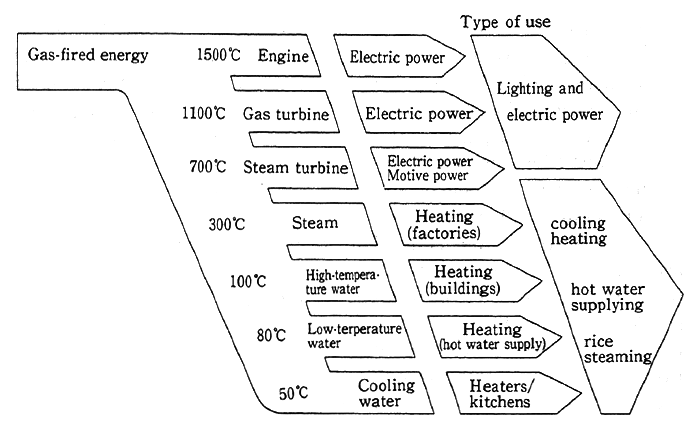
The efficient use of energy is contingent on effectively using heat at all stages from high temperature to low temperature. For example, until recently, at ordinary thermal-fired power plants, fuel combustion was used for electric power generation only; waste heat was not used to drive steam auxiliary turbines and make better use of the energy released. Instead, a boiler was fired when heat was needed, and electric power and heat generation were carried out as two independent operations. The cascade method of energy use-in which high-temperature heat is used to generate power in steam turbines, then for other purposes, before the temperature falls and it is emitted as waste heat--represents the first step in the rational use of heat energy. Cogeneration systems employ this method.
Cogeneration systems make use of energy released through high-temperature combustion for electric power generation, while also using waste heat produced when the turbines are driven for other energy-related purposes. Using the cogeneration method, if demand for heat and electric power are optimally combined, between 70% and 80% of primary energy can be used effectively (Figure 2-14).
Fig. 2-14 Diagram of a Typical Cogeneration System
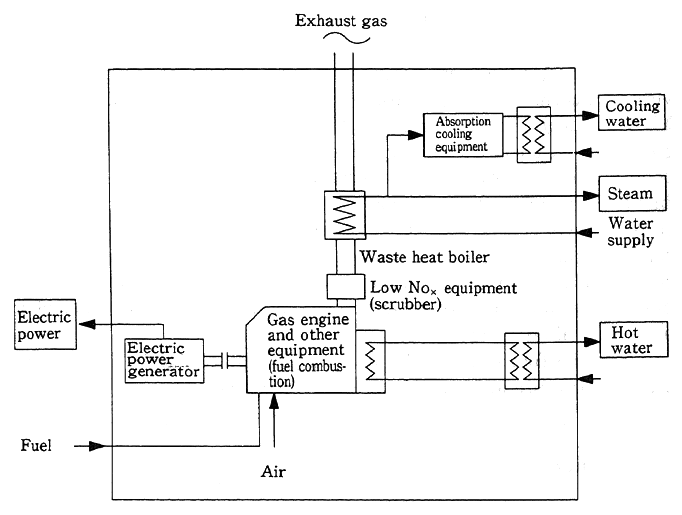
There are various types of heat turbines that convert heat into energy. These can be classified into three broad categories to cover high-temperature, medium-temperature, and low-temperature heat. To fully take advantage of the total potential of heat energy--from high --temperature heat to low-temperature heat-it is necessary to employ a combination that utilizes the special characteristics of each type of heat generating turbine. As shown in the diagram, with the cascade method of energy use, different levels of heat are used to generate energy to meet various requirements. This method is best used in industrial-use processing, providing additional heating and water heating, and powering coolers and heaters (Figure 2-15).
Fig. 2-15 The Cascade Method
Although cogeneration systems are valued primarily for their efficiency, it should be pointed out that these systems also produce less CO, and thus the aggressive introduction of these systems is desirable. With regard to NOx, the results of surveys reveal that among systems that meet prescribed emission standards, the total NOx emissions of cogeneration systems are lower than those of traditional systems that supply electric power and heat using boilers and electricity purchased through traditional power grid lines.
As we have shown, cogeneration systems are extremely effective in enabling efficient energy use and reducing emissions of CO2, and it is hoped that the use of such systems expands even further in the future.
C. Electric power generation from waste
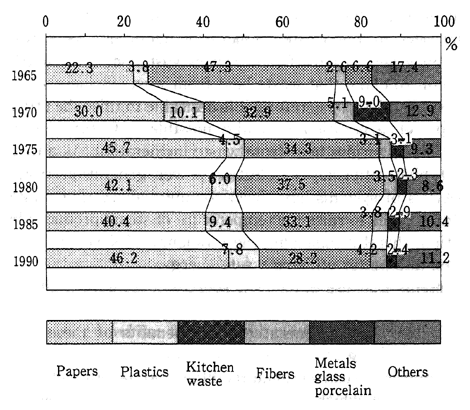
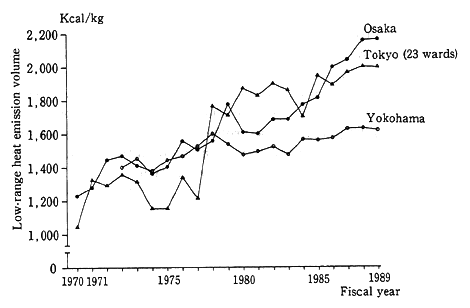
In recent years, the volume of waste material has grown while the content has become increasingly diverse. In addition to the need for securing appropriate treatment, it is necessary to reduce the volume of waste emitted and to promote recycling and reuse, particularly as it is becoming increasingly difficult to secure reclaimed land for final disposal. Therefore, efforts to reduce the reclamation volume should be aimed at combustion treatment and aggressively recovering excess heat produced from this combustion of waste, which should be accompanied by a shift in the focus of awareness away from disposal toward more effective use of waste. At present, there are instances of electric power being generated from waste through the effective use of excess heat from waste combustion. As shown in the diagram, because the composition of waste is changing qualitatively, reflecting the increased proportion of papers and plastics, this is leading to higher-calorie heat and excessively high temperatures in incinerators. Therefore, there are concerns that the volume of waste material that can be incinerated will simultaneously fall (Figures 2-16, 2-17).
Fig. 2-16 Changes in the Composition of Waste over a Period of Years (Tokyo)
Source : Tokyo-to Seiso Kyoku (Tokyo Sanitation Department), An Outline of Operations.
Fig. 2-17 Trends in the Volume of Heat Emitted per Kilogram of Waste
Source : From materials provided by the Ministry of Health and Welfare.
Because exhaust emitted by combustion is extremely hot, at around 900?, the heat from this gas is easy to use. Furthermore, except when regular periodic inspections of facilities are being conducted, stable supplies of this gas are available. This gas is also of high quality in terms of energy efficiency. Given these factors, the aggressive promotion of the use of this exhaust gas is desirable. Nevertheless, under present conditions, because of dangers of boiler tube corrosion caused by hydrogen chloride and other substances in combusted gas, the use of this heat energy source has remained low. At present, waste incineration plants are often situated far from housing or commercial sites and thus the use of waste heat has been limited primarily to providing hot water and heating within the plant itself. There is a growing number of waste incineration plants, however, that are supplying heat and electric power to adjacent public welfare facilities, including swimming pools and retirement homes. At the end of 1992, of all the waste incineration plants in Japan, 116 plants had electric power generating capabilities with a maximum power output of 360,000 kilowatts. Of these plants, 56 produced more than enough electric power to meet their own needs and sold their surplus electric power.
There are also waste incineration plants aiming to combine their operations with sewage treatment plants. At some such plants, steam and electric power generated from exhaust gas at waste incineration plants are being used at sewage treatment plants, as is the waste heat from the combined incineration of waste and sewage-sludge cake.
In Japan at present, as outlined previously, in the process of generating electric power from waste, the temperature of the steam from waste incineration facilities is considerably lower than that of the steam at ordinary thermal electric power stations, which is due to the characteristics of the waste incineration facilities. As a result, the electric power generation efficiency from waste incineration is low, and it is difficult to claim that waste heat from waste incineration is really being used effectively. Therefore, it is desirable to raise the efficiency of electric power generation to make possible a further increase the effective use of surplus heat from waste incineration. As a method for achieving high efficiency in electric power generation from waste, various types of systems have been commercialized that make use of other heat sources to raise the temperature of steam produced by waste incineration, thereby enhancing the efficiency of steam turbine power generation and better utilizing waste energy.
Systems that use other heat sources to achieve highly efficient power generation from waste incineration have been named Super Waste Electric Power Generators. The benefits of these generators include the following:
キIn contrast to conventional facilities that generate electric power from waste, which have a generating efficiency of between 10% to 15%, Super Waste Electric Power Generators raise electric power generating efficiency to between 20% and 25%.
キSuper Waste Electric Power Generators can be installed externally at waste incineration plants that do not currently have electric power generating capabilities, thus enabling these plants to generate their own electric power.
キBecause there are two systems generating heat, it is possible to operate one system to maintain a minimum power output even when the other system is down for periodic inspection.
The use of Super Waste Electric Power Generators by regional public agencies will enable the more efficient utilization of unused waste energy and will help address the problem of global warming. Also, the revenues from sales of electric power can be used to more aggressively implement environmental policies in various regions.
4. The Forest Resource Cycle
(1) Current status of the world's forest resources and the flow of timber into Japan
The Earth's forests are a valuable natural resource deeply related to the planet's heat and water balances and help to maintain the proper environmental conditions necessary for sustaining the existence of other biological life forms. Forests also provide natural habitats for wildlife, maintain water sources, and provide timber needed by humans in their lives. Forest resources are inherently renewable and the process by which they are renewed can be characterized as a natural resource cycle. To better illustrate how the forest resource cycle, especially in tropical forests, has been threatened in recent years by socioeconomic activities, we would first like to examine the current status of the world' s forest resources and the flow of timber into Japan.
It is estimated that in 1990, the world had approximately 40,280, 000km2 of forested areas--equivalent to about 30% of the world's landmass. The forests of developed countries account for about 50% of the world's forested areas, and, of this, approximately 90% is in the United States, Canada, and the former Soviet Union. The forested areas of developing countries total approximately 21,277,000km2 which accounts for more than 50% of the world's total forested areas. Of this amount, the Near East and the Far East accounted for 5,559,000km2 Central America and South America 8,928,000km2 Africa 6,351,000km2 and other regions 439,000km2 In recent years, although there has been almost no change in the amount of area of forested land in developed countries, there has been a conspicuous decrease in that of developing countries (Figure 2-18).
Fig. 2-18 Trends the Area of the World's Forestlands
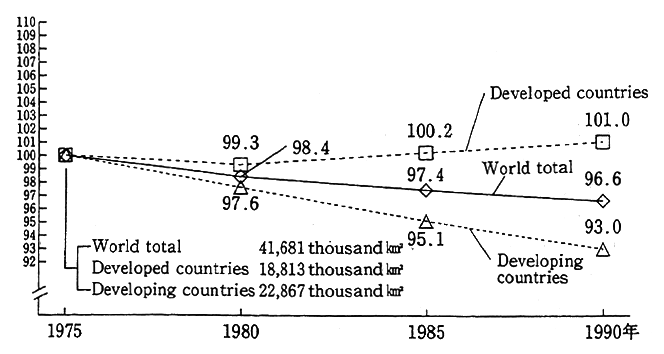
Reference: Compiled from FAO, Yearbook Production, 1991.
Note : The world's forested areas include natural forests, plantation areas, and planned afforestation in areas that have been cut.
In developing countries with tropical forest, it is believed that the lack of sustainable forest management is the reason for deforestation and degradation. Although a more detailed explanation is provided in Chapter 4, a survey conducted by the FAO reveals that the area of tropical forests in developing countries has declined 154,000 km2 year from 1981 through 1990. This figure is equivalent to approximately 40% of Japan's landmass and 60% of Japan' forest areas. Contributing to this deforestation of tropical forests are 1) non-traditional slash-andburn agricultural methods; 2) the excessive consumption of firewood; 3) indiscriminate commercial logging ; 4) and overgrazing, etc. These factors mirror such socioeconomic factors as population increases, poverty, and land-use and tenure systems. The largest cause of tropical deforestation is both planned and unplanned conversion of forest to agricultural land, coupled with the failure of sustainable agriculture stemming from this conversion, which results in large amounts of devastated land. Other factors include such social-related damage as slash-and-burn cultivation and illegal logging. (Tropical deforestation yields large quantities of a limited number of products with marketability; however the benefits of maintaining forests are not fully appreciated). Also, profits from cutting of forests and the benefits of converting forests to multiuse purposes are overstated, while the ultimate adverse social costs of these activities have been largely ignored. In addition, many developing countries are facing problems related to slumping prices for primary products, a worsening of their trade balances, and a snowballing of accumulated debt. Therefore, it is thought that to earn needed foreign currency, it has been pointed out that these countries are overexploiting their resources without making proper environmental considerations.
The sustainable use of forest resources is not an issue confined to tropical forests in developing countries, but it encompasses forests in both temperate and boreal regions of developed countries. For example, in the U. S. northwest, to protect the spotted owl, which has been designated an endangered species, the U. S. federal district court order-ed a temporary suspension of sales of timber from national forests. In 1992, the volume of timber cut in Washington and Oregon was down approximately 70% and 60%, respectively, from 1988. Furthermore, in British Columbia, Canada, there has been excessive logging, and presently allowable volumes there are under review.
Next, we will examine Japan's role in the world timber market, focusing on the current supplies to Japan. When converted into logs, the volume of timber material supplied to Japan is 108,490,000 m3, quarters of which is imported (Figure 2-19).
Fig. 2-19 Japan's Supplies of Timber Products
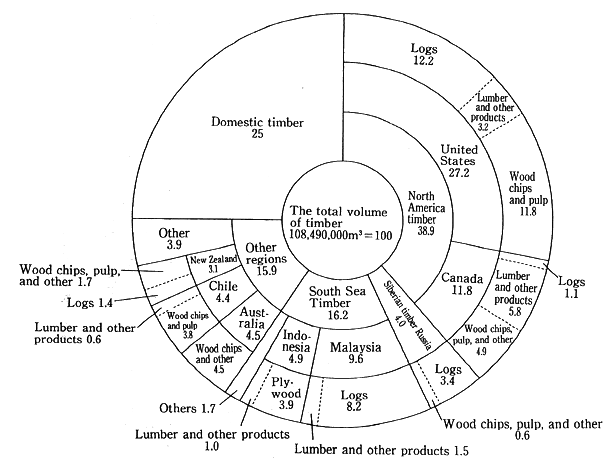
Note : 1. For products other than logs, figures were converted into log equivalents.
2. Because numbers have been rounded, the sum of individual categories does not equal the total figures.
Source : Forestry White Paper, 1993.
Japan imports timber from various regions, with just under 30% coming from the United States, approximately 10% from both Canada and Malaysia, under 5% from Indonesia, and the remaining portion from Australia, Chile, and other regions.
A trend observed in recent years has been a decline in Japan's imports of logs and an increase in imports of finished timber products, including lumber and plywood. This trend reflects greater efforts to protect the environment in timber-producing nations, prevent tropical deforestation, and cultivate processing industries in tropical timber producing countries. With regard to timber imports from North America, imports of logs and lumber products from the United States began to decline from 1988, while imports of lumber from Canada began trending upward from 1983. During the 1960s, Japan's imports of tropical timber (south sea timber) came from countries in Southeast Asia and Oceania with tropical forests, primarily from the Philippines. However, because of a decline in natural resources and the development of the timber processing industry in that country, the Philippines was replaced by Indonesia as Japan's top supplier of timber products in 1971. In Indonesia, because of efforts to develop the domestic plywood industry, exporting of logs was totally banned in 1985. Thus during the last half of the 1980s, 90% of Japan's imports of logs were from the Malaysian states of Sabah and Sarawak (Figure 2-20).
Table 2-5 Trends in Imports of South Sea Logs and Lumber

Source : Compiled by the Environment Agency from the Ministry of Finance, Trade Statistics
Fig. 2-20 Trends in the Volume of Japan's Imports of South Sea Logs and Lumber
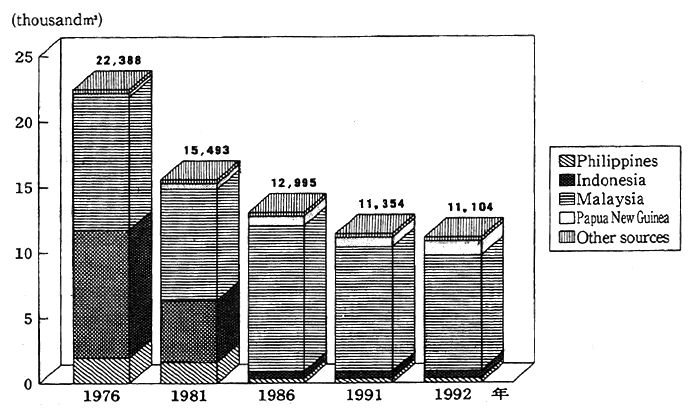
Source : Compiled by the Environment Agency from the Ministry of Finance,Trade Statistics
With regard to trends in the types of south sea timber products imported from Southeast Asia and Oceania, imports of logs, lumber, and plywood amounted to 17,507,000m3 121,000m3 and 36,000m3 respectively in 1975. In 1991, however, these figures were 10,168,000m3 1,186,000m3 and 433,529,000m3 respectively, reflecting the shift in the composition of imports from Southeast Asian countries and Oceania away from logs toward lumber and plywood (Table 2-5).
(2) Effects on the environment
There are growing concerns about the effects of deforestation both on a regional and global level. First, if environmental considerations are not heeded, the over-reliance on particular regions for forest resources will probably lead to a worsening of local environmental problems. More specifically, shortages of such resources as timber and firewood as well as the increased incidence of floods and water fouling due to deforestation will prevent stable regional development. On a global scale, deforestation has an adverse effect on ecosystems. Estimates on the influence of deforestation on various species have been made. Among these, Reid & Miller (1989) prepared an estimate using approximate values for tropical deforestation that appeared in an FAO forest resource evaluation, as well as the Species-Area Curve, which illustrates the relationship between the number of living species and the size of habitat. Reid & Miller estimated that anywhere from 5% to 15% of the world's species will become extinct between 1990 and 2020. When supposing that there are about 10 million species, including unknown species, from 50 to 150 species will become extinct each day.
Deforestation is also causing soil degradation and is responsible for 30%, or 57.8 billion km2, of the land worldwide where the soil is degraded. The principal way deforestation causes soil degradation is by leaving top soil vulnerable to erosion because of the lack of vegetative covering. Even if new vegetation appears, soil degradation will continue unless a balance (such as the nutrition cycle) is achieved between vegetation and the soil.
Additional concerns about the effects of deforestation center on its role in global warming. In developed countries, agricultural land is well established and declines in forest areas have been small. In developing countries, however, rapid tropical deforestation is causing large volumes of CO2 to be emitted and accumulated in the environment, thereby accelerating global warming. About 30% of the solar energy that forests receive warms the atmosphere and soil, while the other 70% evaporates the moisture that accumulates in the leaves of plants. This evaporation helps create mild climatic conditions. If deforestation continues on a large scale, there are fears that the global temperature and the water balance will be adversely affected. According to the IPCC, between 600 million tons and 2.6 billion tons of carbon are released into the atmosphere every year as a result of deforestation. This corresponds to about 30% to 40% of the total volume of CO2 emitted annually by the combustion of such fossil fuels as petroleum and coal.
In addition to the negative environmental effects of global deforestation, there are concerns about the environmental impact of current types of timber use. For example, the emission of timber waste is one cause of waste problems. Also, the proportion of paper waste has increased in recent years. In fiscal 1990, timber waste emitted was 6,573, 000 tons. Even when the amount of paper waste is not all that high when measured on a weight basis, it is important to note that paper accounts for a large proportion on a volume basis. When industrial paper waste is added, the actual volume of timber waste emitted in fiscal 1990 amounted to 8,766,000 tons. The exact proportion of timber waste and paper waste in general waste is uncertain but is believed to be about 20% to 30% of the total 27,019,000 tons of combustible general waste produced annually. This translates to more than 15,000,000 tons.
(3) Toward the effective use of timber to maintain the forest cycle
Japans socioeconomic activities strongly influence the state of the world's forests. Countries around the world are expecting Japan to make further contributions to environmental conservation and sustainable management of the Earth's forests, beginning with tropical forests. To maintain the forest cycle, first of all, forest conservation and sustainable management are imperative. Regarding these points, several Japanese companies are participating in planned afforestation.
Second, aiming for the more efficient use of timber will also contribute to keep the forest cycle. One means of achieving this is promoting the development of timber processing technologies. Countries producing tropical timber have been shifting away from the export of low-value-added logs to the export of higher-value-added finished products by placing greater emphasis on raising the level of domestic processing. In plywood manufacturing technologies, Japan's yield is about 65% compared with about 50% for developing countries; and thus, it would be beneficial to promote technological cooperation with those developing countries with a low level of processing technologies. It is also important that Japan implement an even more effective use of timber resources domestically. This approach would include such methods as thinning wood and using forest wastes more efficiently. For example, if a long period of time is allotted for the consumption of timber stocks, forests will have sufficient time to regenerate themselves. Also, by using timber in such products as housing materials, CO2 will be stored even after a tree is cut, which is also an effective means of preventing global warming. Moreover, compared with other types of construction materials, timber materials require an exceedingly small amount of energy for production. For example, the amount of energy expended to produce artificially dried timber materials is 0.5% and 0.1% respectively of that needed to produce steel and aluminum materials. Also, another significant benefit of wooden houses is that they store large amounts of carbon. It is calculated that the amount of fixed CO2 (carbon conversion) stored in a typical Japanese wooden house is about 50kg/m2. The total amount of CO2 stored in this way in Japan corresponds to approximately 20% of the amount stored in the timber of Japan's forests and to just less than 50% of its plantation forests. The recycling and effective use of waste timber, which in the past was used simply as a heat source, is also a useful means of reducing the environmental load. Examples of effective utilization include using timber waste to produce particle board and fiber board as substitutes for plywood as well as for the manufacture of charcoal. Charcoal has a multiporous structure that allows air to pass through and has excellent absorption capabilities. Therefore, it can be used not only for fuel but also for purifying polluted water. In Fukuoka Prefecture, Hisayama town is using septic tanks all over the town that employ activated charcoals purifying capabilities to reduce BOD in household wastewater to less than 10ppm. Charcoal is also being used to enrich the soil in agricultural land for crop cultivation. Another forest product, wood tar is used as an additive in the production of tires, and the effective ingredients of wood tar are used for medicinal purposes.
There are several problems involved in the recycling of waste timber including, 1) the increase in instances of wood scrap rendered into useless waste because of the growing reliance on machinery to dismantle buildings; 2) the unstableness of supplies of wood scrap for use as a raw material ; 3) the lagging development of needed technologies; 4).the costs involved in processing waste timber for reuse, which makes the use of virgin resources more economical and 5) the difficulty of separating waste timber from other waste. To solve these issues and progress with recycling efforts, an optimal allocation between the use of virgin resources and recycled resources needs to be achieved and users and producers need to cooperate to ensure that timber products are used effectively.
The Environment Agency, with the goal of responding to the greater demand for paper as society becomes increasing information oriented, and keeping in mind the importance of using paper efficiently and promoting the use of non-wood fibers, convened the Committee for Deliberating the Use of Kenaf and Other Materials as Alternative Resources for the Conservation of Forests. This committee carried out preparatory studies and evaluations of kenaf and other materials as alternative pulp sources and, in turn, concluded that, because kenaf grows fast, it is ideal as a raw material for paper. In addition to efforts to use paper effectively and to further promote the use of recycled paper, the use of this type of raw material ,will be vital in the future.