Quality of the Environment in Japan 1993
(2) Present Status of Wildlife Resources
From old, man has made it a practice to capture wildlife for use as food and raw materials. Given ecosystems, man positions himself as a predator. Even at present, man is evolving fisheries, hunting and other activities in which he takes in the blessings of nature. Not only man threatens the basis of ecosystems with pollution and so forth, but he finds himself in a position to affect ecosystems as a predator. From this perspective, let us see how wildlife is captured.
a. Marine Resources
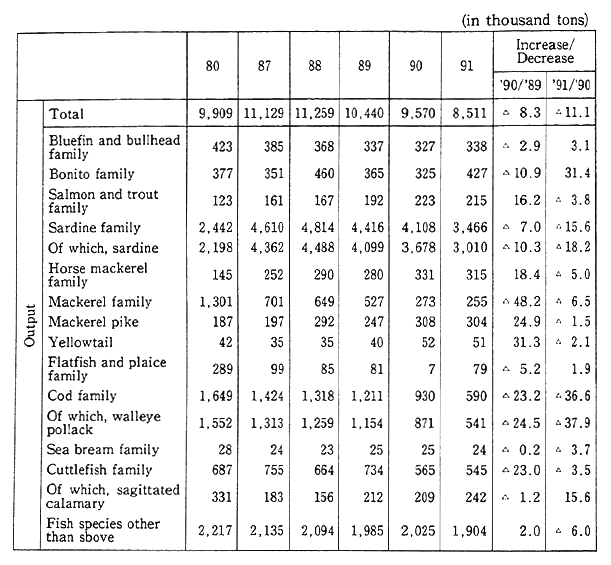
The Japanese people have traditionally made effective use of marine products as an important protein source. In the postwar years, the output of marine products has consistently increased. Tn 1981, the output of sea-surface fisheries excluding ocean culture exceeded 10 million tons, rising to 11.5 million tons in 1984. But output began to drop in 1989, coming to 8,510,000 tons in 1991. A check of trends in output by major fish species indicates that the output of the sardine, walleye pollack and mackerel genera is on the downturn (Table 1-2-16). In waters around Japan, the availability of resources centering on seabed fish stays at a low level because of the rise in the fish hauling intensity brought about by improvements in the performance of fishing vessels, and there is concern about a possible drop in the future availability of sardine resources.
Table 1-2-16 Output of Sea-Surface Fishorios by Major Fish
Source : Ministry of Agriculture, Forestry and Fisheries, Statistical Yearbook on Fishery and Aquaculture Output
Note : Output from sea-surface aquaculture is excluded.
In 1984, the Food and Agricultural Organization (FAO) released a projection on a sustainable annual fish haul for each sea region of the world. A comparison of the projects with actual annual fish hauls reveals that the yields exceed the sustainable hauls in the northwestern and southeastern part of the Pacific including seas around Japan, the Mediterranean, the Black Sea and the eastern part of the Indian Ocean, and that they have reached the sustainable hauls in the mid-western part of the Pacific, the northeastern and mid-eastern parts of the Atlantic and the mid-western, northeastern and mid-eastern parts of the Pacific (Table 1-2-17). When it comes to the projected FAQ values, it is neces- sary to note that they are none other than roughly projected values as it is difficult to scientifically project sustainable fish hauls in a global dimension, and that the projected values have possibly risen since the projection was made due to the development of fishing grounds and other factors. In the northwestern part of the Pacific, fish hauls in excess of the upper value (16.5 million tons) of sustainable fish hauls projected by the FAQ have been documented since 1974. In the south- eastern part of the Pacific, on the other hand, fish hauls in excess of the upper value (10.3 million tons) have continued since 1985 despite the existence of an considerable allowance for the projected values.. In any event, the world"s fishery output rose by 34% from 75,690,000 tons in 1978 to 101,580,000 tons in 1990. Given this rise, it is all the more important to five consideration to a sustainable utilization of marine resources.
Table 1-2-17 Marine Fisheries, Yield and Estimated Potential
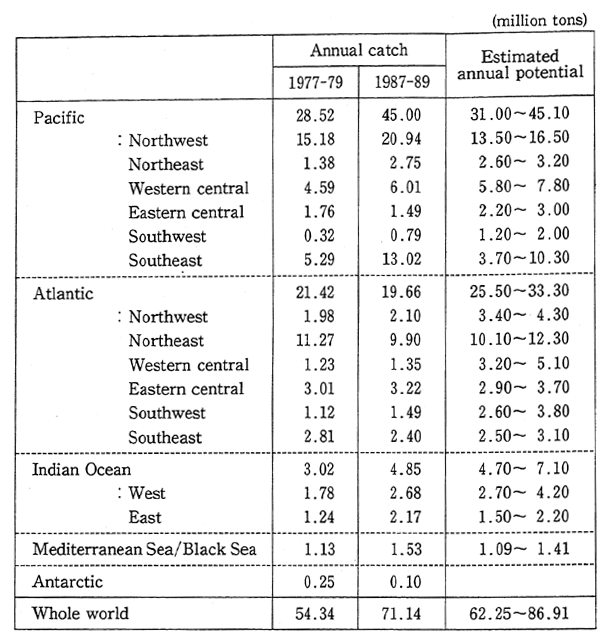
Note : The subtotals of sustainable resources in the Pacific Ocean, the Atlantic Ocean and the Indian Ocean include the amounts of oceanic petagic fish resources (2,000,000-2,400,000 tons for the Pacific Ocean, 800,000-1,000,000 tons for the Atlantic Ocean and 500,000-700,000 tons for the Indian Ocean). No estimates are made for individual sea regions.
Source : FAO, World Resources 1992-1993
Relations between fisheries and the protection of wildlife are taken up at a wide variety of international congresses. At the 8th Conference of Parties to the Washington Convention (held in Kyoto in 1992), there were moves to put restrictions on the international trade of bluefins by listing those of the Atlantic Ocean's western part in Appen- dix I and those of the Atlantic Ocean's eastern part in Appendix II. In Western and other countries, there are brisk moves against whaling with whales taken up as a symbol of the environmental protection movement. At the Earth Summit, however, the principles of reasonably utilizing oceanic life resources including whales were confirmed, and at the International Whaling Commission, debate is under way on the resumption of coastal whaling and the establishment of sanctuaries for Antarctic whales. Moreover, world attention is focused on the mixed hauling of marine fauna, sea birds, sea turtles and so forth. In 1991, a resolution was adopted at the U. N. General Assembly in 1991 for a moratorium on drift-net fishing large in scale on the high seas, and Japan decided to suspend it by the end of 1992.
Marine resources will remain indispensable for a supply source of nutrients and as feed, fertilizer and other raw materials, and their sustainable utilization is extremely important. Fisheries hold good when reproducible natural resources are utilized. It is important to engage in fisheries of the sort which is reasonably controlled on the basis of scientific data.
b. Hunting
Hunting is done as a line of business and for recreation and other purposes. As a result, it plays a role in appropriately controlling the number of wild birds and other animals in habitation to satisfy the accommodation capacity of nature.
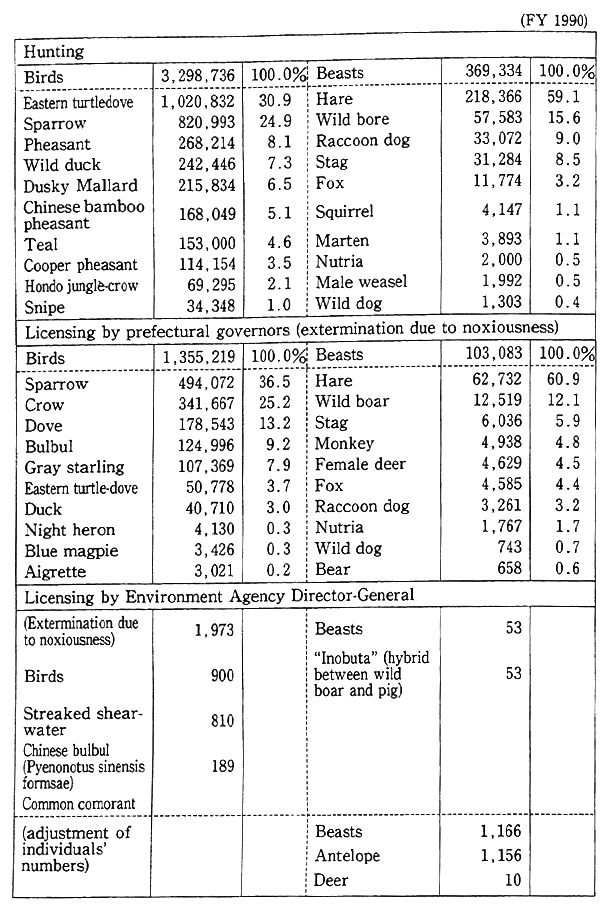
In Japan, wild ducks, pheasants and 28 other birds and wild boars, stags and 15 other animals are designated for hunting. In fiscal 1990, about 3.3 million birds designated for hunting were captured. Of them, eastern turtledoves accounted for 30.9% and sparrows 24.9%. In the same year, about 370,000 animals designated for hunting were caught. Hares accounted for 59.1%, boars 15.6% and racoon dogs 9.0%.
For the extermination of hazardous birds and other animals, the prefectural governors and the Director-General of the Environment Agency are empowered to authorize the capture of wildlife. In fiscal 1990, about 1,360,000 birds and about 100,000 other animals were captur- ed with the authorization of prefectural governors. In the birds, the number is great for sparrows (36.3%), crows (25,1%) and domestic pigeons (13.1). As for other animals, the number is large for hares (62. 7%) and boars (12.5%). In all, it is projected that 4.8 million birds and 480,000 other animals were captured, including those hunted.
Until 1976, the numbers of hunting licenses and yields had continued to rise, but the number of birds and other animals captured subsequently dropped at a fast pace from a high of about 3,670,000 birds and other animals in 1980, coming to the aforementioned 3,670,000 birds and other animals or so in fiscal 1990. A check of trends in the hunting population indicates that the number of hunters which had stood at 530, 000 in 1976 dropped to about 290,000 in 1990, and there are signs that aging is in rapid progress (Table 1-2-18).
Table 1-2-18 Hunting and Capture of Main Beasts and Birds
Source : Environment Agency, Bird-and Beast-Related Statistics, FY 1990
c. Wildlife in International Trade
Developed countries import fauna and flora--particularly, those in the tropical zone, for appreciation and other purposes. Importing countries have a taste for rare fauna and flora, and partly because the advance of transporting technology, the volume of trade from develop- ing countries to developed countries is on the rise, and there is concern about impacts on the habitation and growth of wildlife species.
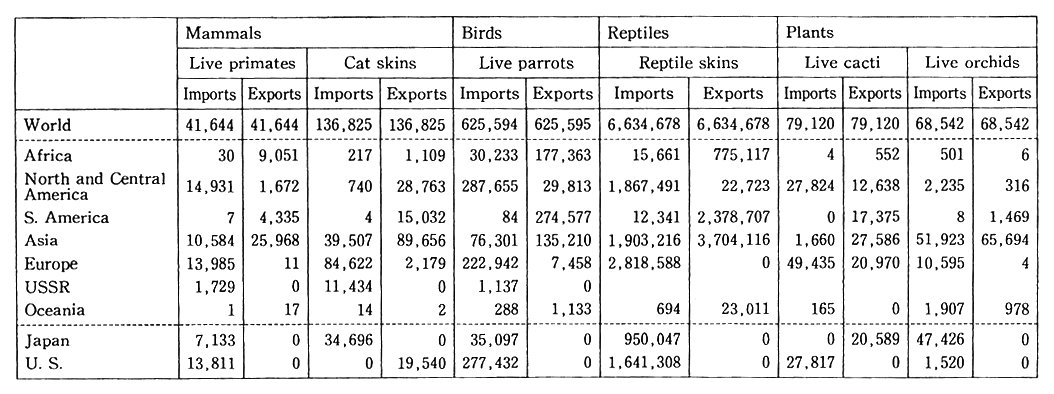
The Washington Convention was concluded to prevent trade activities from adding to the extinction of wild fauna and flora, and trade controls, including a ban on international trade, are exercised on the international transaction of some endangered species. Table 1-2-19 indicates the international trade of the species restricted under the Washington Convention, suggesting that developed countries import wild fauna and flora from developing countries--particularly, those in the tropical zone. In 1990, The secretariat of the Washington Convention found inappropriate the trade of Thailand's wild orchids and other fauna and flora and called on the Thai government to legitimatize the controls and on signatories to refrain from dealing in all subject species for controls under the Washington Convention.
Table 1-2-19 Dealings in Wildlife and Wildlife Products Reported Under Washington Convention (1988)
Note : Data unknown
Source : World Conservation Monitoring Center
Data : World Resources 1992-93
1-2-3 Other Natural Resources
We and our ancestors have enriched our spiritual lives while making skillful use of affluent nature. Of late, there are moves to pay greater attention to the environment to attain a lever of environmental quality including the starry night and clear blue skies, that would exist had the current measures been taken long ago, in the natural course of events. In the following, the issues of hot springs, sea bathing beaches, "100 selected waters of renown," activities for the blue sky, giant trees and forests will be introduced.
(1) Hot Springs
Japan is a prominent hot-spring country in the world, and hot springs have been utilized as places for recuperation and rest. They have long constituted one of the nation's top recreational areas along with their natural settings to which reference has already been made. In recent years, hot springs have become a focus for local development accompanying the boom of hot springs.
With regards to the present status of hot springs, the number of natural springs remains constant, whereas that of power-pump springs is on the increase. By temperature, the increase of spas with less than 42 is conspicuous. It is conceivable that the power pumping of spring water has increased as has the pumping from deeper layers.
The number of hot-spring users is dramatically increasing. The aggregate number of lodgings at hot springs in fiscal 1991 came to 142, 850,000, and there have been signs of a rise since fiscal 1984. Hot springs for use by the people are designated by the Director-General of the Environment Agency and moves are being made for their development. The increase in their utilization is conspicuous, showing a rise of 1.46 times for nearly 10 years from 1982 to 1991 (Fig. 1-2-17). The increase presumably reflects the people's desire to spend leisure time in nature.
Fig. 1-2-17 Trends in Number of Guests Using Hot Spring Lodging Facilities
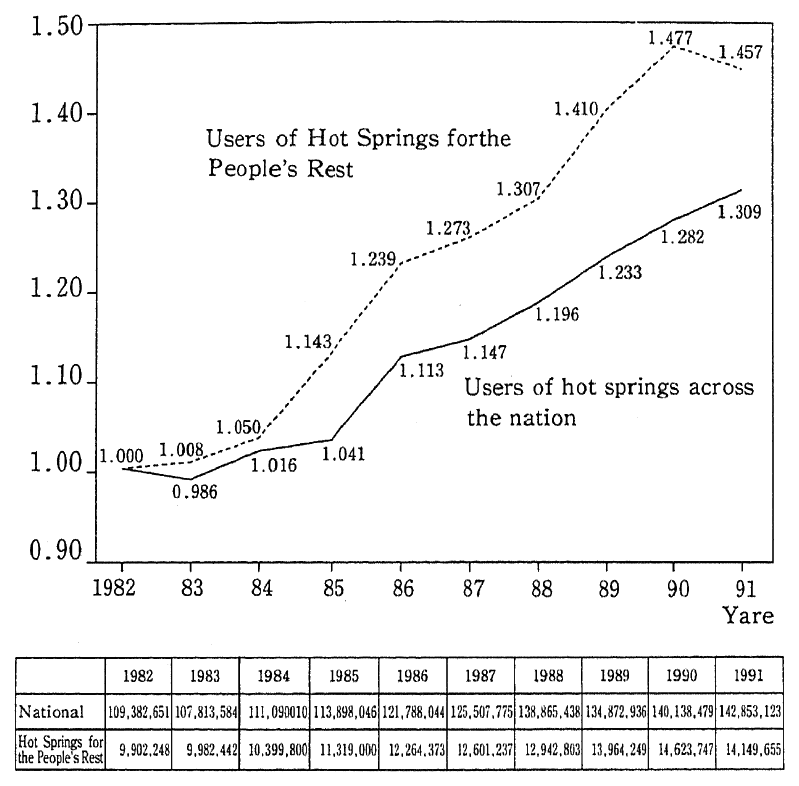
Note : The aggregate total of lodging users with 1982 at 1.
Source : Environment Agency
(2) Sea Bathing Beaches, Etc.
People have enjoyed sea and other bathing for summer recreation since the Meiji Era. In order to make beaches and other places suitable for bathing, there is the need to maintain the water quality and scenery. According to the survey conducted by the Environment Agency on the water quality of main bathing places, there are 411 main bathing places (including those along the rivers) where the water quality has been stable in recent years and there were no bathing places in need of improvement in fiscal 1991 and 1992.
(3) Waters of Renown
Of the clean nearby springs and rivers across the nation which have been indispensable for community residents' lives from old, the Environment Agency designated 100 places extending from Rijiri Island in the north to Okinawa in the south in the list of "100 Selected Waters of Renown." Communities have used water not just for drinking and irrigation purposes but for an enrichment of their everyday spiritual lives. The communities' rising interest in water is important in increas- ing the quality and broader scale of involvement, in activities for conservation of water quality.
(4) Starry Sky
Stars could be seen anywhere in the past, but the number of visible stars has decreased due to air pollution and the propagation of lights and neon lamps. The darkness of the starry sky is illustrated in Fig. 1-2-18, suggesting that stars have become less visible over urban areas, The blue sky and starry night form an important backdrop for our spiritual lives. In the hope that people will have a greater apprecia- tion of the sky and think about the impact of air pollution and lighting, the Environment Agency has conducted a Star Watching Network in the summer and winter of every year since fiscal 1988. Tn fiscal 1992, 247 organizations and 7,186 individuals participated in this project.
Fig. 1-2-18 Distribution of Brightness of Night Sky Over Japan
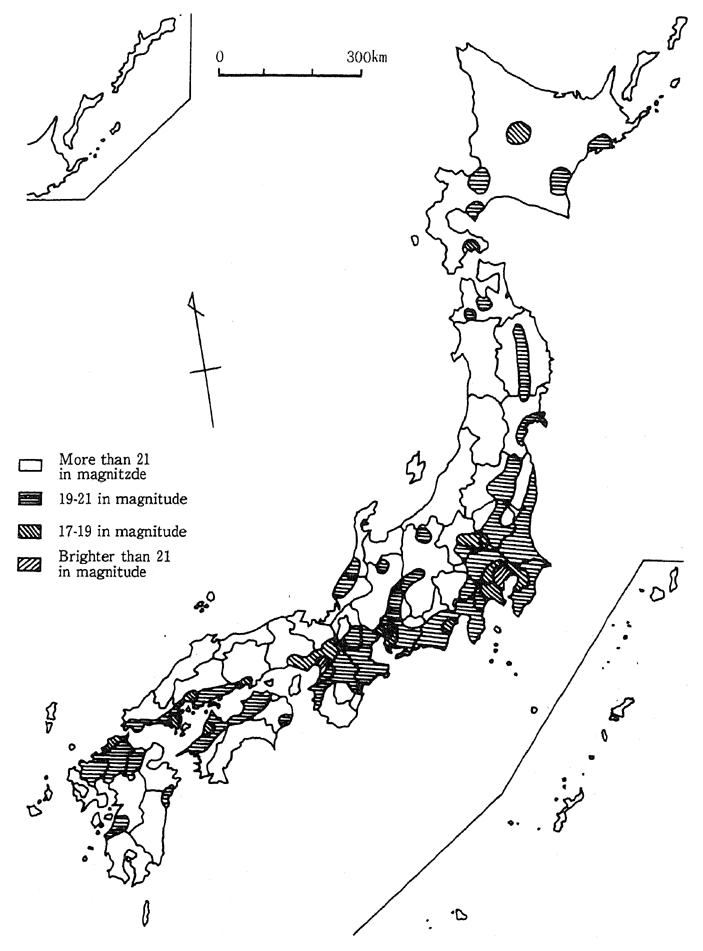
Note: Measured on the basis of the color photogfmphs taken at a total 289 points in eight star watching evets in the past.
Source: Environment Agency
(5) Big Trees and Forests
For a healthy living environment, scenery and wildlife habitat, bigt trees and forests including big trees have irreplaceable value in enriching our lives and nature. As part of the National Survey on the Natural Environment big the Agency carried out the survey of 55,798 of big trees with trunk periphery exceeding 3m at the height of human breast. By tree species, they came to the order of 13,681 Cryptomeria japonica 8,538 Zelkova serrata and 5,160 Cinnamomum camphora and nine out of the 10 top trees with trunk periphery were Cinnamomum camphora It was also found out that forests of shrine and temple play an important part for the growth of giant trees and that 30 % of big trees are made subjects of worship.
1-2-4 Present Status of Antarctic Natural Environment
In Madrid, Spain, in October 1991, the Treaty Parties of the Antarctic Treaty adopted the Protocol on Environmental Protection to the Antarctic Treaty The protocol provides for a new legal framework for the environmental protection of the Antarctic. In September 1992, Japan signed it, and efforts are under way for its ratification.. The following is an examination of, the present status of the Antarctic environment.
The Treaty applies to the area south of 60 South Latitude. The total area is 52.5 million km2, of which lands account for 14 million km2. The Antarctic continent measures 12.5 million km2. The average tempera- ture in the Antarctic is -50 degree C of the Antarctic continent, 98% is covered by land ice with the average thickness at 2,450m. In light of such a fragile environment and the restrictions imposed under the Antarctic Convention, human activities are confined to surveys and research.
In this severe Antarctic environment, there exist ecosystems. In the summertime, algae and other organisms inhabit lands which some- what appear between cakes of ice to form ecosystems. There are also birds which use Antarctic lands for their propagation. On the Antarctic continent, two seed-plant species are known. There are fungi, algae and moss. The birds which propagate on the Antarctic lands total 15 species, including penguins. No mammals are known to inhabit the lands, but six species of the seal family and 10 species of the whale family inhabit the Antarctic Ocean. One hundred species of sea birds, including 15 species which propagate on land, inhabit the Antarctic. The presence of fish and krill is also observed. These organisms form indigenous and invalu- able ecosystems in the harsh Antarctic environment.
Famous as a continent for science, the Antarctic is an invaluable place for research, such as meteorological observation and geophysics. As we have already seen, research on the disruption of the ozone layer are being stepped up, primarily in areas based in the Antarctic.
The Antarctic environment has been conserved by limiting human activities to scientific surveys under the Antarctic Treaty and additional measures, such as the Agreed Measures for the Conservation of Antarctic. Fauna and Flora In recent years, however, the number of tourists visiting the Antarctic has increased, coming to about 3,000 a year. The treatment of wastes from each country's Antarctic observa- tion base has posed an additional problem. Given those developments, the Protocol on Environmental Protection to the Antarctic Treaty was adopted on the basis of the Antarctic Treaty in October 1991 as a new framework for environmental protection of the Antarctic. It is stipulat- ed in the protocol that the Antarctic ought to be protected as a place for scientific observation and research, and as an invaluable natural envi- ronment and as the only continent which has not suffered the weight of human habitations.
Chapter 2. Close Relations of Society and Economy with Environment
Japan's society and economy have structurally changed, devel- oped and matured, subject though they have been to business ups and downs. A review of the last several decades suggests that Japan, placing its heavy and chemical industries on a solid basis from the 1950-64 period to the latter half of the 1965-74 period, economically matured at a rapid pace of 10% or so per year, but shifted to a phase of stable but lower growth with the oil shock in 1973 as a turning point. In the meantime, the nation had been ushered into a long period of flourishing business, triggered particularly by nongovernmental capital outlays and individual consumption, in 1987 until the latter half of 1991. The dimen- sions of many activities with impacts on the environment were part of the same trend as those economic developments in general. As we will see in Fig. 2-1-1, the volumes of energy consumption, trucking, lumber importation and other indices suggest that economic activities related to environmental loads generally remained stable after having rapidly risen until the second half of the 1965-74 period, and once again in or around 1986. As we have just seen, environmental loads are closely tied in with economic activities so that they cannot be considered separately.
Fig. 2-1-1 Trends in Economic Performances Closely Tied inwith Environment(with FY 1975 at 100)
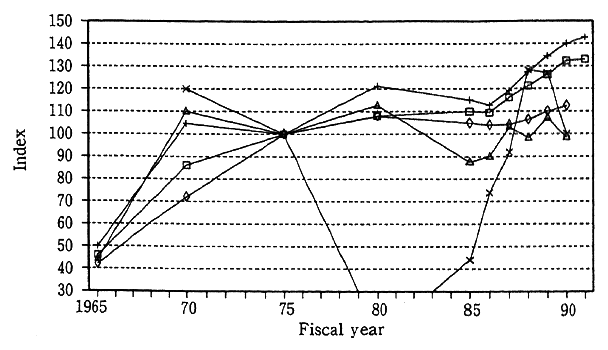
![]() Energy consumption + Trucking volume
Energy consumption + Trucking volume
![]() Quantity of industrial water
Quantity of industrial water ![]() Lumber imports
Lumber imports
![]() Area of forest areas converted into those for recreation
Area of forest areas converted into those for recreation
Notes
1 The value of the area of forest areas converted into those for recreation in FY 1970 is the mean for 1970-72.
2 The trucking volume is expressed in terms of transport tons.
Sources Totals on Comprehensive Energy, Trucking Statistics Year-book, Table of Industrial Statistics, Outline of Foreign Trade, White Paper on Land, etc.
The economy functions in an interdependent and organic manner by which people in different positions, businesses and so forth are linked with one another by means of business transactions. Let us see how they work in terms of an economic cycle of production, distribution and expenditure. Fig. 2-1-2 illustrates thoughts about Japan's economic cycle. As production permits the offer of goods and services, values -added are produced, on the one hand, and natural resources are col- lected, on the other, thereby leading to the appearance of a wide variety of wastes. In the next step, the values-added thus produced as a national income are distributed among businesses and the people in the forms of business surpluses and employees' incomes. The incomes thus distribut- ed are partly used for consumption and partly saved for investment (capital formation). In this process, throwaways and other wastes come out. The addition of intermediate consumption to consumption, invest- ment and exportation equals total demand for goods and services. In the long run, production and supply by importation are done in response to that total demand. Hence the creation of such an economic cycle.
As we have just seen, the economy is the fabric in which a wide variety of entities are interdependent in diverse activities so that certain activities alone could not be changed without regard to other activities. When environmental loads are taken into account, therefore, it would often be difficult to have an eye to performances of the sort which directly produce loads and try to restrict them alone. For an efficient cut in loads on the environment, there is the need to understand the background, while going back to the relations of the economic network, and come out with structural responses. In the following, let us see relations between economic activities, such as consumption, production and trade, and the environment.
Fig. 2-1-2 Circulation of Japanese Economy
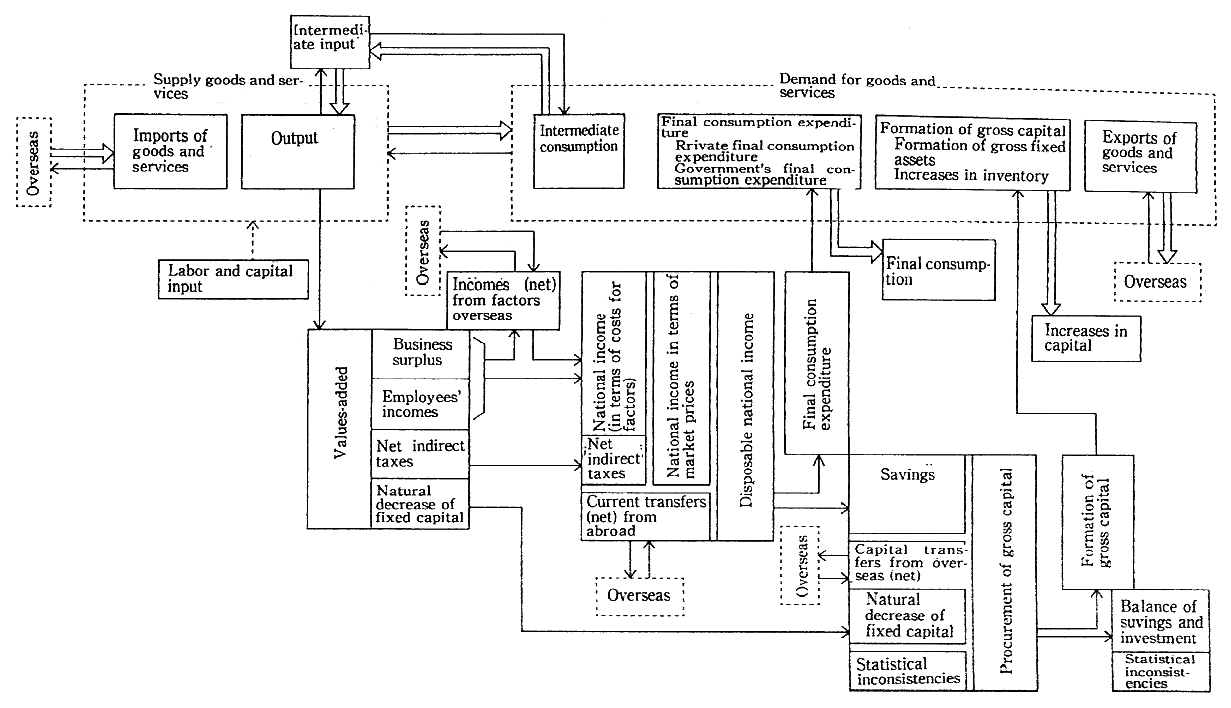
Note : "→" represents the disposition of services, etc., and "→" represents the disposition of incomes, etc.
Source: Extracted and simplified from the Economic Planning Agency's Yearbook of Computation of National Economy
2-1 Consumption and Environment
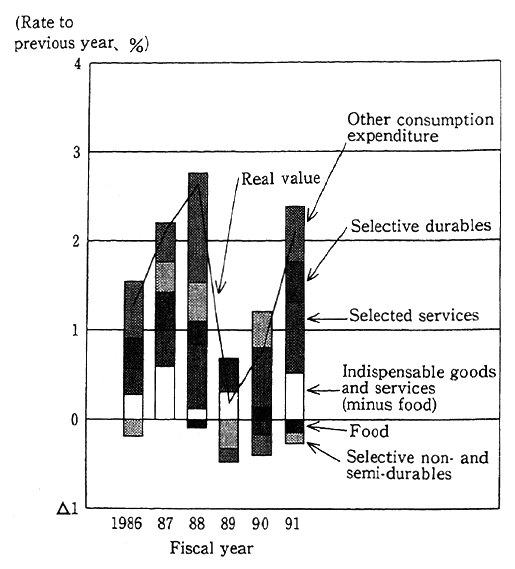
Our consumption activities have a significant share of the econ- omy as a whole. A check of the gross national expenditure, which indicates how Japan's economic activities is composed, suggests that the final household consumption expenditure accounted for about 50% of the gross national expenditure (fiscal 1991). As we have seen, this expenditure evokes production to satisfy demand. A review of the rate of contribution to the economic growth rate by demand also reveals that the contribution by individual consumption is generally stable and that fluctuations in the household consumption expenditure produce a signifi- cant impact on the economic parameters as a whole, including economic growth. An item-specific check of increases in household consumption suggests that in the several years before fiscal 1991, the increases in culture, entertainment and other selective services and autos and other selective durables remained at a relatively steady pace (Fig. 2-1-3). Thus the household consumption rise stimulated by changes in the conscious- ness of consumers, such as option for things better in quality and larger in size, has turned out to be a significant factor for a boost in production in Japan. This suggests that not only is the growth of household con- sumption tied in with a rise in the generation of wastes but that it also adds to the generation of wastes and the use of natural resources in conjunction with production.
Fig. 2-1-3 Goods- and Service-Specific Degree of Contribution of Real Consumption Expenditure
Remarks:
1. Prepared on the basis of the Management and coordination Agency's Household Budget Survey and Consumer Price Indices
2 Indispensable expenditure: Food (minus food eaten out in general), house and land rents, light and heat, tap water, health and medical care, commuter tickets, education (minus supplementary education)
Selective expenditure: food taken out in general, fccility repair and maintenance, furniture and goods for housekeeping chores, clothing and footwear, transport and communication (minus commuter tickets), supplementary education, culture and entertainment
3. Other consumption expenditure in made real with consumer price indices in the "integration excluding the reverted rents of owner houses," and the excess of shortage of in this conjunction is included in each item, depending on its weight.
Source : White Paper on Economics
Having said that, our everyday consumption constitutes an important component of economic activity and is closely tied in with the environment in the fabric of the economic network. In the following, let us see how consumer life is tied in with the environment, both directly and indirectly.
2-1-1 Direct and Indirect Loads Derived from Consumer Life
As environmental loads, those which are generated in conjunction with our everyday consumption are understandable, first in terms of waste water from kitchens, trash from households and nitrogen oxides and carbon dioxide generated by the use of autos. But these loads are not confined to the direct ones; a wide variety of loads are indirectly generated as we purchase various kinds of goods. In other words, the products purchased by consumers generate a variety of environmental loads in the process by which they are delivered to consumers after materials for them have been collected, processed and turned into what they are. It might be said that those loads are generated while the products are in demand by consumers. When the loads imposed on the environment by the consumer are considered, it is necessary to take into account those indirect impacts.
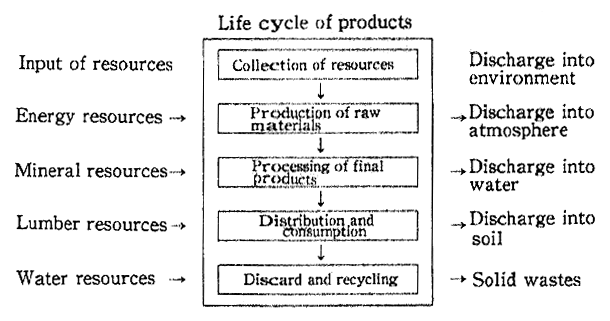
Attempt to make a quantitative assessment of the environmental loads brought about by a variety of consumer activities, the concept of the life cycle analysis (an assessment on degrees of amiableness to which merchandise is to the environment). The life cycle analysis is designed to quantitatively analyze and assess as much as possible the various environmental loads products bring about in their life cycle ranging from material gathering to production, distribution, consump- tion and disposal. The idea is to encourage producers to improve the production process and the designing of products, distributors to change the way in which they put goods on sale, and consumers to wisely opt for merchandise, thereby reducing environmental loads as a whole (Fig. 2-1-4)
Fig. 2-1-4 Concept of Life Cycle Analysis
Source : Prepared on the basis of SETAC's A Technical Framework for Life-Cycle Assessment
Let us take drink containers as an example. Beside the direct load which comes out as they are thrown away as wastes, there arise indirect loads. For example, in the case of glass containers, leftovers are generated as wastes when silicon, needed for their production, is mined. In the case of aluminum cans, loads on the air environment are caused by the massive use of energy in their refining; and in the ca e of pa r packs, water contamination loads are generated in the process of paper production. The loads of "returnable" glass Container on the atmo sphere are greater than "one-way" containers because the distances of forwarding are longer, but the generation of wastes are reduced to a significant extent. As we have just seen, a wide variety of loads come out in the processes leading to consumption, depending on the type of container. With the use of the life cycle analysis, data may be secured for a comprehensive assessment and analysis of tho loads (Fig. 2-1-5).
Fig. 2-1-5 Examples of Life Cycle Analysis in Japan
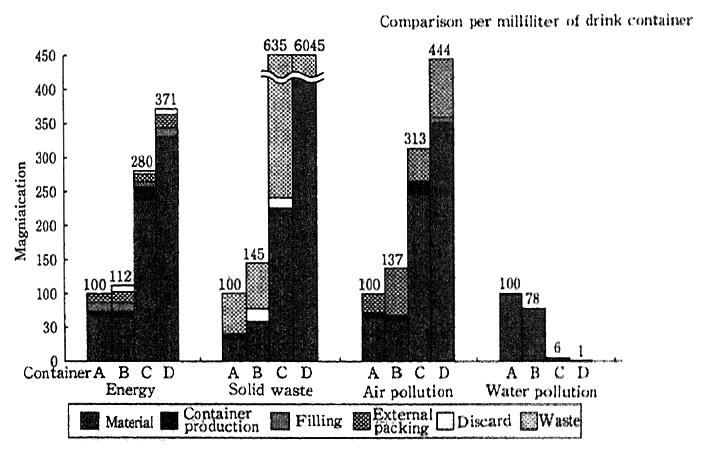
Note : The dimension of the environmental load of each container to that of the containers shown on the extreme left.
Source : Japan Eedaration of Livelihood Cooperative
The United States and other western countries are advancing studies on the life cycle analysis. A case in point is the Netherlands. With capital from the Environment Ministry, the Leiden University's environment science center has prepared a manual on a methodology for the life cycle analysis. In Switzerland, the Environment Bureau of the Federal I-Lame Ministry released data on methodologies for the life cycle analysis of containers and packing materials. Besides, studies are also under way in the United States, Sweden and Denmark, among others. In Japan, too, surveys and research on the life cycle analysis have become brisk in recent years. Under the Eco Mark system, for example, studies are under way for the incorporation of a comprehen- sive assessment of environmental loads as a condition for allowing the use of the Eco Mark. The Japan Federation of Livelihood Cooperatives is also stepping up surveys and research for application of the life cycle analysis to merchandise.
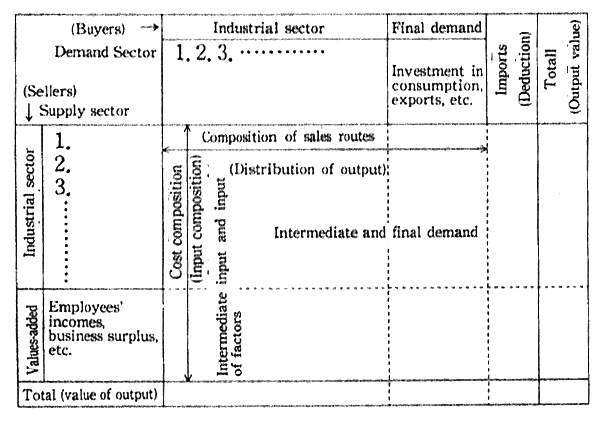
One way of assessing environmental loads, including those in- directly imposed, is use of the Leontief Table (Input-Outpit Table). In this system, an analysis is made in terms of the industrial sector, but not individual products as is the case with the life cycle analysis. The Leontief Table is a tool for a basic analysis in economics, and for an analysis of complex relations of interdependence between industrial sectors; the way in which what is produced in one industrial sector is used as an intermediate asset by yet another industrial sector is expres- sed in the form of a matrix (Fig. 2-1-6). Use of this table makes it possible to analyze the degree to which demand will rise for steel, machinery, mining, rubber goods and other industries, when demand for, say, autos, increases. In situations where data on the industry-specific generation of environmental loads is added to the Leontief Table between industries, it is possible to analyze the degree to which environ- mental loads will be induced in cases where the products or service offered by a certain industrial sector are consumed.
Fig. 2-1-6 Concept of Table Industrial Correlations
Source : Kenichi Miyazawa ed., Introduction to Industrial Correlation Analysis
Talking of analyses with the Leontief Table, studies are under way at the Keio University Industrial Research Institute on carbon dioxide, sulfur oxides and nitrogen oxides. The National Institute for Environmental Studies has embarked upon studies on water and other pollutants in addition to carbon dioxide.
In determining the degree to which consumer activities affect the environment, the areas in which the impact is felt are also important. When it comes to the issue of air pollution by nitrogen dioxide and other matter in major cities, the increase of auto trips in specific areas poses a grave issue with the concentration of population and so forth. As for the organic pollution of waters for public use, the inflow of household and industrial wastewater by the concentration of population and indus- trial facilities in limited areas has surpassed the natural purifying capacity of those areas, Thus, when relations between consumer activ- ities and the environment are taken into account, an analysis of the discharge of environmental loads alone would be insufficient; it is necessary to pay heed to the fact that the areawide distribution of concentrations is important.
When it comes to environmental loads by consumer activities, it is necessary to point out that loads on the natural environment through the use of natural resources and recreational activities are important
For a quantitative analysis of the degree to which environmental loads are generated by consumer activities and individual lifestyle, let us take a look at water and wastes, as well as the atmosphere.
2-1-2 Impacts on Atmosphere
With regard to the impact of everyday consumption on the atmosphere, let us see here the findings of projections the National Institute for Environmental Studies and other institute hay made on nitrogen oxides (NOx) and carbon dioxide (C02).
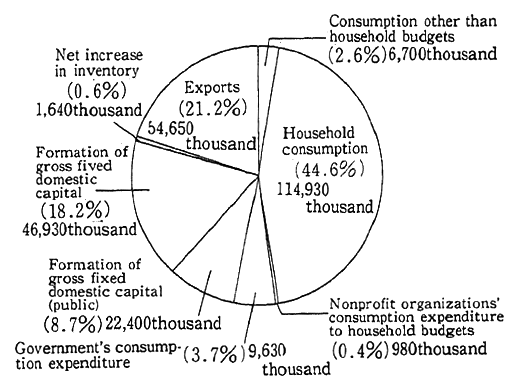
First, let us see how important household consumption is as a factor for the generation of environmental loads. The findings of a projection made by the National Institute for Environmental Studies with the Leontief Table for an environmental analysis suggest that the volume of carbon dioxide directly emitted by household consumption of energy in Japan in 1985 came to about 9% of the total emission, or 0.2 ton (in terms of carbon) a person. When it comes to the goods and services consumed by families in their everyday lives, their production and distribution entail carbon dioxide emissions. A projection of the total emission induced by consumption (hereinafter referred to as "in- duced emission"), or the addition of those indirect emissions to the direct ones, suggests that the total emission of carbon dioxide is as much as about 45%, or 0.95 ton (in terms of carbon) a person. In terms of (volume), this amounts to about 2,000 in equivalent to the cubic volume of four 25-meter-long swimming pools. Incidentally, the remain- der of the emission is induced in conjunction with private investments in plant and machinery, various governmental projects and activities, and exports (Fig. 2-1-7).
Fig. 2-1-7 Carbon Dioxide Emissions by Final Demand Sector (In Terms of Carbon, 1985)
Source : National Institute for Environmental Studies
Next, let us see the induced emission of carbon dioxide and nitrogen oxides per person a year and per ¥10,000 of household-budget consumption for each item of consumption (Fig. 2-1-8). The findings of a projection the Kejo University Industrial Research Institute has done recently with the Japan Environment Association using the Leotief Table suggest that the share of carbon dioxide through the consumption of electric power and gasoline is particularly great in terms of year- round consumption, followed by items associated with light and heat, such as kerosene, city gas and LPG. A check of individual items sug- gests that induced emissions from consumption for medical care, cloth- ing and eating and drinking establishments are relatively great. The induced emission per ¥10,000 of consumption is large for the items associated with gasoline, light and heat. Virtually identical trends may be observed on nitrogen oxides. This is merely an estimate; there is certainly room for further improvements in the analytical methodol- ogies, but it may serve as a yardstick in effectively determining what sorts of things should be restricted as we strive to reduce impacts on the environment in our consumer activities. It is hoped that such studies will pave the way for improvements in methodologies for surveys and analyses and that they will be further stepped up in various sectors.
FIg. 2-1-8 Emission of Induced Environmental Loads by Consumption Item
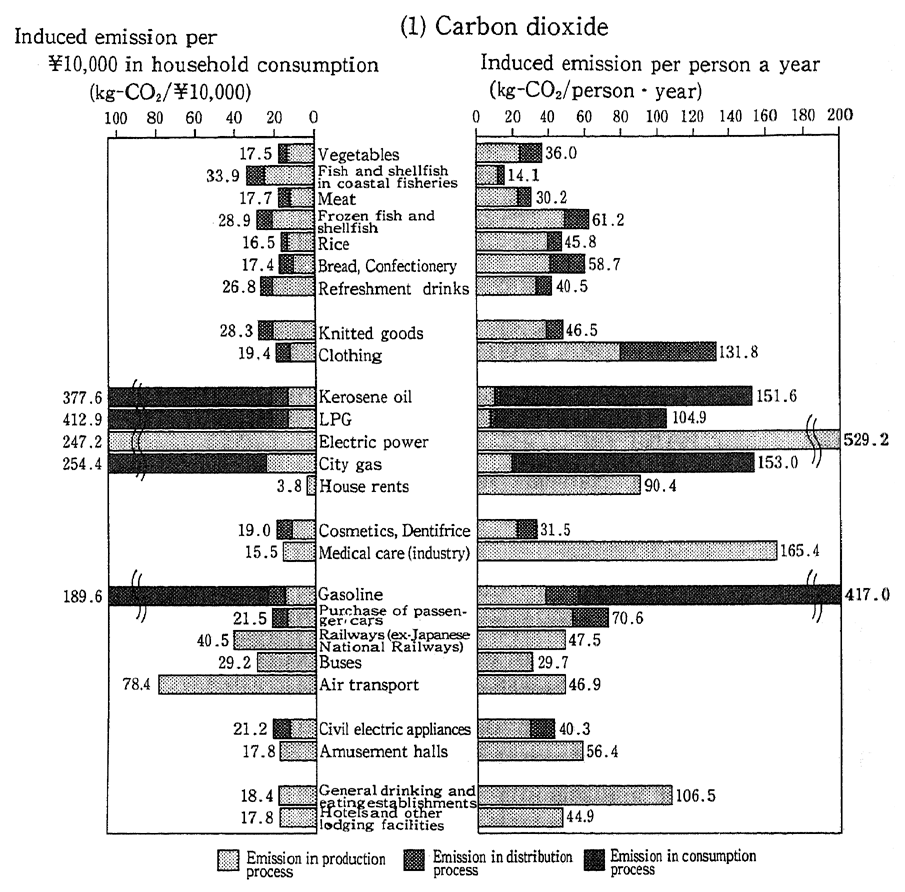
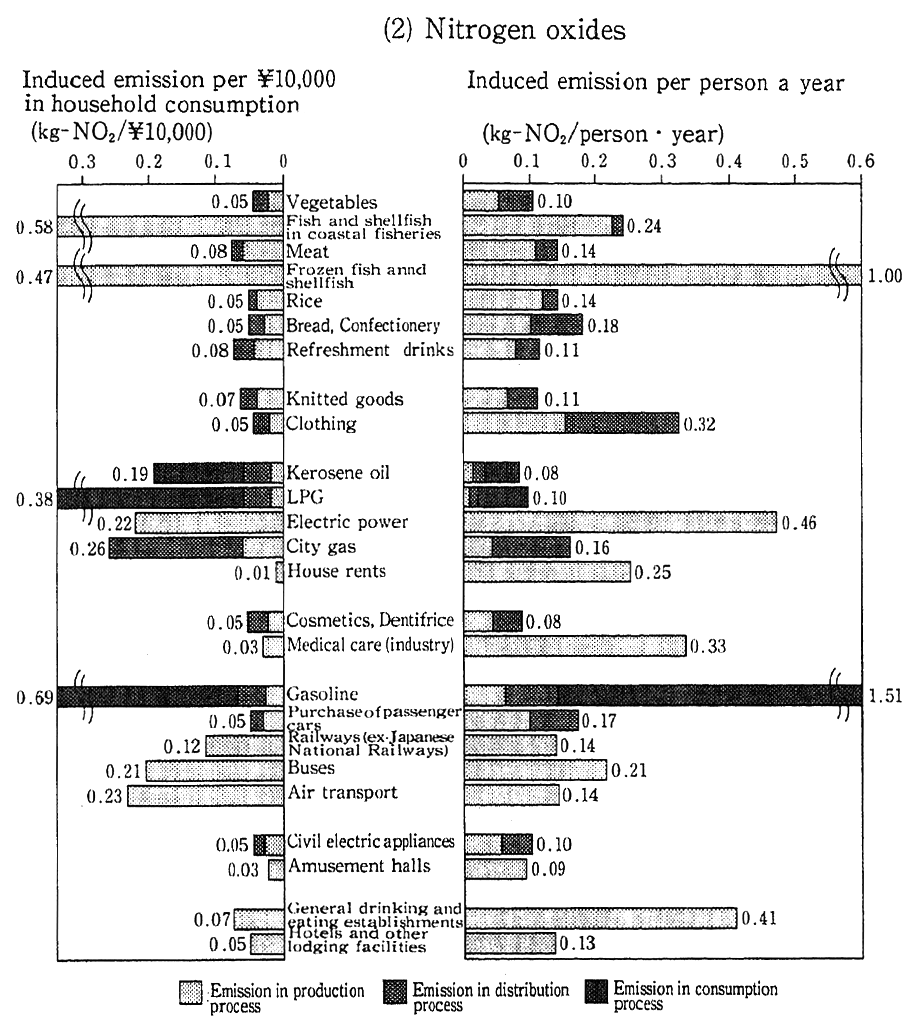
Source : Prepared on the basis of data from Kejo University's Industrial Research Institute
Notes :
1. From the sectors enumerated in the table of industrial correlations, those in which carbon dioxide or nitrogen oxide emissions are great are sampled.
2. The asterisked sectors are given names different from those in the table of industrial correlations to facilitate understanding, such as fish and shell- fish in coastal fisheries → coastal fisheries, meat → butchery, rice → grain production, electric power → power generation for business purposes, purchase of passenger cars → passenger cars, civil electric appliances → other electric appliances for civil use.
3. Electric appliances for civil use do not include washing machines, refrigerators and audio-visual equipment. The amusement halls are pinball parlors, billiards, etc.
4. The emission of carbon dioxide is expresed in terms of the volume of carbon dioxide. It may be converted into that of carbon by dividing it by 3.67.
As we have just seen, significant loads have been brought about on the atmospheric environment by everyday consumption. However, these loads may be reduced by changing consumer behavior. The National Institute for Environmental Studies projected the degrees to which carbon dioxide emissions may be reduced. The findings are given in Fig. 2-1-9. In this projection, the Institute computed hypothetical reductions with regard to 23 measures which could be taken to cut carbon dioxide emissions An attempt was made to estimate the extent to which emission cuts would be possible with measures taken by households as well. The results show that in situations where the actions, designated by respondents as "could take," were all taken, nationwide emission cuts would come to about 2% of the total emission, or about 6 million tons (in terms of carbon). If it is assumed that in cases where the actions respondents designated as "could more or less take" were all taken, nationwide emission reductions would amount to about 5% of the total emission, or about 15 million tons (in terms of carbon). Those findings imply that the emissions which could be reduced by families' actions would be considerably large. The projection was confined only to the 23 types of actions so that should other actions be included, the projected emission reductions would be far larger. A check of each action item reveals that the most effective items are those associated with the use of private autos, such as "consideration to the fuel consumption and displacement of autos" and "curbs on the use of owner autos." Other items cited as effective in the projection are the "building of houses with consideration given to adiabatic efficiency" and the "use of solar water boilers."
Fig. 2-1-9 Findings of Trial Computation of Reductions by Household Measures in Carbon Dioxide Emissions
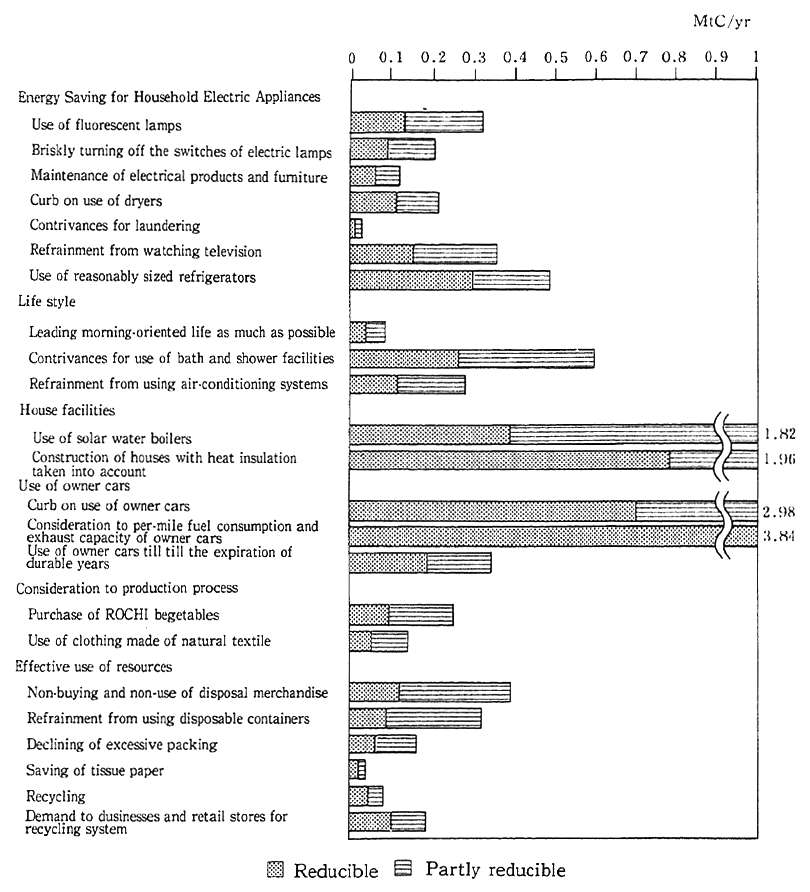
Note : The unit is 1 million tons per year (in terms of carbon)
2-1-3 Impacts on Water Quality
Next, let us examine the impacts brought about on water quality by consumer behavior. In everyday consumption, household effluents come out from kitchens, bathtubs and laundering. As regards the water quality in Japan, the pollution caused by heavy metals and other hazard- ous matter, as was the case with the nation's high economic growth phase, has been improved. However, at present, organic pollution is at issue. When it comes to such problems, there are many cases in which the loads of household effluents have a significant share. When we look at Teganuma and Kasumigaura, for example, we will come to realize that as indicated in Fig. 4-1-6 in 3, Section 3, Chapter 4, the impact share from domestic wastewater in the chemical oxygen demand (COD) of all waters are high with 76% and 44%, respectively.
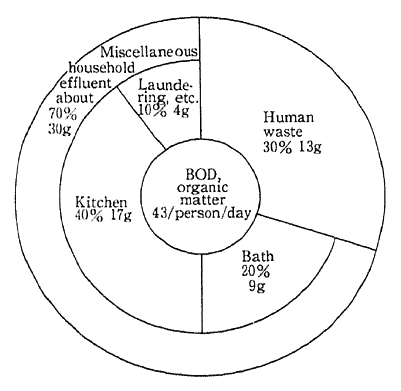
Let us see the degrees to which pollutant loads are produced on the water quality by everyday life (Fig. 2-1-10). The pollutant load directly generated from the life of one person a day is 43 g in terms of the biochemical oxygen demand (BOD). In terms of the consumption of household water, 325 liters of wastewater with BOD at 132 mg/1 generated per person per day. In order to dilute it so that fish may survive (BOD 5 mg/1), there will be a need for enough water to fill up 28 bathtubs according to this report. Here, raw sewage accounts for 30%, and other household effluents 70 %. A legal ban is put on the discharge of raw sewage directly into the environment and its hygienic treatment is obligatory, so that when it comes to the actual pollutant loads discharged directly into the environment from households, those of miscellaneous household effluents are great. Of all types of miscellane- ous household effluents, loads from kitchens represent the greatest share, followed by bathing and laundering.
Fig. 2-1-10 Rate of Generation of Environmental Loads (BOD) by Water Pollution Per Person a Day
Source : Environment Agency
These represent the volume of pollutant loads generated directly from everyday life, and where a wide variety of products are consumed by households, such as paper and processed food, loads on the water quality are generated in the form of industrial wastewater. This waste- water, too, may be regarded as having been imposed in conjunction with consumer lifestyle, and, if included, the total volume of loads on the water quality will become far greater.
2-1-4 Wastes
As with the environmental loads associated with consumers' everyday lives, wastes are also important. Generated by households, garbage is collected and disposed of by municipalities, generating a wide variety of environmental loads, such as carbon dioxide, nitrogen oxides and other chemicals, erosion by landfills and effluents from final dis- posal plants.
The discharge of garbage per person per day was 1,120 g (in fiscal 1990), and is on the upswing in recent years. Of this, only 37g is turned over for recycling. The rest goes through incinerators and other inter- mediate processing systems and is eventually discharged into the natu- ral environment in the form of landfills or smoke from incineration. The volume of garbage moved for landfills as a means of final disposal amounts to 373g per person per day, suggesting that about 33% of the volume of things put out as trash is reclaimed.
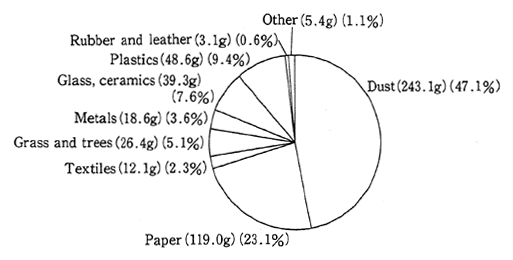
The values include those of trash thrown away by offices and other business establishments. Let us take Tokyo as an example to see the way domestic garbage alone is discharged. In Tokyo, garbage comes out at a rate of 515 g per person per day. Broken down, raw kitchen garbage is greatest in volume, accounting for 70% of the total (Fig. 2-1-11). In terms of environmental loads, however, glass, ceramics and other things unsuitable for incineration may represent a small propor- tion of total solid wastes, but remain significant insofar as they require disposal in landfill areas.
Fig. 2-1-11 Emission of Waste per Person a Day (Tokyo's General Households)
Source : Prepared on the basis of data from the Cleaning Dureau, Tokyo Metropolitan Bureau.
2-1-5 Consumer Obligations to the Environment
As we have seen, consumer life is closely tied in with the environ- ment, and that the loads directly generated from everyday life alone are striking, particularly when it comes to the question of water pollution. Moreover, when the loads indirectly imposed by consumer activities are taken into account, it turns out that the loads brought about on the environment by consumer life are far greater.
It is broadly accepted that consumer life produces significant impacts on the environment. A survey which was designed to check and see the degrees to which respondents thought their everyday lives were affecting the environment suggests that 38.3 % felt they were producing "significant impacts." When those who described them as "more or less" are included, it follows that nearly 90% thought that their own everyday lives were affecting the environment (Fig. 2-1-12).
Fig. 2-1-12 Consciousness About Impacts of Everyday Life on Environment
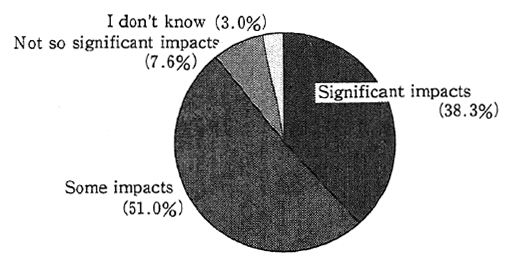
Note : Replies to the question of "to what extent do you think your everyday life affects the domestic environment and, further, the global environment?"
Source : Opinion Poll on Envitonmental Conservation, 1993
On the basis of this awareness, as will be detailed in Section 2, Chapter 4, a wide variety of measures have been taken to reduce environmental loads tied in with the consumer life. The measures were begun long before for the sectors associated with domestic effluents --the sectors where the impacts on the environment from the everyday life are significant. For example, Shiga Prefecture, where Lake Biwa is situated, began in the first half of the 1975-84 period to reduce loads from household effluents by taking another look at the way in which detergents were used.
In recent years, measures have been taken with wider-area and longer-period environmental impacts in mind. The examples include, among others, attempts to reduce the weight of trash by avoiding disposable products, by promoting recycling through group trash collec- tion, reviewing the ways in which private autos are used as well as ways of saving energy in the family life, among others. These approaches were prompted by the two oil shocks since 1973. Though many of them were started with attention towards energy saving, the l985-94 decade marked a shift to greater interest in reducing environmental burdens.
Moreover, efforts are being made to reduce environmental loads which are generated in the production process by having consumers carefully choose products with care. As we have seen, environmental loads in the production process might be described as having been generated with goods and services purchased by consumers at cost. Given this factor, impacts may be reduced by changing the volume and type of goods or services consumers purchase.
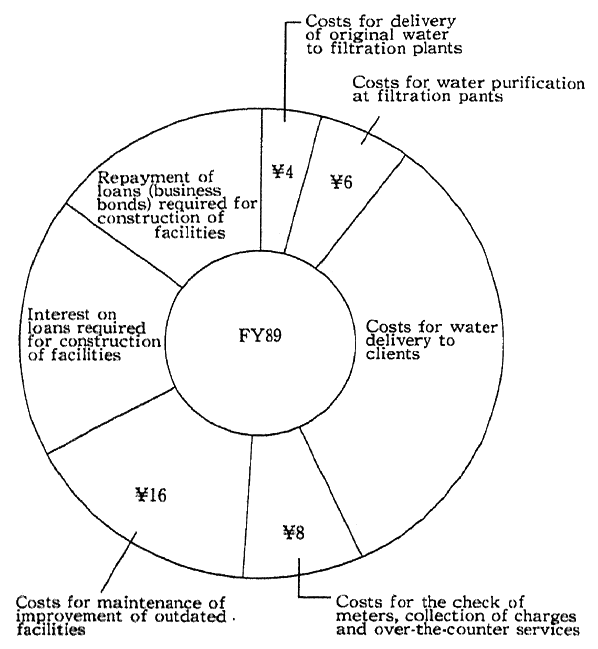
Here, let us think about what consumers spend for goods and services. The values as referred to here may be looked upon as payment for the total benefit by adding a profit to the various costs needed for production of the goods and services. A case in point is the the Tokyo Metropolitan Government's tap water service in which the ways tap water dues are laid out are clear. As you will see in Fig. 2-1-13, the money paid by consumers will be used to compensate for the various costs covering the supply of tap water to households. In plain language, they are turned into funds for the construction of catchment, purifica- tion and delivery facilities and, moreover, as funds for electric power needed for the operation of those facilities, chemicals and manpower, among others.
Fig. 2-1-13 Use of ¥100 Tap Water Charge
Source : Tokyo Metropolitan Government's Water Bureau, Tap Water Service Handbook, Data Section, 1991
As we will see from the case of everyday water gushing out of the faucet, there lie enormous industrial activities against the backdrop of the prices of goods and services, and the cost in each phase of industrial activity includes what is needed for measures to cut back environmental loads. In situations where those measures prove costlier than at present, then, prices will increase. Hence, it is necessary for consumers to pay heed to environmental measures, instead of recklessly looking for cheaper goods, and realize that prices will more or less go up when consideration is given to environmental measures. Particularly in situa- tions where prevention is emphasized, the merchandise will turn out to be costlier than other merchandise. It is important, nevertheless, to promote such measures. Nowadays, the notion is increasingly widen spread that by positively opting for products with less loads on the environment, influence will be exerted on producers to convert the economy as a whole into one with less loads on the environment
As we have seen, the environmental loads which arise out of consumer activities have a large share in the volume of all environmen- tal loads, if indirectly imposed ones are included. This is evidence that consumers have important obligations to the environment, and that the loads which could be reduced changes in consumers' behavior are significant.
2-2 Production and Environment
In Section 1, we have examined relations between the consumer life and the environment. Production activities are also closely tied in with the environment. In this section, transportation, communications and services are defined as production activities in a broad sense, so from this perspective, let us examine relations between production and the environment. As we have seen at the outset of this chapter, new goods and services by processing raw materials and other inputs. Production activities play an important role, partly because the values- added will be tied in with the national income. Yet in another respect, natural resources are collected and wastes discharged adversely impact- ing the environment.
Manufactured goods and services are purchased by consumers and eventually consumed in households and other places. Even in the final phase of consumption, environmental loads are generated, depend- ing characteristics of produced goods and other factors.
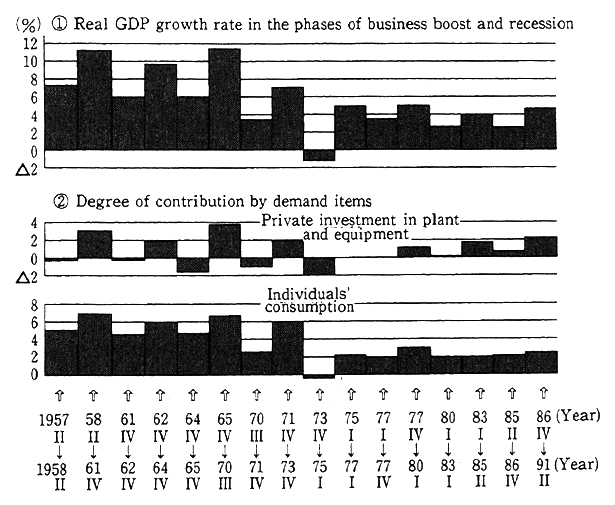
Taking charge of production activities, businesses invest in plant and machinery for the maintenance and expansion of production activ- ities. Investment, one part of total demand, stimulates additional pro- duction. When we take a look at this effect in terms of relations between nongovernmental investments in plant and machinery and the economic growth rate, we realize that nongovernmental investments, greatly contribute to economic growth. Can be seen in (Fig. 2-2-1). Thus, a production activity stimulates yet another production activity and generates additional environmental loads.
Fig. 2-2-1 Circulation of Growth Rate and Degree of Contribution by Demand Items
Source : White Paper on Economics
On the other hand, some production activities not only put loads on the environment but make the loads smaller than usual and relatively improve the environment. For example, the production of equipment for pollution prevention, the development of the natural environment and the production and offer of merchandise and services more "amiable to the environment" than other merchandise. The projects designed to conserve the environment include what is generally known as the "eco-business" (Table 2-2-1). In the one hand, environmental measures in production activities will be a minus factor for the economy due to a rise in the corporate cost, but on the other, a plus factor as they increase the demand for environmental conservation-related products. The impacts on economic growth can be approximated by calculating pluses and minuses, but judging from the strict environmental measures which Japan has introduced, we come to realize that the outcomes of environ- mental measures are not necessarily a minus factor. Rather, it might be said that economic growth will merely change in content as a result of environmental conservation, thereby making it possible to develop a sound economy in the long run.
Table 2-2-1 Examples of Corporate Performances for Enviromnental Conservation ("Eco-business")
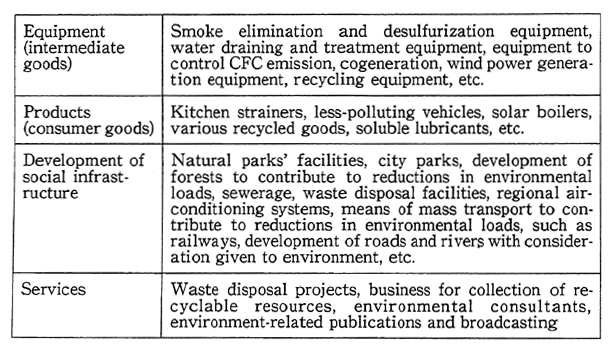
Note : The environment-related corporate performances are so broad and diverse that the above table is a simply one example about their development.
Thus, production activities are tied in with the environment in various ways, both in terms of the long and short runs. In the following, let us examine those relations with attention focused on the environmen- tal loads which come out in production activities.
2-2-1 Importance of Environmental Loads Arising from Production Activities
In the phase of high economic growth, Japan experienced severe environmental pollution oftentimes creating health hazards, as re- presented by Minamata Disease and Yokkaichi Asthma. Those cases of environmental pollution stemmed from smoke and wastewater from production activities. The task was to reduce pollutants arising out of production activities in those years.
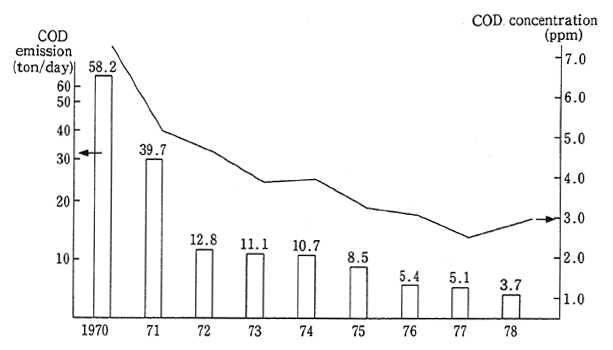
Given this situation, the Government began in the 1965-74 period to take measures, such as the formulation of environmental quality standards and the enforcement of controls on emissions. In response to those moves, businesses also stepped up measures, such as the develop- ment of technologies, investments for the prevention of environmental pollution and changes in the production process. The consequence is that the emission of pollutants from production activities has decrease. Fig. 2-2-2 shows trends in the chemical oxygen demand (COD) of a certain steel plant and in the water pollution of the surrounding environment. It is discernible from this figure that environmental pollution has been significantly improved in proportion to a drop in emissions from the factory.
Fig. 2-2-2 Trends in Emission of Water Pollutants (Pollution Volume Expressed in Terms of COD) from Certain Ironworks and in Water Pollution (COD Concentration) of Sea off Ironworks
Source : The Foundation for Earth Environment, Chikyu Kankyo Kenkyu (Studies on Global Environment No. 23)
Fig. 2-2-3 Rates of Generation Sources of Various Environmental LoadsNotes:
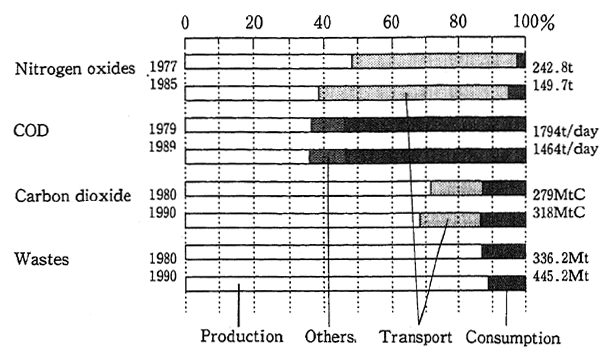
1. "Transport" includes that which is associated with production activities and consumer performances.
2. "Others" includes loads from agricluture and mountain forests, among others.
3. The totals of nitrogen oxides and COD are those of areawide ttotal pollutant control areas, and those of carbon dioxide and wastes are national.
4. Carbon dioxide in the converted sectors is classified in "Production" here, and industrial wastes in the incineration of wastes are classified in "production" and general wastes in "consumption."
5. "Consumption" of nitrogen oxides includes those emitted from small-scale business establishments.
6. Human wastes are excluded from "Wastes" here. Environ-mental loads by wastes are affected by the properties of wastes and the rates at which they are recycled, among others. For instance, it is necessary to note that whereas the rate at which general wastes are recycled into resources is 3.4%, the rate at which industrial wastes are recycled and used reaches 41%
Source : Prepared on the basis of data from the Environment Agency, Disposal of Wastes in Japan by the Ministry of Health and Welfare, etc.
Thus, industrial pollution which stems from production activities has been increasingly improved, but a check of the environmental issues posed today is sufficient to realize that production activities remain an important source of pollution. Fig. 2-2-3 indicates the rates of loads by source in regard to various discharges of wastes. National totals are given for carbon dioxide and solid wastes, whereas area totals under the areawide pollutant load control system are given. The figure shows that environmental loads coming out of production activities account for 40% to a little less than 90%, depending on the type of loads.
When it comes to pollution problems in the nation, improvements have yet to be stepped up for nitrogen oxides and other chemicals in major urban areas as well as the organic pollution of public waters. In those issues, a relatively significant role is played by the loads associat- ed with households, such as exhaust gas from autos and household effluents. Pollution of this type is called pollution of the urban and residential type. Even in those issues, the emission of pollutants from production activities constitutes one of the major causative factors.
When we look at Fig. 2-2-3 by type of environmental load, we realize that in regard to pollution by nitrogen oxides, the rate of generation from factories has been on the decrease, albeit still at about 39% in 1985. Almost all emissions from transportation, which account for about 55%, are from autos. However, as you will see from the example of Tokyo in Fig. 2-2-4, most of those emissions are tied in with business activities, including trucking, and may be described as having caused by production activities in a broad sense.
Fig. 2-2-4 Breakdown of Automotive Exhaust Gas Emissions in Tokyo's 23 Wards in FY 1985

Source : Environment Agency
Let us turn to water pollution. In the total chemical oxygen demand (COD) of the areawide total pollutant load control regions (the Bay of Tokyo, the Bay of Ise and the Seto Inland Sea), the rate of loads by industrial wastewater is about 36%. The 10% or so described as representing others includes the rate of pollutant loads from agriculture which, too, stems from production activities.
Besides, the emissions of carbon dioxide and wastes, among others, reveal that the rate of emissions from production activities is great, higher than those of nitrogen oxides and COD.
Let us take up carbon dioxide, next. When those in which include emissions from the industrial and energy-conversion sectors and inciner- ated industrial wastes, among others, are looked upon as emissions from production activities, they account for about 69% of the total emission. Moreover, when it is taken into account that some of the emissions from traffic (the transport sector) are primarily from trucks used in corpo- rate activities, it follows that emissions from production activities in a broad sense will have a far greater share.
In the output of wastes, the share of industrial wastes (excluding raw sewage) has come to be as high as about 89%. As is the case with carbon dioxide, general wastes which are described as having come from consumption include trash from business offices, and when output from all production-related activities is taken into consideration, the rate will become even greater. Nonetheless, the loads brought about by wastes depend on their properties of wastes and the rate at which they are recycled, among others. For example, the rate at which general wastes are recycled is 3.4%, whereas the rate at which industrial wastes are recycled stands at 41%. This is something to which attention ought to be paid.
When it comes to loads on the natural environment in conjunction with the utilization of natural resources, on the other hand, there has been concern in recent years about the disruption of nature by develop- ment projects in the midst of a resort boom. As regards golf links, the number of which is on the upswing, there is concern about impacts on nature, such as changes in the topography and vegetation of broader areas and in ecosystems, including wildlife, and natural scenery.
Thus, even though the pollution of the past has been mitigated, great environmental loads are generated by production activities.
The places where pollution is generated is also important. For example, the concentration of factories is one factor for industrial air and water pollution, which has turned out to be a serious issue in industrial belts. The pollution of major urban areas by nitrogen oxides is caused by rises in the traffic volume in major urban areas, and in the growing availability of diesel autos, offset the controls on the exhaust gas of individual autos. Therefore, an analysis of the output of environ- mental loads alone is inadequate, and it is to be noted that district distribution, such as degrees of concentration, is also important.
2-2-2 Dimensions of Environmental Loads Generated from Individual Production Activities
Fig. 2-2-5 Sector-Specific Intensity of Carbon Dioxide Emissions in Industrial Correlations Analysis

Note : In tons (in terms of carbon)
Source : National Institute for Environmental Studies
Next, in order to take a look at relations between production activities and the environment in a more tangible form, let us see how big the loads generated in each production activity are. Fig. 2-2-5 illus- trates the findings of an analysis done by the National Institute for Environmental Studies of carbon dioxide emissions by each sector of production activity with the use of the Leontief Table. In the analysis, a comparison is made of three different types of values--the amount of carbon dioxide directly emitted from each sector per 1 million in production value (hereinafter referred to as the "direct emission inten- sity per production value"), the amount of carbon dioxide directly emitted from each sector for the creation of 1 million in terms of values-added (hereinafter referred to as the "direct emission intensity") and the total amount of directly and indirectly emitted carbon dioxide, including those in the production of raw materials and other phases for the production of things worth ¥1 million (hereinafter referred to as the "induced emission intensity per production value"). In the Leontief Table, sectors are classified with attention paid to activities but not to businesses. For example, there are activities which are classified into different sectors, though the actual production process is consistent, to take note of some variations within the industrial classifications.
The findings reveal that the amount of carbon dioxide emitted for the production of things identical in value greatly varies, depending on the type of production activity. The direct emission intensity per production value is greatest for the supply of electric power, gas and heat, followed by iron and steel, transportation, ceramics, earth and rocks, and oil and coal products. among others. In broad terms, the intensity of emissions from activities in the sectors of energy supply, basic materials and transportation is high. As regards the direct emis- sion intensity per value-added, there are signs of an expansion in the difference between sectors with a high emission intensity and those with a low emission intensity. Nonetheless, the goods and services produced from activities with a high direct emission intensity are consumed in other activities for raw materials and other purposes. With this in mind, a check of the induced emission intensity per production value, taken into account with the inclusion of the production process for raw materials and so forth, reveals that output in the production activities of the processing type of manufacturing industry and the tertiary industry is great.
Environmental loads come in a broad variety ranging from those from air and water pollutants to those on the natural environment, and relations between production activities and the amounts of loads gener- ated naturally vary, depending on the type of load, according to the findings of the aforementioned analysis. As the amount of loads generat- ed depends on the type of production activity, the possibility of reducing loads as a whole is great if, first, the attempts are made in sectors where the generation is significant. Nonetheless, production activities are not independent. They are interrelated, so that a reduction in the total volume of loads, efforts are required not only in sectors where loads are directly emitted but also in sectors where emissions are indirectly induced through the consumption of raw materials and so forth. The encouragement of such comprehensive measures will eventually lead to environmental protection with economic efficiency given consideration.
2-2-3 Effects on Production Activities of Environmental Loads Generated from Consumer Activities
We have up to now examined environmental loads directly generated from production activities. Next, let us examine relations between the loads generated from consumer activities and production activities. In Section 1, explanations have been given about environmen- tal loads induced by consumer activities in some respects, identifying the need for consumers to pay heed to the impalts generated in the production and other phases. Yet in another respect, environmental loads generated from consumer life, conversely, may be powerfully affected by the way in which production activities are carried out.
In consumer activities, diverse environmental loads are directly generated in conjunction with the consumption of various products and services, but it is consumers who are described as having the right to make a final decision on whether they are to choose what products and services to consume. Nevertheless, the scope of choice for products and services is confined to the range of products and services available on the market. Besides, decision-making on the part of consumers is swayed by ads and so forth. In this context, it might be said that production activities are closely tied in with the loads directly emitted from consumer activities.
For example, the various household electric appliances thrown away as trash by consumers are an issue as they are difficult to dispose of. One of the reasons for the difficulty is that they are produced in configurations in which disassembling and recycling are difficult. Car- bon dioxide, nitrogen oxides and other loads are generated as con- sumers ride cars. In not a small proportion, the generation of carbon dioxide is determined by the volume of fuel consumption and other features of cars. Moreover, what features consumer opt for in new cars is swayed by advertising and the way in which cars are offered in the stores. As is the case with disposable containers and packing materials made of plastics and other materials difficult to treat, products made of difficult to recycle compound materials, such as laminate paper, and products made of virgin resources, including pulp products, are cases in which products with great loads are consumed even when substitutes with less loads are available. One reason is because consumers select thinks with importance attached to advantages irrelevant to the envi- ronment, such as convenience and appearance. Such products are broad- ly manufactured and offered in a manner ready to catch the eyes of consumers.
The loads directly emitted from consumer activities are also closely tied in with production activities, giving rise to calls for pro- ducers to share the responsibility for reducing environmental loads by gaining the cooperation from consumers.
2-2-4 Efforts to Reduce Environmental Loads from Production Activities
(1) Impediments to Measures for Cuts in Environmental Loads
As we have seen, production activities give rise to various forms of loads on the environment, producing calls for further reductions. Those measures naturally cost individual businesses one way or another, but the measures have to be stepped up, now that the social benefits are greater than the costs as society as a whole benefits from the prevention of environmental degradation.
Nevertheless, producers are now placed in the midst of free competition in. a market economy. This makes the enforcement of measures by individual businesses extremely difficult, because of con- cern about a rise in costs and a drop in competitiveness and profit In past examples, the primary reason businesses cited for the strengthen- ing of environmental measures was the imposition of regulations not the introduction of technology nor changes in the production proc Unless a common social cost framework is present, it will be difficult for individual businesses to agree to measures (Fig. 2-2-6).
Thus, if the enterprises engaged in production behave according to the principles of market competition, they would be unable to take measures for fear of corporate losses, and losses for society as a whole would increase. Therefore, in order to secure benefits for society as a whole, it is important to prepare a social framework to see that the businesses which implement measures alone will not sustain economic losses. In the preparation of such a framework, it goes without saying that there is the need to pay full heed to the polluter pays principle (PPP), the cardinal principle of environmental policy. The principles are what has been internationally agreed upon from a, perspective of attain- ing the optimization of resource distribution and avoiding distortions in international trade. The accord declares, "The costs for the prevention of environmental pollution should be paid by polluters. In other words, those costs should be reflected on the costs for goods and services which give rise to pollution in the processes of production and consumption."
It is hoped that individual businesses, too, will actively participate in the preparation of such a framework and is implement as many voluntary measures as possible, instead of beating a retreat from measures in pursuit of individual profits.
Fig. 2-2-6 Motives for Investment in Pollution Prevention
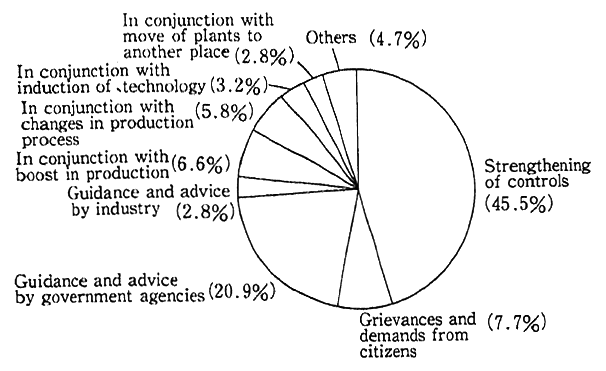
Note : Findings of a questionnaire survey on 2,087 manufacturing plants in Tokyo
Source : Prepared from the Tokyo Metropolitan Research Institute for Environmental Protection's Fact-Finding Survey on Investment in Pollution Prevention, 1990.
(2) Increasingly Rapid Voluntary Approaches
In Japan's production activities, various efforts have been made for the prevention of industrial pollution based on the bitter experiences with pollution in the past and in response to the government's controls on emissions and so forth. As a result, Japan has become the most advanced of all nations in measures against pollution, and when it comes to specific pollutants, or transient pollution, there has been considerable improvement.
The environmental issues posed today are interrelated, the impacts of which remain over a longer period of time and expand over broader geographical area. Therefore, the phase has corn{ when thin cannot be quickly restored to their original state. In the midst of this situation, producers are urged not only to abide by the emission stan- dards formulated for each substance from a standpoint of preventing direct health hazards but to voluntarily cut back all the environmental loads generated by business activities.
Entrepreneurs are cognizant of relations between their own activities and the environment. The findings of a survey on the con- sciousness of entrepreneurs by the Tokyo Chamber of Commerce and Industry suggest that 15.7% of the respondents think their corporate activities are "very much related" to environmental issues and 45.6% see "considerable relations," suggesting that more than half of the entrepreneurs are aware of relations with the environment. The rates of cognizance is high particularly in the construction, transportation, communications and manufacturing industries. (Fig. 2-2-7)
Fig.2-2-7 Entrepreneurs' Consciousness About Relations Between Corporate Performances and Environmental Problems
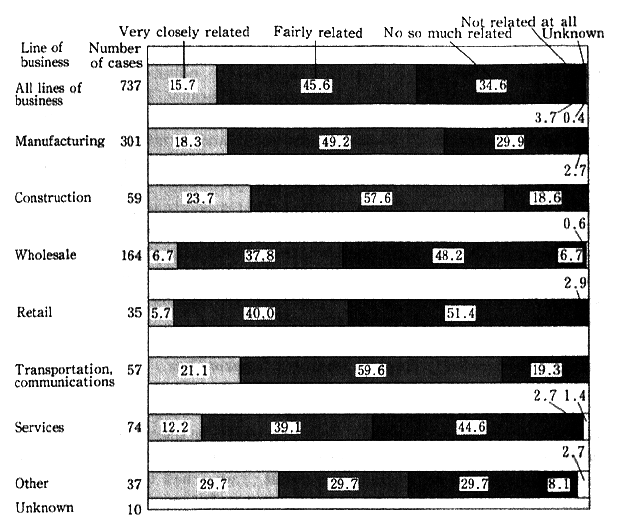
Source : Tokyo Chamber of Commerce and Industry, Findings of Survey on Entrepreneurs' Consciousness About Environmental Problems
On the basis of this cognizance and in response to the rising consciousness of consumers, entrepreneurs have voluntarily begun efforts to reduce environmental loads in conjunction with their own corporate activities, as will be detailed in Section 2, Chapter 4.
For example, efforts are being made to develop a system to work for environmental conservation, such as by establishing in-house divi- sions to take charge of environmental conservation and formulating a basic policy on the environment. As a means to reduce environment loads tied in with their own activities, efforts are also being made to set targets for the reduction of specific environmental loads and to carry out inspections from an environmental perspective in order to come to comprehensive grips with how big the loads brought about by their corporate activities on the environment are.
There have also appeared voluntary moves to cut back loads, including the closing down of businesses. The Global Environment Charter of Keidanren formulated in 1991 by the Federation of Economic Organizations (Keidanren) declares: "In the phase where products and so forth are researched, developed and designed, consideration will be given so that environmental loads may be reduced as much as possible in the phases where the products and so forth are produced, distributed, reasonably used and discarded." In line with this notion, Japan has followed Western countries in starting efforts, such as by making a life cycle analysis designed to see how large the environmental loads brought about by their own products are in the phases of production, distribution, consumption and disposal.
Having said that, it is expected that voluntary efforts will be further stepped up with all the corporate activities-related environmen- tal loads in mind, and that those efforts will lead to reductions with the cooperation of all members of society, including entrepreneurs and consumers.
2-3 Trade and Environment
In the foregoing, we have seen relations between economic activ- ities in the forms of consumption and production, on the one hand, and the environment, on the other. International economic activities through trade are also an important factor which influences the economy, producing significant impacts on the environment. As we have seen. in Fig. 2-1-2 at the beginning of this chapter, the Japanese economy is tied in with economic activities around the world in a broad variety of environmental aspects. Japan's share in the world's exports is 8.5% and the share in its imports is 6.6% (those shares represent 1990), Exports account for 9.5% of Japan's gross national product and imports 72% (in 1990). Thus, those trade activities significantly impact the economic picture of Japan and, moreover, of foreign countries.
Trade spurs the exporting country's production activities and the importing country's consumption. This raises the level of economic welfare for both nations, but it can also lead to increased loads on the environment. If trade with developed countries leads to an upgrading of living standards of developing countries, this may help to prevent degradation caused by poverty and the over exploitation of natural resources.
On the other hand, environmental policies can influence trade. International differences in environmental standards can give rise to differences in corporate outlays for environmental measures and, as costs are reflected on prices, trade can be influenced, Also, environmen- tal policy could be used as a pretext for the disguised protection of domestic industry.
Thus, international economic activities, and not least trade, are closely related to the environment. In the following, let us take a look at those relations with attention paid to specific, concrete issues.
2-3-1 Impacts of Trade on Environment
The impacts on the environment produced by production and consumption have been well known for long. Nonetheless, the impacts on the environment brought about trade activities have yet to be fully ascertained Trade activities are the trans-boundary transaction of goods and services and, as with other economic activities, it is some- times necessary to take measures against environmental loads generat- ed by trade activities. There are cases in which trade policies such as tariff escalation (the higher the degree of processing of products, the higher the tariff) and export subsidies, distort trade and affect the environment In the following, let us see the impacts of trade on the environment while referring to studies by the Organization for Eco- nomic Cooperation and Development (OECD) and other institutions.
First, there are cases in which goods which affect the environ- ment are traded. There is concern that by trading goods which have an adverse impact on the environment, such as hazardous wastes, the environment of the importing countries and the countries through which those goods pass will be adversely affected. If hazardous wastes are traded, or if hazardous wastes are exported for recycling or for disposal in other countries, the environment of importing countries will be polluted by thorn, depending on their disposal capacity. The disposal of hazardous wastes is difficult to do particularly in countries with strict environmental controls because the cost is high or because of residents campaigns against disposal, often overcome by exporting to other countries. For example, the Koko case in Nigeria in which hazardous wastes from Europe were exported to Nigeria and illegally dumped near Porto Koko. UNEP data also provided a case as illustrated in Fig. 2-3-1. The Basel Convention for Controls on Trans-boundary Movement of Hazardous Wastes and Their Disposal is well known as an international framework with which to regulate the trans-boundary movement of hazardous wastes. Beside this convention, African countries have con- cluded the Bamako Convention to prohibit the importation by African countries of hazardous wastes.
Fig. 2-3-1 Main Examples of Trans-boundary Movement of Hazardous Wastes
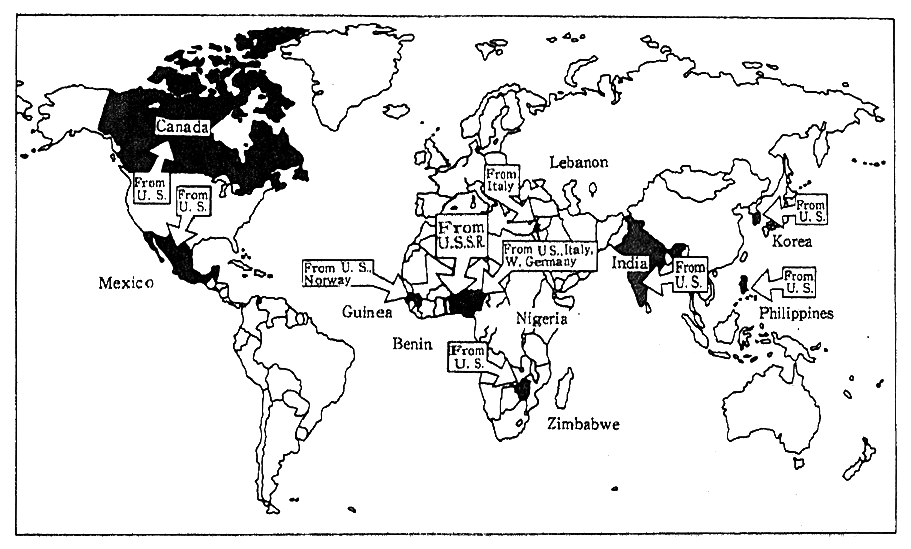
Source : Development and Cooperation No. p (1988)
Source : UNEP, The World Environment 1972-1992
On the other hand, the transaction of goods favorable in environ- mental terms, such as those which produce little waste after their use could reduce loads on the environment. For example, recyclable prod- ucts could enable importing countries to help solve waste problems, If importing countries opt for products favorable in environmental terms, the development of such products and the participation of new entrepre- neurs in exporting countries will be encouraged.
Second, as trade activities become brisk, the economic welfare of both exporting and importing countries rise, but as is the case with general economic activities, there could arise environmental issues if appropriate environmental measures are not taken in tandem.
Shrimp farming has developed as an export industry in recent years for Southeast Asia and East Asia. It is pointed out, however, that the disruption of mangrove forests for use as nurseries, land subsidence due to the pumping up of groundwater for shrimp culture and water pollution are posed as issues, and that full environmental measures have not been taken in its development. As regards tropical forests, the International Tropical Timber Organization (ITTO) has formulated a target of trading only sustainably logged timber by the year 2000. Morfeover, the ITTO is encouraging sustainable development which will not adversely affect the environment of tropical lumber producing countries in order to prevent the further deforestation and degradation of tropical forests by means of trade. When it comes to endangered wildlife, trade is controlled under the Washington Convention for the protection of species so that certain species of wild fauna and flora which form an irreplaceable part of nature may not be excessively used for international trade.
As various economic activities become brisk, with trade liberali- zation and currency devaluation, the World Resources Institute (WRI) has computed on a trial basis, with the Philippines as an example, the degrees to which economic activities affect soil erosion deforestation and resource exhaustion. According to this computation, real GNP would rise by 2.43%, soil erosion by 2.45%, deforestation by 7.25% and resource exhaustion by 29.38% with a combination of trade liberaliza- tion and 20% devaluation (Table 2-3-1).
Table 2-3-1 Environmental Effects of Trade Reforms in the Philippines
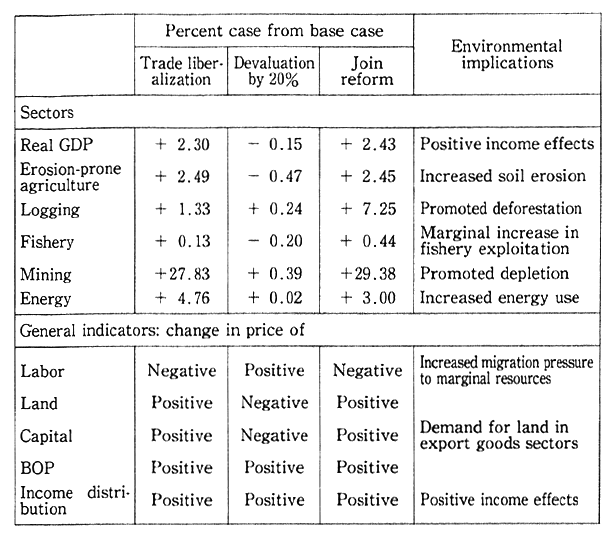
Note : 1. There are long-run effects relative to a "No REFORM" increase that approximates the economic conditions of the early 1980.
2. Erosion-prone agriculture includes corn and rootcrops sectors; mining refers to metallic ores.
Source : World Resource Institute, The Environmental Effects of Stabilization and Structural Adjustment Programs: The Philippine Case
On the other hand, environmental improvements often accom- pany increases in trade. In broad terms, trade activities permit the more efficient use of production factors available. The production of certain products in countries with low environmental costs will contribute to the reduction of hazards to the environment to that extent. If it is assumed that environmental policy was legitimately implemented and that the economic scale of the world as a whole would not be expanded by trade, free trade of the sort which could lead to an efficient utiliza- tion of production factors, would be able to bring about effects favor- able to the environment. The enhancement of economic welfare by means of free trade will make it possible to stop the vicious cycle of poverty and environmental disruption particularly in developing coun- tries.
The expansion of trade activities lead to an increase in the international transport volume of goods and can bring about debate about impacts on the environment. For example, the traffic volume of EC countries is on the rise in conjunction with the increase of regional trade. Given the rise, air pollution and noise by trans-boundary trucks for areas along the trunk roads linking North Italy to Germany --particularly, those passing over the Alps in Austria has increased(Fig. 2-3-2). Austria became a member of the unified European market on the condition that some trucking be changed to rail transport. The imple- mentation of appropriate environmental policy measures should be the basic policy response to the impacts of trade on the environment. Should those measures be improperly enforced, there would be cases where a dispute on the environment could flare up and, as we will see in the next section, differences in environmental policy could lead to trade restric- tions which affect free trade.
Fig. 2-3-2 International Lorry Traffic Transit Through Austria
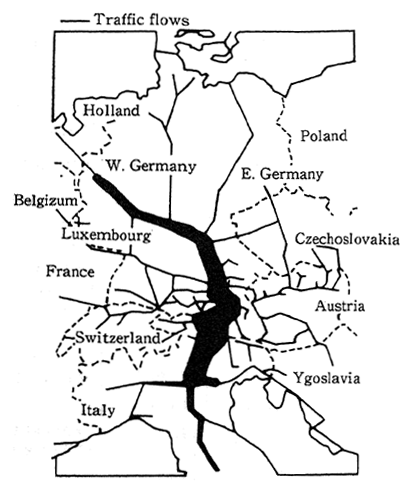
Source: OECD, State of the Enutronment 1991 (1991)
2-3-2 Impacts of Environmental Policy on Trade
Trade helps to promote the efficient use of resources domesti- cally in the sense that trading countries put more resources into the production of export goods which are marketable at relatively higher prices, the proceeds of which could be used to pay for import goods at relatively lower prices, thus broadening the range of consumer choice. On the other hand, some environmental policy measures restrict trade for conservation purposes.
First, when it comes to trade restrictions in coping with domestic environmental issues, provisions for the environment are given in Article 20 (b) and (g) of the General Agreement on Tariffs and Trade (GATT). Under those clauses, restrictive measures on trade are autho- rized on the condition that (b) measures necessary to protect human, animal or plant life or health and (g) measures relating to the conserva- tion of exhaustible natural resources are not applied in a manner which would constitute a disguised restriction on international trade, etc.
Second, regarding goods such as endangered fauna and flora, their processed products and hazardous wastes, to which trade restric- tion needs to be applied from a standpoint of environmental conserva- tion, there are cases in which trade restrictive measures are taken in accordance with conventions and other international accords. Typical cases in point are the Washington Convention on the international trade of wildlife and the Basel Convention on the trans-boundry movement of hazardous wastes.
Third, there are cases where environmental policy measures turn out to be indirect restrictions on free trade. A case in point is autos. Many countries are trying to work for environmental conservation with restrictions on exhaust gas and with standards on products. The stan- dards vary, reflecting the way autos are used in each country. That is why automakers hoping to export autos to countries where relatively strict restrictions are imposed on exhaust gas emissions have to come out with special measures, such as the fitting of gas treatment systems. The necessity of such additional measures alone could affect trade. Of late, there is concern that the restrictions imposed on packaging and labeling for environmental conservation might eventually bring about adverse impacts on trade. Policy could turn out to be disguised measures for the protection of domestic industry, depending on their framework and enforcement.
The utilization of subsidies for environmental policy could also distort trade. The Organization for Economic Cooperation and Develop- ment (OECD) has established the Polluter Pays Principle (PPP), assign ing to polluters the costs for environmental measures, while calling on member countries to see government that the sponsored corporate subsidies for environmental measures do not distort trade.
Fourth, trade restrictions will sometimes be imposed in situations where other countries are urged to carry out environment policy in coordination with the international community. A case in point is the Montreal Protocol on ozone layer depletion, which bans the import and export of restricted items. Aside from this, there are cases in which trade restrictions are unilaterally imposed to conserve the extra- jurisdictional environment ("global commons"). For example, the United States put restrictions on yellowfin tuna imports, contending that they had been caught in an irresponsible manner without regard to other marine life, Mexico, in turn, filed a protest with the dispute panel based on GATT Article 35, arguing that the restriction ran counter t the GATT. The panel has concluded that the United States took the action in violation of GATT Article 11.
How those environmental policy measures which affect trade should be weighed vis-a-vis free trade is a question which require international collaboration in the future. Studies on this point are tinder way by OECD and GATT working groups as we will see next.
2-3-3 Present State of Efforts for Complementary Environmental and Trade Policy Measures
Environmental conservation in national and global dimensions and the enhancement of the economic welfare of the people in each country through the efficient utilization of global production factors by free trade can be mutually-supportive. And, in fact, their mutual suppor tiveness is desirable, underscoring the need for appropriate environmen- tal and trade policy measures. The OECD Ministerial Council in 1992, recognized this notion and declared in a communique: "Trade and environmental policies can be mutually supportive in the pursuit of sustainable development, particularly if those policy interventions which have negative trade and environmental impacts are removed and if environmental benefits and costs are internalized into national and international prices."
When it comes to coordinated action between developed and developing countries to promote sustainable development mention is made in Agenda 21 as agreed upon at the Earth Summit. In the agenda, it is pointed out that a wide variety of trade measures hinder access to developed countries' markets and the diversification of developing countries' products. In plain language, the possibility is pointed out that funds for the development are difficult to secure because of tariff and nontariff measures (including tariff escalation) which restrict access to the markets of developed countries. Conversely with regard to produc- tion and export subsidies in developed countries, the agenda calls for measures to cut subsidies to less competitive production. The reason for the incorporation of those remarks has to do largely with developing countries to promote their their export goods--primary products, in particular--prices for which sagged, thereby aggravating trade condi- tions and placing them in economic difficulties.
On the building of more complementary relations between envi- ronment and trade, studies have begun at the GATT, OECD and other fora. Since interest in environmental issues has become widespread in a global or trans-boundary dimension, there has emerged debate on rela- tions between the GATT and environmental conservation. The GATT governing council decided in 1971 to establish a Working Group on Environmental Measures and International Trade. This group did not meet for a long time, but given the interest in the environment of late, it convened a meeting in November 1991. Later, the group was stepping up studies on three points--relations between environment-related inter- national arrangements and the GATT, the transparency of domestic environmental regulations which affect trade, and the impacts on trade of new regulations on packaging and labeling designed to protect the environment.
The ministerial conference of the OECD Environment Committee decided in January 1991 to make studies on trade and environment. With the progress of the studies in mind, the ministerial council made clear in a communique in 1992 a policy of preparing appropriate guidelines for improvements in the compatibility of environmental and trade policy measures and of to prevent environmental regulations and environment- related trade measures from becoming a disguised barrier to trade.
The ITTO, to which we have referred earlier, is the institution which enforces the International Tropical Timber Agreement (ITTA), one of the commodity agreement under the United Nations Conference on Trade and Development (UNCTAD), with both tropical timber producing and consuming countries parties to the agreement. The trading of tropical timber is closely linked to tropical deforestation in some cases, so the ITTO is working for the sustainable development of tropical forests. Its eigth Council adopted in 1990 the year 2000 Target and has been making studies on concrete implementation measures. Besides, in the 1989 survey on sustainable forest management in the state of Sarawak in Malaysia, for example, recommendations on improvements in forest management are being put forward, including cuts in the harvest volume. Japan is actively taking part in ITTO activities, while taking account of its position as the world's largest importer of tropical timber and as host of the ITTO headquarters (Yokohama). For attainment of the aforementioned Target Year 2000, Japan is also carrying out various concrete measures.
Thus it is necessary to work steadily to make trade and environ- mental conservation mutually supportive. Japan, having benefited from world trade, is expected to actively take part in such work. Individuals and businesses are also expected to fully understand that the affluent life and the sophisticated economic activities which we enjoy are the product of a healthy environment not just domestically, but internation- ally as well and that environmental problems are global problems.
Chapter 3. New Ideals and Responsibilities for Coexistence with Environment
As we have seen in Chapter 2. our contemporary activities are closely tied to the environment and foreign countries in which environ- mental loads come out in various sectors. In order to convert such activities of ours into ones amiable to the environment, on what ideals should approaches be based? What kind of responsibility should each entity of society should take? In this chapter, an attempt will be made to take a general look at those issues on the basis of the Earth Summit debate last year.
3-1 Basic Law for Environmental Measures and Other Environmental Measures--Framework and Achievements
Social responses to conventional environmental issues had devel- oped in sequence with actual environment problems as momentum. In this process, concepts have been developed on the way the system of environmental conservation ought to be and on the role and responsibil- ity of each entity of society ought to be. Here, let us trace the process of those developments.
3-1-1 Framework of Industry and Nation After Establishment of Citizens' Society
Environmental issues have taken on an increasingly grave charac- ter in conjunction with a remarkable rise in man's productivity and a boost in his power to affect nature since the Industrial Revolution. How were relations between industry and environment and between adminis- tration and industrial activities in the initial phase of industrial develop- ment.
After the establishment of democratic society where the free- doms of property and contracts would be assured, economy of the kind in which goods and services would be exchanged with market-set prices as signals was developed in Western countries. In this market economy, each entity of society recognized the use of the prices set on a free market, spending their own resources and funds. The notion which served as the backdrop for this framework was that of "spontaneous harmony" based on the assumption that production and consumption, left to the mercy of a free market's regulatory functions, would be regulated in an appropriate form by the working of "invisible hands." Also on relations between nation and society in that phase, there appeared views which reflected the concept of "spontaneous harmony. In this notion, it was argued that the role of the nation should be confined to a minimum range of public services which included national defense and the maintenance of order, the security of the people's lives and assets, and that there should not be intervention which could hamper market functions. Those were the notions known as "laissez- faire" and "night-vigil nation."
Production in a free market served to better the efficiency of a wide variety of resources, playing a significant role in expanding output. On the other hand, however, a broad range of issues came out. One of them was environmental problems. Where importance is attached to the free market, the right of individuals to make free use of assets are taken into serious account, making it highly possible that full attention might not be paid to the impacts brought about by those activities on other members of society. Now that man's activities have evolved according to market prices, the factors which are not reflected in prices tend not to be taken into account. Given this tendency, no consideration is given to things difficult to assign a price, such as the utilization of environ- mental resources and the emission of pollutants.
The impacts produced on third parties, as is the case with envi- ronmental pollution and the degeneration of important environmental resources, are known in economics as "external noneconomies" and "social costs." By "externality," it means that the activities of one person affect another by eluding the market mechanism, constituting a socially minus "externality." By "social cost," it means the cost to society as a whole for a certain activity (including not only the pecuni- ary cost but such costs as impacts on health and the living environment). As another cost comes out in the form of damage to third parties in the generation of environmental pollution, there emerge situations where the social cost does not coincide with the private cost the producer has to bear.
Next, let us trace Japan's institutional responses to environmen- tal questions that came out in the aforementioned social framework.