Quality of the Environment in Japan 1992
The public functions, including environment conservation, which occur in agriculture, are external effects which are not valued in the existing market economy. According to a survey conducted by a private research institution, environmental conservation effects which paddy fields have across Japan are projected at about 12 trillion yen according to the Hednick method (the method of projecting the price of environ-mental quality from the difference in land price and wage between districts by taking account of the fact that the environmental quality influences land prices and wages). According to the substitution method about 5 trillion yen (the method of projecting the economic values of some functions with the calculation of costs for the construction of necessary facilities, etc., to offer the same level of effects with that offered by these functions).
As agriculture serves a highly effective role for environmental protection, it does impose certain kinds of loads on the environment through inputs it makes of materials and equipment from outside. In developed countries, generally, volumes of agricultural chemicals and chemical fertilizers increased up to the late 1970's or so. When such materials are used to excess, they can pollute rivers and ground water, etc., and bring about adverse impact on health and ecological systems. Also, excessive dependence on chemical fertilizers and reduced recy-cling of composts to the farm soil, brings about reduced fertility, and thereby works to gradually undermine the sustainability of agriculture.
b. Environmental Problems Caused by Agriculture in Europe and North America
Environmental destruction caused by excessive inputs in agricul-ture is becoming a significant problem already in Europe and North America. In some EC countries such as the Netherlands, and the United States, contamination of ground water due to the use of fertilizers and agricultural chemicals has become a serious problem. Nitrates from fertilizers and the nitrogen contents of livestock excrement contaminate ground water, and when such water is utilized, it could cause health damage. In parts of France, the former West Germany, the Netherlands, and the United Kingdom, the nitrate content level of deep ground water has been rising each year. In the United States, too, soil erosion due to inappropriate management of cultivated land has become a problem.
In the EC, there is now an increasing awareness that concentrated use of agricultural chemicals and fertilizers due to pursuit of ever increasing productivity has resulted in deterioration of the environment, and based upon this awareness, there has been a shift toward placing priority on the role of agriculture in environmental conservation in the overall agricultural policy. In 1985, EC introduced its Common Agricul-tural Policy under which each country can provide subsidies to those farmers who conduct farming with methods that are desirable from the environmental perspective. Then, from 1987, it was decided that a part of the costs of this policy will be borne by the EC itself. Then in the 1991 a proposal on revision of the Common Agricultural Policy, strengthen-ing measures for environmental protection was proposed. In the United States, in the meantime, measures related to environmental conserva-tion have been strengthened as well; for example in the Act on Agricul-ture in 1985, crop reduction in terms of agricultural land, and steps for soil conservation are required when farmers receive the benefit of measures such as price support and income guarantee systems. Further-more, under the Act on Agriculture of 1990, measures were established for the reinforcement and expansion of plans for conservation of soil, wetlands, and water quality, for setting up new controls, and for institut-ing and expanding studies for promotion of "Low Input Sustainable Agriculture" (LISA).
c. Japan and Development of Agriculture Contributing to Environment Conservation
In Japan, rice paddies which are highly effective for protecting the environment comprise the great bulk of farmlands. Negative impacts on the environment due to excessive input of materials (such as agricultural chemicals) have not become acute as yet. When we look at inputs of materials and goods from outside into agriculture, we see that even in Japan, the character of agriculture has been undergoing severe changes since the period of rapid economic growth. In the past, inputs into farmland were only crop residues, composts, etc., which did not far exceed the bounds of natural cycle of materials. However, after the period of rapid economic growth in the 1960's, these natural types of inputs were reduced, and in their place, inputs of substances that were produced by industries increased. During the late 1950's and 1960's, use of such chemical fertilizers and agricultural chemicals increased sharp-ly. Thus, when we compare the existing situation with what existed around 1960, we find that the use of agricultural chemicals increased by several times, and the input of chemical fertilizers increased by 1.5 times. Now, the inputs of these materials have remained on the same level, or even declined slightly, from the second half of the 1970's on. However, as agricultural machinery became more widely disseminated, we find that the input volume of energy has increased for lighting, temperature conditioner, and other needs related to increasingly sophis-ticated farm facilities (Fig. 3-1-35).
The inputs of agricultural chemicals, fertilizer and energy are compared in Fig. 3-1-36. The necessary quantities of those materials differ, depending on climate conditions, and in areas with high tempera-ture and humidity like Japan, the suggestion is made that the necessity is higher, so that a simple comparison could hardly be made. But it is certain that input of materials in Japanese agriculture is considerable.
In this way, while increased inputs of materials such as fertilizers and agricultural chemicals serve to strengthen the productivity of farmlands, when such inputs become excessive, they work to increase loads upon the environment, and they may thereby reduce the sus-tainability of agriculture itself. Also there are cases where the nitrogen and phosphorus that flow into lakes from farmland place loads upon the water quality.
Similarly, even though farmland improvement projects such as district adjustment and improvement of drainage facilities for agricul-tural use, do improve labor productivity and contribute to continued use of land for farming and sustain its role in environmental protection, there are concerns that construction of concrete waterways and cutting down of woods and plants remaining on farmland, actually reduce the rich potential of the ecological system in farm land. Thus, there is a need for implementation of projects that take environmental protection fully into account.
Fig. 3-1-35 Trends in Various Inputs in Agriculture per Unit Area
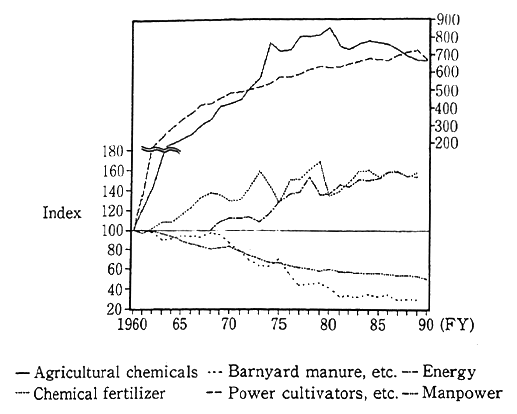
Sources: Estimated based on the Ministry of Agriculture, Forestry and Fisheries "Outline of Agricultural Chemicals", "Pocket Handbook on Fertilizer", "Pocket Statistics on Agriculture, Forestry and Fisheries".
"Rice Production Survey" and "Statistics on Prices and Wages in Rural Villages"
Notes:
1. Indexed with FY 1960 at 100. But indexed with FY 1968 at 100 for energy.
2. As regards agricultural chemicals, the total volume of shipment is used for FY 1977 and subsequent years. For the preceding years a estimation is made from the actual total amount of shipment,and the value thus gained is divided by area under cultivation. Incidentally, the agricultural chemicals (prescribed) do not include components other than effective ones.
3. As for chemical fertilizer, domestic demand converted in terms of pure components (N, P205, K20) is divided by area under cultivation.
4. As regards barnyard manure, the input of rice straw is added to the input of barnyard manure. However, 1Kg of rice straw is looked upon as 2kg of barnyard manure.
5. Concerning power cultivators, etc., the numbers of power cultivators and agricultural tractors are divided by area under cultivation.
6. On energy, the cost of light, heat and power for 10 ares of paddy rice are substantiated.
7. As regards manpower, the agriculturally working population is divided by area under cultivation.
Fig. 3-1-36 Intensity of Agriculture in OECD Conntries
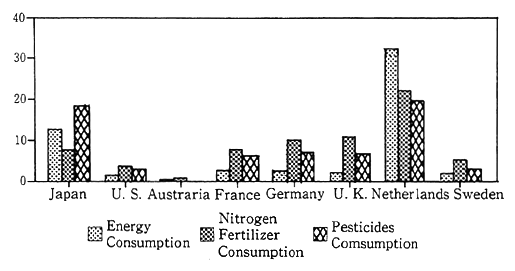
Source : OECD
Notes:
1. Figuren of energy consumption and nitrogen consumption are for 1989.
2. Figures of pesticides consumption are; Japan for 1985; U. S. for 1984 ; France for 1988 ; Germany for 1987 ; U. K. for 1982; Nether lands for 1989 ; Sweden for 1986.
3. Pesticides consumption of Australia is n. a.
4. Pesticides consumption of Germany is for West Germany.
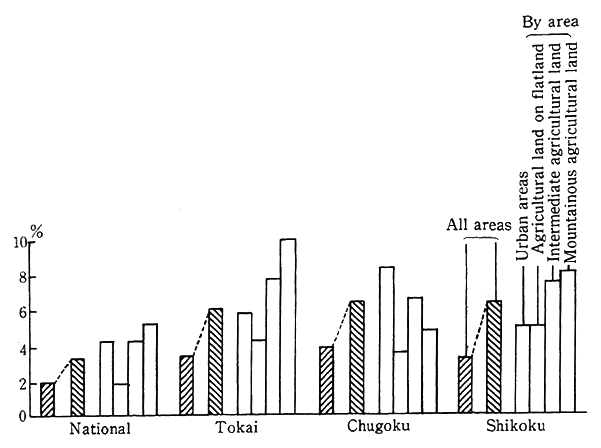
In the mountainous areas, agricultural plots where cultivation is abandoned increase against the background of depopulation, aging and other factors (Fig. 3-1-37). On those fields, the functions of agriculture to conserve the environment might be lost. If appropriate measures suitable for natural vegetation, such as afforestation, are not taken, it will take some time for the natural environment to return to what it was originally. So, it is feared that while we are waiting for the recovery of natural vegetation, adverse impacts on the environment, including drop in the cultivating functions of water sources and erosion, might be brought about.
Within this kind of a situation, in order to assure the sus-tainability of agriculture into the future, we must enhance its role in environmental protection, pay close attention to the impact of inputs of chemical fertilizers and agricultural chemicals on the environment, and promote the kind of agriculture which exerts a minimum of loads upon the environment. From this perspective, measures to promote "the agriculture which contributes to environment conservation" were initiated in fiscal 1992 by the Ministry of Agriculture, Forestry, and Fisheries. At the local government level, too, there are cases where agreements have been made about environmental protection, and efforts are made to reduce the amounts of chemical fertilizers and agricultural chemicals used.
Fig. 3-1-37 Rate of Area of Farmland With Cultivation Aban-doned to Area of Cultivated Land Under Manage-ment
Source: Ministry of Agriculture, Forestry and Fisheries, "Annual Report on Trends in Agriculture in FY 1991".
Note: By "area with cultivation abandoned", it means the area where cultivation was made long ago but was not done for 1 year preceding the survey day and where the landowner has no intention of once again doing cultivation in the next several years.
In this way, in order to promote agricultural practices which give full consideration to environmental conservation and minimize loads upon the environment, it is important to ensure that this type of farm management leads to improvements in productivity as well, such as improvement of farm business through more efficient input of fertilizers and agricultural chemicals, etc. Also, in mountainous areas, increased abandonment of agricultural land could lead to undermining of the environmental protection function which has hitherto been served by agriculture. It is essential to devise measures to activate the region by development of agriculture and forestry and local industries that make effective use of the distinctive characteristics of each area.
(2) Forestry and the Environmental Conservation Function of Forests
(a) Forest's Function for Environment Conservation and Forestry
Forests not only provide a vital resource in the form of lumber, but, as we all know, play a broad range of essential functions in the area of environmental protection. When we think from a global perspective, forests are intimately involved in the heat balance and water balance, as well as in the carbon cycle. As such, forests are indispensable for sustaining the earth as an environment suitable for habitation. More-over, a large variety of organisms live in forests, especially in tropical forests, and thereby play an important role in maintaining the diversity of fauna and flora. On a regional level, forests help rainwater to perculate to underground, and moderate the flow of rainwater into rivers, and thereby evening out the flow of river water, which is the function of cultivation of water sources. They prevent erosion, and the occurrence of natural disasters in mountain areas. They provide space for wildlife, and bring about diversified effects including moderation of meteorological conditions, absorption of pollutants in the atmosphere, and space for communion with nature.
Then, too, as the need for coping with global warming becomes urgent, the function of forests in fixing carbon dioxide is being given increased attention. There are a number of methods for calculating the volume of carbon dioxide solidified by forests, but we can suppose that growth of forest volume contributes to solidification of carbon dioxide and can calculate the volume. Let us look at the volume solidified by forests in Japan calculated under this assumption. We find that each year the accumulated forest volume increases by about 59 million cubic meters in artificial forests and by about 10 million cubic meters in natural forests, while about 39 million cubic meters are cut down. Through this, the equivalent of 54 million tons of carbon is solidified each year. This, in turn, is equivalent to about 17% of the total amount of carbon dioxide discharged in Japan.
About 67% of Japan is covered with forests, and so, our country benefits greatly from the benefits provided by the diverse environmental protection functions of forests. Artificial forests make up about 40% of the total forests in Japan, and they have been developed through for-estry activity such as seeding and afforestation. Even with regard to the remaining natural forests, fallen leaves and fallen branches have long been used for agriculture, and lumber has been used for making char-coal. Wholly virgin forests that have not been touched by human activity at all are very rare.
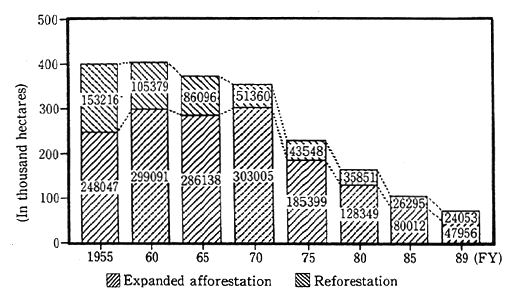
In order to rebuild forests that were cut down and damaged during the war and in the immediate postwar period, as well as to meet the rising demand for lumber, a program was instituted from the late 1940's and 1950's aimed at increasing lumber production. Under this program, many natural forests were totally cut down and replaced by artificial forests of Japanese cedar, Japanese cypress, and larch (Fig. 3-1-38). As a result, the total volume of artificial forests came to 10.33 million hectares (as of the end of March 1990), which comprised 41% of all forested areas in Japan, and 27% of the total national land area. Natural forests formed 12.52 million hectares or 54% of the forested areas.
Fig. 3-1-38 Trends in Afforested Area
Source: Forestry Agency: "Statistical Outline of Forestry".
When we compare artificial forests and natural forests, we find that artificial forests excel in terms of lumber production volume, but if their role in environmental protection, that is, for cultivation of water sources and prevention of soil loss, is to be fully sustained, then, work of trimming and thinning must be kept up, all of which requires a great deal more investment than natural forests. With natural forests, too, those natural forests that are close to villages have been used in the forestry business for lumber and firewood, etc., and managed in the process, and so, in order for these forests to fulfill their expected role, they, too, need to be maintained and workedwith properly.
Generally speaking, artificial forests with the same type of trees and same tree age have less ecological diversity of flora, insects, and other animals, than forests with mixed range of trees, and they are said to be weaker against wind and snow damage than forests with diverse tree types. We need to keep all of these factors in mind for both artificial forests and natural forests, select appropriate types of mainte-nance work depending upon the state of the specific forests and the specific roles expected of them, and promote appropriate management through human activity. Forestry work that is carried out in this sense is a sphere where human beings' productive activity and nature coexist, and as such, it is certainly a sustainable activity.
(b) Forest Management and Their Contribution to Environmental Protection
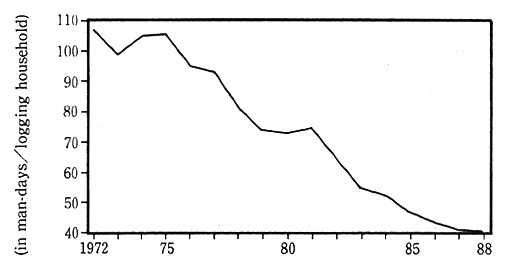
Forestry in Japan has come to a standstill, as the prices of domestic lumber hovered low due to increases in imports of cheaper foreign lumber and rising production costs, including forest develop-ment cost. Log output peaked in 1967. In the midst of those trends, families engaged in forestry began to look for other job opportunities, so that manpower in forestry has been on the down trend (Fig. 3-1-39).
Fig. 3-1-39 Trends in Annual Inpnt of Manpower for Forest Nursing per Logging Household
Source: Ministry of Agriculture, Forestry and Fisheries, "Eco-nomic Survey Report on Logging Households".
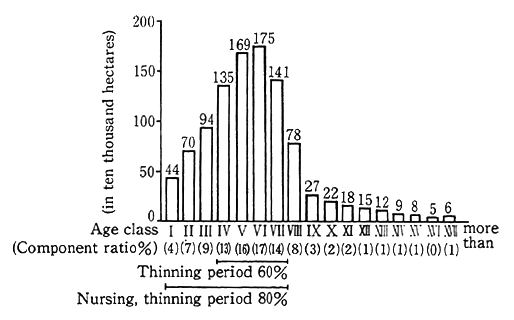
On the other hand, the time has now come when great deal of thinning and other kinds of care has become necessary for the artificial forests which were afforested on a large scale just after the war. (Fig. 3-1-40). Nonetheless, care cannot be fully delivered due to low lumber prices, lack of manpower and delays in mechanization and development of production infrastructure, thereby losing the soundness of forests. If thinning and other care was not done sufficiently for artificial forests, thin trees grow in clusters. They be readily affected by wind and snow hazards,pathogenic insects and fire. As light failed to penetrate forests, grass around the trees would not grow, thereby giving rise to erosion and reduced the water retention.
Fig. 3-1-40 Area of Manmade Forests and Area for Thinning by Tree Age Bracket
Source: Businness data from the Forestry Agency.
Notes:
1. The figures are tabulated as of the end of March 1991.
2. By "tree age bracket," it means a predetermined bracket of tree ages. In general, a bracket consists of 5 years. One to 5 years in tree age is know as Age Braoket I and 6 to 10 years as Age Bracket II, which is followed by Age Bracket III, Age Bracket IV and so on.
As of 1985, there were a total of 1.9 million hectares of privately owned forests that urgently required thinning in the following five years. In fact, thinning work was carried out for 1.48 million hectares of this total. But even today, there are about 1.4 million hectares of privately owned forests that need to be thinned for growth, but for which work is not being implemented. For this reason, there is a serious concern that the "health" of these forests may be deteriorating, which, in turn, will undermine their environmental protection function. And so, there is a strong need for thinning work to be promoted and pushed forward for these forests. In this situation, the Forest Act was revised in 1991, and new efforts for improved forest management are being undertaken, through improving forest planning systems and establishing systems for planning forest improvement projects, etc.
As people's hopes and expectations rise on the role of forests in protecting the environment, efforts are being stepped up to make effective use of the forest planning system under the Forest Act, to implement public investments for afforestation and for building lumber roads, to promote various types of subsidy and assistance projects, and to provide special measures in finance and tax system, and so forth. In addition, those concerned are applying provisions in the Nature Conser-vation Law, the Natural Parks Law, and related systems, to serve specific purposes of these schemes so as to support forests, and to ensure the function of forests overall at a high level.
However, if the principles of the market economy are pursued in an one-sided manner, then, the multifaceted functions of forests that we have been discussing may not be evaluated positively in terms of the prices and the costs involved; there are aspects which make it more conducive to pursue conservation and management of forests only to the extent that is economically viable within the framework of lumber production. As we will see in the next part, there have been instances in some developing countries where the production costs were artificially lowered for the purpose of securing foreign exchange, and where the forest resources were developed in ways that could not be sustainable, which then resulted in decrease and deterioration.
In Japan, we should of course take part in the work of conserving forests and promoting afforestation on a global scale, and we should enhance the awareness that our forests are not only an important resource for environmental protection in Japan, but they are a precious environmental resource for the protection of the global environment as a whole. Based upon this awareness, we must carry out accurate measures for conservation, management, and afforestation work so as to enable forests to perform their environmental protection function at a high level. To this end, thinning work for all the artificial forests should be promoted and managed appropriately, afforestation work should be carried out with a greater priority placed on environmental protection so that it includes more work to develop multiple-layer forests and forests with a longer-cutting period. Appropriate protection and management of natural forests will be necessary as well.
(3) Trends in Sustainability of Fisheries
a. Sustainability of Marine Environments and Fisheries
Unlike manufacturing industries which depend largely on non-renewable mineral resources, fisheries are an activity which makes use of renewable living resources for food production, etc. Therefore, in so far as it uses appropriate methods and standards, and catches within quantitative limits tolerated by the marine ecological system, it should be possible to provide food on a permanent basis. Thus, when conducted appropriately, the fishing industry is a sustainable form of human activity which, in its essence, is harmonious with the natural environ-ment.
In the recent years, as concern for global environmental issues as well as requirements for sustainable economic activity heightened, there have been moves to demand controls on fish catches even in interna-tional waters from the point of conservation of natural resources, and moves to demand bans on fish catches for some species from the point of wildlife protection. From the point of global environmental issues, there is an increased awareness for the need to conserve and protect the marine environment, and to secure sustainability of fisheries through appropriate management of natural resources. At the "United Nations Conference on Environment and Development (the Earth Summit) scheduled for June 1992, the issue of fisheries resources will be taken up, the basic direction of sustainable uses of fisheries resources will be discussed, with due attention given to ecological systems and manage-ment of coastal areas, etc.
Because fishing is a industry which is centered around catch of marine wildlife, it has a higher level of dependence on the natural ecological system, even more than agriculture and forestry. Therefore, in order to sustain activity, it is essential to conserve the marine environment including all marine life in a healthy condition. Let us take a broad look at the relationship between fisheries and the marine environment in Japan from this perspective, and reflect upon the ques-tion of sustainability.
Fisheries have an impact on ecological systems especially when marine resources are caught excessively, and it also places another type of load upon the environment through input of feeds, etc., in fish farm-ing. At the same time, they are affected seriously by negative effects on the environment exerted by economic activities other than fishing such as waste water discharge from factories, households, and some types of coastal area development such as landfills. In order to think about the relationship between fisheries and environment, and evaluate the sus-tainability of the fishing industry, we must consider both the impact that fisheries give on the environment and the impact on fishing exerted by the stress on the environment brought about other economic activities.
b. Impact of Fisheries on the Marine Environment
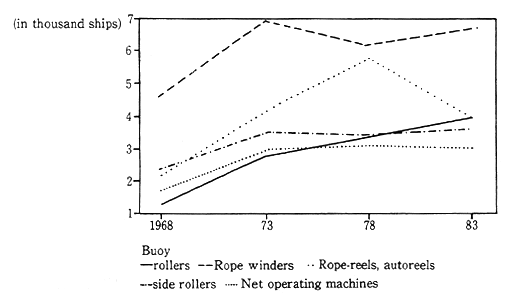
To begin with, let us look at the impact of the fishing industry upon the marine ecological system. Japan's total fishery production was presented in Chapter 1. With regard to the areas surrounding Japan, catches have been increased through improvements in the performance of fishing boats (Fig. 3-1-41). Therefore, the quantity of sea-bottom fishes (types of fish that inhabit in relatively deeper levels of the sea) have been declining, which gives rise to concerns about some specimens of fish, if not about the fishing industry as a whole.
Fig. 3-1-41 Equipment of Power Fishing Vessels (Fishing vessels. 5 tons and heavier)
Source: Fishery Census
It is difficult to decide who owns or manages marine life which moves freely and over a wide area. If it were left to free competition, then, individual fishermen and fishing businesses will be forced to pursue short-term interests, and excessive fishing will be the most likely outcome. Therefore, in such a situation, some form of control and management of marine resources become essential in order to carry out sustainable fishing production.
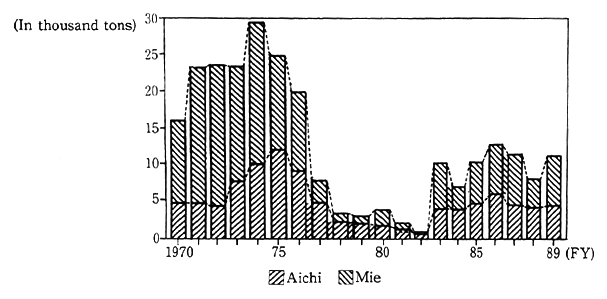
To this end, management of resources and of the fishing industry is carried out based upon the provisions in the Fisheries Act and the Living Aquatic Resources Conservation Law. But in addition to these official systems, it is necessary to promote voluntary management by businesses that are in accord with the specific characteristics of each area. From before, there have been different forms of resources man-agement such as setting up of time periods and areas where finishing is banned, stipulations and restrictions on the size of fishing boats and equipment and fishing methods. In more recent years, there have been examples of wide-area control and management of aquatic resources on the level of a bay, coastal sea, etc., through a number of fishermen's organizations working together. In Aichi Prefecture and Mie Prefec-ture, for example, joint management of resources is carried out with regard to sand eel (launce) in the fishing grounds that extend to both prefectures. This management takes such forms as setting the fishing season, etc., and as a result, the volume of fish catch has stabilized at a fairly high level (Fig. 3-1-42). In order for the government to play a supportive role for this kind of private resources management, the Fishery Agency has, for example, developed simulation models for different sea areas which forecast the resources situation in the future. In order to raise the sustainability of fisheries, it is essential to promote this kind of work based upon effective resources management in a practicalway.
Fig. 3-1-42 Trends in Sand Eel Hauls in Aichi and Mie Prefecture
Source: Ministry of Agriculre, Forestry and Fishery, "Annual Statistical Report on Fishery and Oceanic Culture Output".
In another area, in order to counter limitations solely dependent on natural resources, fish breeding and cultivation is being promoted more and more. In the sense that this business involves active breeding of aquatic resources and increasing their volume, it certainly can be sustainable. While some high-class fish (whose catch is increasing in response to increasinglyhigh level of consumer demands) require more feed than the amount of fish that is produced, such fish breeding converts unused parts of fishes like sardine that are caught in large quantities into the types of fish that are suited to people's needs. However, input of excessive amounts of fish feeds, beyond the level which the sea can utilize, brings about contamination of the sea, and it can bring about adverse effects upon fish breeding itself, some observers have pointed out. So, even here, it is important to raise fish in such a way as to harmonize with the environment, and take other needed steps to maintain and protect the environment of the fishing grounds.
c. Impact of Environmental Pollution on Fishery Sustainability
As we have seen, the fishing industry does impact the environ-ment, and it is affected by the negative stresses by other types of economic activity. It is in the position of a victim as well.
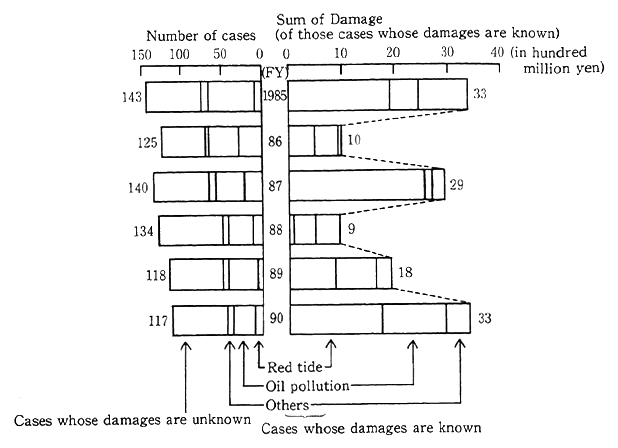
In the waters adjacent to Japan, and especially in closed waters such as the Seto Inland Sea, there has been much damage to the fishing industry by the onset of "red tide", oil pollution, etc., with the total amount of such damage to fisheries rising sharply with the high eco-nomic growth. In recent years, the level of contamination has eased somewhat, but even today, more than 100 cases of such damage are reported each year, and the total amount of damages reached about 3. 3 billion yen in 1990 (Fig. 3-1-43). The main factor for eutrophication, which causes red tides,is the pollution load by domestic waste water, and the need to hold down and control thissource has become important.
Then, too, starting in the period of rapid economic growth, many land reclamation projects were promoted with the aim of developing industrial sites, etc., and today, 36.5% of the total coastline of Japan (exclusive of islands) have been turned into artificial coastlines. Natural coastal areas are one of the richest areas from an ecological point, where a large number of wildlife species live, and where a high level of water purification capability exists. Development of coastal areas in the form of land reclamation projects results in the loss of fishing grounds, areas for spawning of fish, as well as for growth of fry and young fish. Erosion of soil and sand during construction, increases in pollution load due to economic activity on developed land, and deterioration of water quality due to the, weakening of the purification function of the coast also deteriorate marine resources. Naturally, such developments often bring about negative impact on the fishing industry. In recent years, development of coastal areas has become even more intense and widespread due to a stepped up interest in "waterfront development," development of marine resorts and so on, and there are strong concerns about the widening impact of these projects and land reclamation work on the fishing industry.
Fig. 3-1-43 Trends in Abrupt Fishery Damage (on the Sea Surface) by Water Pollution,Etc.
Source: Fishery Agency
Just as the contamination by mercury became a big social issue in the past, when fish and other marine animals become contaminated with toxic chemical substances, real fears exist that people's health could be damaged seriously, and fishery's sustainability may be under-mined. Pollution by toxic chemicals have been observed and the use etc., of some of these chemicals are already prohibited, including organic tin compounds that are used to prevent biological dirt on ship bottoms, fish nets, etc. There is a possibility of new cases of contamination of fish and marine animals by toxic chemicals, and so, it is extremely important to implement appropriate measures to prevent any recurrence.
In addition, pollution of fishing grounds by wastes has become a serious problem.
So, as far as the situation facing the fishing industry in Japan, then, there is some tendency for fisheries resources to decline in the seas that surround Japan. At the same time, marine pollution caused by industrial activities exert a negative impact upon the fishing industry, and so, securing sustainability for the fishing industry has become an important issue. To this end, it is important to maintain measures for maintaining the marine environment in a healthy state, and at the same time, we need to promote a "resources management type fishery" so as to ensure that marine resources will be maintained at a proper level, and so that fisheries will remain sustainable.
3-1-4 Tourism, Leisure Activities and Nature Conservation
(1) Background for Resort Boom
The natural environment is not only the basis for the existence of all sorts of life, including mankind, but also important as, so to speak, a capital for sightseeing activities and places where citizens find charm and rest in communion with nature and places which give us impressive views. Nonetheless, the use of the natural environment could disrupt the environment, should proper consideration be wanting. For example, there are many coastal areas in the Mediterranean Sea which are affected by water pollution, air pollution and increased wastes as tourist facilities have rapidly increased and tourists have converged on them. In Asia, too, a case in point is Nepal where a grave issue is posed as Himalayan trekkers, whose number has rapidly increased, recklessly throw away trash. Japan is no exception. In the past, the sightseeing boom and reckless development in anticipation of profits out of that sightseeing boom in the 1965-74 period led to nature destruction at various places, which eventually became a grave social issue. And concern is also expressed in some quarters about the so-called resort boom in recent years.
What has given rise to the development of resorts and what backdrop has there been for the resort boom particularly in recent years?
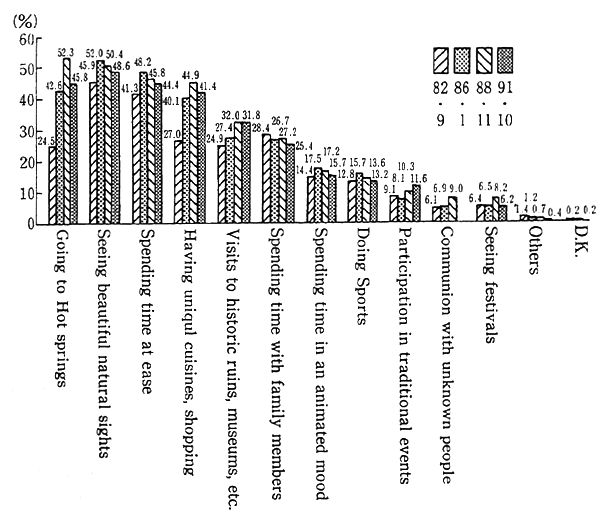
The primary cause of resort demand is an expansion of leisure activities. Conducted by the Prime Minister's Office, the Opinion Poll on National Life says that the number of respondents who take up leisure and free-time activities as a focal point in their future lives has consis-tently increased. This stems from increases in the availability of leisure time and rises in incomes. There is a wide variety of ways in which people take advantage of leisure time, but many people seek for commu-nion with nature during their tours. An opinion poll says that roughly half of the respondents say they "want to look at beautiful natural sights, "(48.6%)," want to visit a spa. "(45.8%) when asked what they want to do on a sightseeing tour with overnight stays. The desire to relax, both physically and spiritually, in the midst of nature to develop a sense of integration with nature, something hardly accessible in everyday life, is one reason why people want to go to a resort (Fig. 3-1-44).
Fig. 3.1-44 Trends of Views on Conduct in Overnight Stays at Sight-seeing Spots
Source: Prime Minister's office: "Opinion Survery on Leisure and Tourism"
Note : Plural replies from those who answer they want to travel more than over night in future. :The survery at 1991. 10 does not have the choice of "Communion with unknown people"
Beside those factors on the part of people who want vacations, an earnest desire to counter depopulation may be cited as a reason on the part of people who accept tourists and offer services. Decrease in population in 1989 was observed in 1,312 (40.4%), of the nation's 3,246 municipalities. In particular, they include agricultural municipalities where population is on the downswing, and this phenomenon is observed in 71.4% of all rural municipalities in mountainous regions. Such depop-ulation was described as having arisen from young people abandoning rural communities, where few job opportunities were available. The development of resorts was welcomed as a means of increasing job opportunities and reactivating the communities. When it comes to the circumstances in which suppliers are placed, we must not overlook the circumstances for businesses which develop and manage lodging and recreation facilities. Given a shift to a leisure-oriented society and some local governments' intention of building new resorts, many corporations began in or around 1987 to take part in the so-called leisure industry as profitable places for investment in the midst of the availability of surplus money. Yet another factor was the development of resorts officially accepted as one of the centerpieces for boosting domestic demand to reduce the trade surplus. Thus from 1985 on, the development of local tourist facilities, knownas resorts, was stepped up, and with the enactment of the Comprehensive Rest Places Development and Promo-tion Law (the Resort Promotion Law) as a turning point, development entered the mainstream.
(2) Impacts of Sightseeing and Leisure Activities on the Environment
The development of resorts has become brisk in this fashion, but some people are concerned about influences on nature protection. As is stated in the Resort Promotion Law, "land in a favorable natural condition" essentially forms the basis for the development of resorts. As is discernible from Japan's past examples and those in foreign countries, there is no denying that development for tourism will possibly lead to depleting natural resources, which form the basis for the development of tourism.
Let us see some of the past examples in Japan. The first sight-seeing boom began from 1960's to first half of 1970's. People sought a wide variety of leisure activities and many wanted to have communion with rich nature. The flood of people who wanted to come in contact with nature ironically ended up deteriorating it.
The water quality of lakes and swamps situated in sightseeing areas dropped and became less transparent. A case in point is Lake Akan. The degree of transparency stood at 8-9 meters in 1917 but dropped to 2.2-5.6 meters in 1973. The same thing holds true in the case of Lake Ashi-no-Ko in the Fuji-Hakone-Izu National Park, where it dropped from 11 meters at the beginning of the Showa era to 5 meters or so in the 1971-74 period. Presumably, the advance of such pollution resulted from rapid increases in tourists and rapid development of lakeside areas. According to seasonal changes in the BOD values for the lake of Yu-no-Ko in the Nikko National Park, values were high in the summertime and low in the wintertime. This reflected the large number of tourists visiting there in the summertime. Though there are signs that the BOD values tend to be high in the summertime due to natural conditions, it is conceivable that visitors there on sightseeing tours were largely responsible for the pollution of the lake (Fig. 3-1-45). Given this trend, sewer system projects, including specified sewer systems for environment conservation, have been promoted to conserve the water quality of each one of those lakes and reservoirs. Moreover in 1970, the Natural Park Law was revised. Under the revised law, 35 lakes, reser-voirs and swamps in the special protection areas of national parks were designated, and it was stipulated that permission would be required in the installation of drainage facilities, the water of which would directly flow into lakes, reservoirs and swamps or into streams within 1 km.
Fig. 3-1-45 Seasonal Changes of Number of Tourists and BOD at Lake Yunoko in Nikko National Park
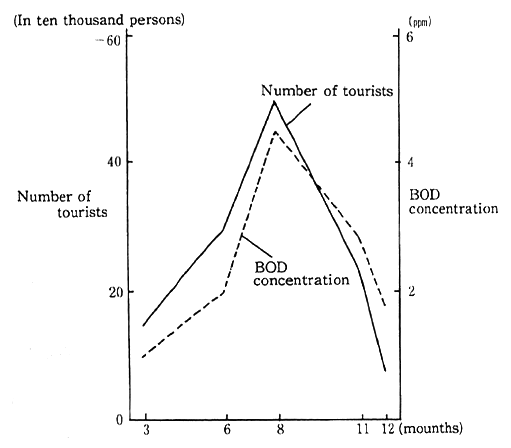
Note: 1. Prepared from the Environment Agency's "Lake and Reser-voir Polluton Survery"1972. 2. The number of tourists represents the total number of those for overnight stays and those on day trips.
Yet another feature of the sightseeing boom in those years was the increase of automobile tourism. With the concentration of cars at each one of the sightseeing spots, adverse impacts on the natural environment were created by cars parked off the road and the pollution caused by their exhaust gas. A survey conducted on Kamikochi in Nagano Prefecture in 1971 suggests that the concentration of carbon monoxide stood at 2.8 ppm, somewhat higher than the average value registered at air pollution monitoring stations in those years. As there was concern about the adverse impacts produced on the natural environ-ment by the increase in the use of cars, restrictions were imposed on trips into Kamikochi. At Mt. Tateyama in the Northern Alps, restric-tions were put on the trips by private cars into the area from the point of the conservation of the natural environment when the mountain road was opened.
Such an aggravation of the environment as was seen in the sightseeing boom of the 1965-74 period was caused by the rapid increase of tourists and their acceptance without due consideration to the envi-ronment. Considerable money and manpower were required for restora-tion of the aggravated environment. It is necessary to learn from those experiences and exercise care so that resorts may be developed in an assured clean environment.
(3) Challenges for Better Resorts
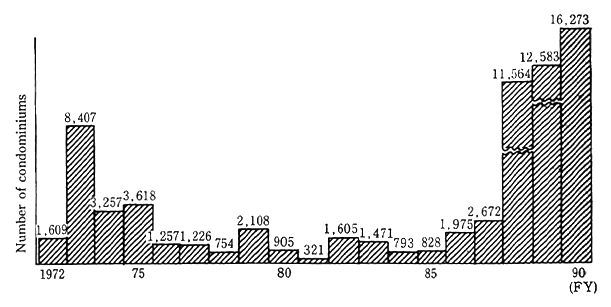
Let us take a look at how things stand today. Condominiums constructed for people who spend holidays at resorts began to increase at an epochal pace in or around 1988, and their concentration is observed in certain areas, such as Yuzawa in Niigata Prefecture (Fig. 3-1-46). It is pointed out that beautiful sights will be lost if such resort condomin-iums are constructed without due consideration to the environment or facilities necessary for environment protection. It is also pointed out that the development of public facilities for waste disposal can not catch up the increase of wastes from rapidly increased resort condominiums, thereby making it difficult to dispose of wastes and bringing about adverse impacts on the environment.
Fig. 3-1-46 Trends in Number of Resort Condominiums Sold
Source: Institute of Real Estate Economy Inc.
There are many cases in which the development of a resort centers on a golf course based on the high demand for golf. For exam-pIe, about 180 new or additional golf links are planned according to the basic concept of resort development of the Resort Promotion Law. In these circumstances, the total number of golf links (about 1,700) is increasing recently (Fig. 3-1-47). As regards golf links, there is concern about impacts on the environment, such as water pollution by agricul-tural chemicals, wide-area changes in land form and natural vegetation and changes in sights and ecosystems including wildlife. For this reason, 30 cases of disputes concerning golf links construction were handled in the Prefectural Environmental Dispute Coordination Commissions dur-ing 1990. In accordance with the Provisional Guideline formulated by the Environment Agency in 1990, prefectures surveyed the quality of water released from golf links. The findings indicated that most did not emit agricultural chemicals, but agricultural chemicals in excess of guideline values were detected in some samples, and guidance was provided to golf courses. There are cases in which restrictions are imposed on the total area of golf courses, stricter conditions are set forth for permission to construct golf courses and agreements are concluded between businesses and local governments on the use of agricultural chemicals.
Fig. 3-1-47 Trends in Number of Golf Links
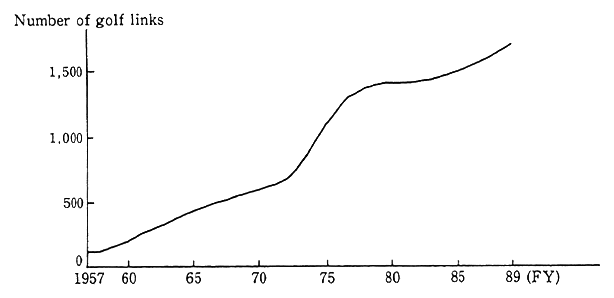
Source; Japan Association of managers of Golf Links
As for the development of resorts enumerated in the Comprehen-sive Resort Plan, although the goal is to develop facilities taking advantage of regional character, but it is pointed out that core facilities such as golf courses, ski resorts and marinas can be seen many of these Comprehensive Resort Plans. In order to satisfy people's desire to commune with nature, it becomes important to replenish nonprofit public facilities. An "image" survey conducted by the Japan Tourist Association on resorts in 1988 indicates that, as facilities necessary for resorts, many respondents preferred facilities where they could come in contact with nature without the use of special tools, such as hot springs, forest parks and paths for nature walks (Table 3-1-3).
Table 3-1-3 Facilities and Services Needed for Resort (best 10 by People's Opinion)

Source: From the survey on resorts conducted the Japan Tourist Association in September 1988
The development of public facilities, such as paths for walks in nature and facilities for nature education, is becoming all the more necessary in terms of the sustainable use of naturalareas, but develop-ment is delayed due to insufficient budgets. There is the need to grapple with it as a future issue.
It is also required to evaluate economical effect and cost-benefit of resort development. Some resort development projects keep up with the trends of the time and contribute to local development, but it is pointed out that local economic effects from the development of resorts are not so great as expected because the input of local commodities and manpower to resort projects is not so significant. A case in point is lodging facilities at resorts. As indicated in Fig. 3-1-48, the number of guests significantly differs, depending on the season, and the use of guest rooms at those lodging facilities is not so good as at urban hotels in the annual average. Negative impacts on nature are feared. We must make sure of the way of development which contributes to regional develop-ment and takes sufficient consideration to the environment.
Fig. 3-1-48 Treads in Use of Guest Rooms in Registered Major Hotels (Guest Room Use Rate) by District

Note: By "registered major hotel" it means a hotel registered under the Interna-tional Tourist Hotel Redevelopment Law. The figures are tabulated as of June 1990.
Source: Japan Hotel Association's data "Anneal Report on State of Tourism"
Some developed countries have already had experience in dealing with the development of resorts and the protection of the environment. Particularly in European countries, the start of leisure activities was earlier than in Japan and they are more experienced in the so-called resort boom. In coping with those problems, they have more experience. As an example, let us see how the development of ski resorts in France has changed.
An act of paid holidays was enacted in France in 1936. The number of paid holidays was increased to 3 weeks in 1956 and to 4 weeks in 1967. For the people's expanding leisureactivities, resorts were devel-oped for summer vacation and skiing in the wintertime. Skiing resorts in France may be divided into four generations. In the first generation, mountain villages changed into resorts primarily with skiing grounds. Their features as mountain villages were retained, indicating that there was a lack of planning. In the second generation, there appeared artificial resorts at places high in altitude with lodging facilities primar-ily for skiing. In the third generation, an integrated type of large-scale ski resort came out against the backdrop of an expanded resort boom during the Grenoble Winter Olympics. Resorts were constructed at higher altitude. For example, a colossal building complex housing all aorta of city functions, such as lodging, chopping streets and leisure facilities, was constructed on a rock bed, more than 1,800 meters in altitude and far above the forests, to efficiently accommodate numerous people. This complex turned to be a new type of integrated resort under a powerful program package, but it has been pointed out that problems on conservation of the natural environment should have been taken into account as a colossal manmade structure has been brought into the natural landscape. In the fourth generation, as there had been rising interests in nature protection since the 1970s, development was modified according to the basic concept of coexistence with nature as a result of reconsideration over the fact that skiing resorts in the third generation had been too disharmonized with nature. In the third and earlier genera-tions, the altitude of ski grounds became gradually higher, but in the fourth generation, they were located at relatively low heights below the boundaries of forests. Buildings were patterned after traditional local houses for farmers and made lower in height than the nearby forests, so that they could be in harmony with the natural landscape. The basic concept of such development is guaranteed by the powerful and system-atic development methodologies established in the third generation to avoid reckless development. For resorts in the fourth generation, emphasis is put on software for the offer of opportunities for arts and sports in various forms of nature along with facilities (Table 3-1-4).
The 1992 Winter Olympics were held in Albertville, France, under the basic theme of harmony with nature. Existing facilities were used and as much effort as possible was exerted to avoid the construction of unnecessary, new colossal facilities, facilities are removed after the games, and the management was designed to avoid new pressures on nature and excessive financial burdens. This approach reflected the enormous deficit that had come out of the Grenoble Olympics and also the fact that importance began to be attached to harmony with nature in the fourth generation as far as thoughts about skiing resorts were concerned.
Table 3-1-4 Developments Concerning Ski Resorts in France

Source: Prepared by the Environment Agency on the basis of date from Neige International in France.
It is not conceivable that all of the France's experience would be of use in Japan, but the development of resorts in Japan should be conducted without repeating the mistakes committed by France. Har-mony with nature is the fundamental factor for which resorts are developed. In a number of local governments in Japan, there are moves to formulate ordinances for protection of the natural environment to prevent environmental disruption in preparation for the development of resorts. In a perspective of local revitalization, development of a short-sighted kind is not necessarily economical. Without making wasteful use of abundant nature, which after all is a rare and relatively superior resource remaining in the local districts, there is the need to think about local development in a broader perspective of making effective use of the local environment and culture, including the use of local agriculture, forestry and fisheries. The development of resorts is something which ought to be positioned as one of those options.
3-2 Environmental Problems and Sustainability of Economies in Developing Countries
In any international debate over environmental problems, the most heated discussion is whether issues on the environment stem from poverty or excessive prosperity. The start of this sort of discussion was marked by the Conference on the Human Environment held in Stock-holm in 1972. In those years, developed countries were confronted with pollution problems that had cropped up as a result of the rapid develop-ment of their economies after Second World War, and they tried to discuss approaches to environment issues that came out as distortions in the economic development. On the other hand, developing countries, taking up desertification and other problems, argued that poverty per se produced significant stress on the environment and was the prime factor responsible for an aggravation of the environment. Against the back-drop, there lay the decisive difference in position between developed countries which had achieved a certain degree of development and improved national life and developing countries which had to work for betterment of the national life.
Twenty years having elapsed since the Stockholm conference, the different degrees to which developing countries have economically developed and the different methods used for the economic development are so significant that developing countries no longer remain a mono-lith. Globally, Asia, Africa and Latin America are generally looked upon as developing regions. But in the breakdown, for example, newly indus-trializing economies (NIEs) began to realize a high economic growth in the 1980s, and among the Latin American countries whose economies are currently straggling because of accumulated debt and other factors, there are areas where high economic growth was achieved, as suggested by the words "Brazil's miracle". On the other hand, there are countries, such as those in the Sahel region, Africa, which have for many years been unable to extricate themselves from a vicious cycle of poverty and famine. A close look at the Asian-Pacific region reveals the mingling of NIEs, such as the Republic of Korea, Taiwan, Singapore and Hong Kong; such countries of the Association of Southeast Asian Nations (ASEAN) as Thailand, Malaysia and Indonesia, whose economies are briskly developing with the intent to catch up with NIEs, and countries for which the extrication from poverty itself is a crucial issue, such as Nepal, Myanmar and Bangladesh. (Table 3-2-1). Then there are places, like what Japan used to be, which have developed at the national level but have districts with varying degrees of development. When those differences in the economic performance are taken into account, we realize it is inappropriate to step up a debate on environmental issues posed for developing countries as a package on the same plane. There are cases in which the environment is still disrupted by poverty. Then there are countries and areas which have already experienced environ-mental issues as a distortion of prosperity in just the same way as the developed countries have been faced. It might be said that it would not be possible to see the true picture of the environmental issues posed to developing countries without a closer look.
Having said that, we will, in this section, look into the state and causes of environmental issues in developing countries and into relations with the economies of developed countries, to say the least of Japan, with particular reference to the Asian-Pacific Region, with which Japan once had an unfortunate experience but on which it is heavily reliant, such as by buying a variety of resources and becoming a supplier of products. This section indicates that restrictions on management resources at their mercy, such as capital, technology, manpower and organization, are greater in developing countries than in developed countries, so that environmental issues in developing countries are closely tied in with their socio-economics and crop up as they are closely linked to the international economies.
Table 3-2-1 Per-Capita GNP in Asian-Pacific Countries (ESCAP Members)
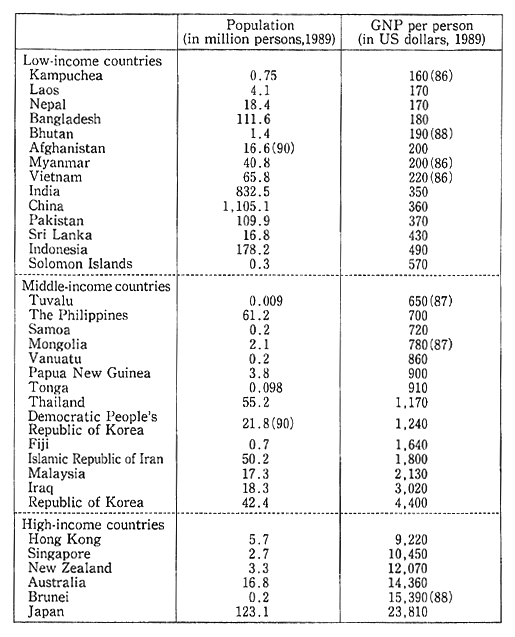
Note: GDP for Hong Kong. That classification of low-income, middle-income and high-income countries in based on that of the World Bank Low-income: Countries with per-capita GDP at less than $5811 in 1989 Middle-income : Countries with per-calcite GDP at $581-5,999 High-income : Countries with per-capita GNP at more than $6,000
Sources: Prepared by the Environment on the basis of; Economic Cooperation Bureau, Ministry of Foreign Affairs, "Japan's official Development Aid 1991"; U. N. Development Program, "Human Development Report 1991"; and U. N. Population Fund, "State of World Population 1991"
3-2-1 Environmental Deterioration Amplified by Poverty
(1) Poverty and Environment
To take a bird's eye view of differences in wealth across the world, let us compare per-capita GNP by country in 1989. As against the average of $18,330 for OECD and other high income countries, it stands at $340 for countries south of the Sahara, $320 for South Asian countries, $540 for Southeast Asian countries and $1,950 for Latin American countries, suggesting that the differences are great (Table 3-2-2).
Table 3-2-2 Per-Capita GNP in the World by Region
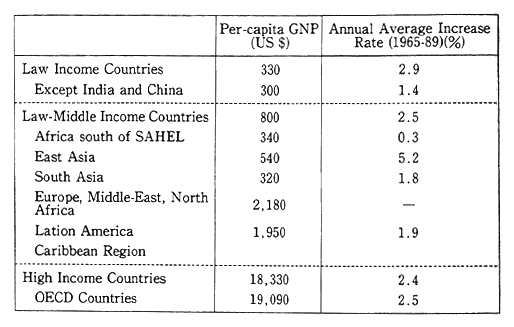
Source: "World Development Report 1991" World Bank
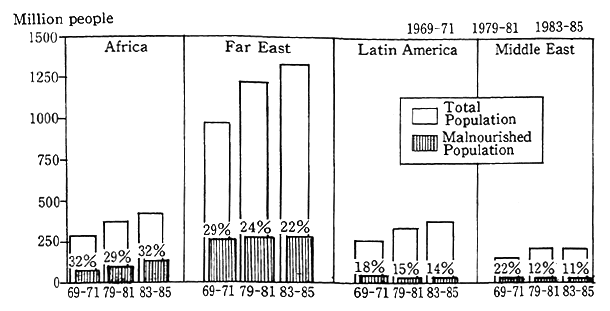
The Food and Agricultural Organization (FAO) has compiled statistical data on populations who cannot afford to secure necessary nutrients. In the 1981-85 period, 21% of the population of the developing world, or 512 million peop1e, were undernourished. The absolute number of undernourished people is greatest for Asia, and in terms of the share of undernourished people in the total population, Africa tops the list with 32%, suggesting that one out of every three persons is ill-fed (Fig. 3-2-1). Rises in food calorie supply indicate that the increase from the 1979-91 period to the 1986-88 period was 0.5% for developed market economies and a mere 0.2% for developing market economies. When it came to African countries, it dropped by 0.2%. The critical state of nutrition is not improved for areas in particularly desperate condition (Table 3-2-3).
Table 3-2-3 Daily Calorie Supply and Its Increase Rate 1969-71, 1979-81, 1986-88
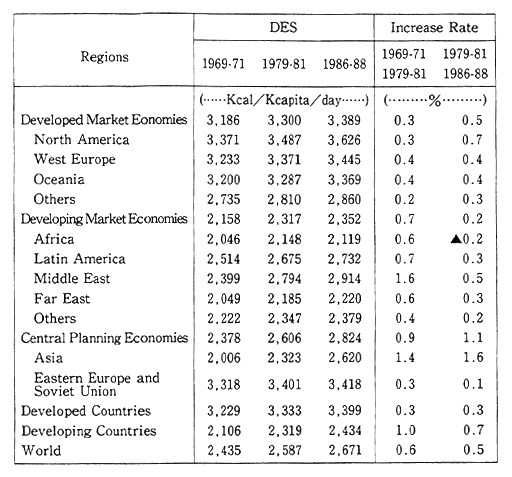
Source: FAO, "The State of Food and Agriculture 1990"
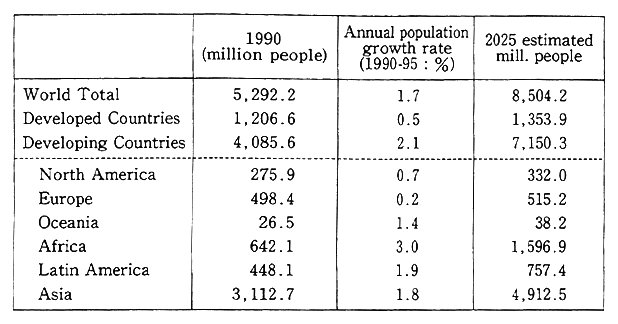
Poverty and population increase are both sides of the same coin. When population rises beyond limits which the traditional self-sufficient economy can sustain, then arise poverty and undernourishment. The U. N. Population Fund (UNFPA) projects the annual population increase from 1990 to 1995 at 3.0% for Africa, 1.9% for Latin America and 1.8% for Asia, as against 0.7% for North America and 0.2% for Europe, suggesting that it is higher for developing countries (Table 3-2-4).
Fig. 3-2-1 Malnourished Population in the World
Source: FAO, "The State of Food and Agriculture 1990"
Table 3-2-4 Estimated Population of the World
Source: 'The State of the World Population 1991" UNFPA
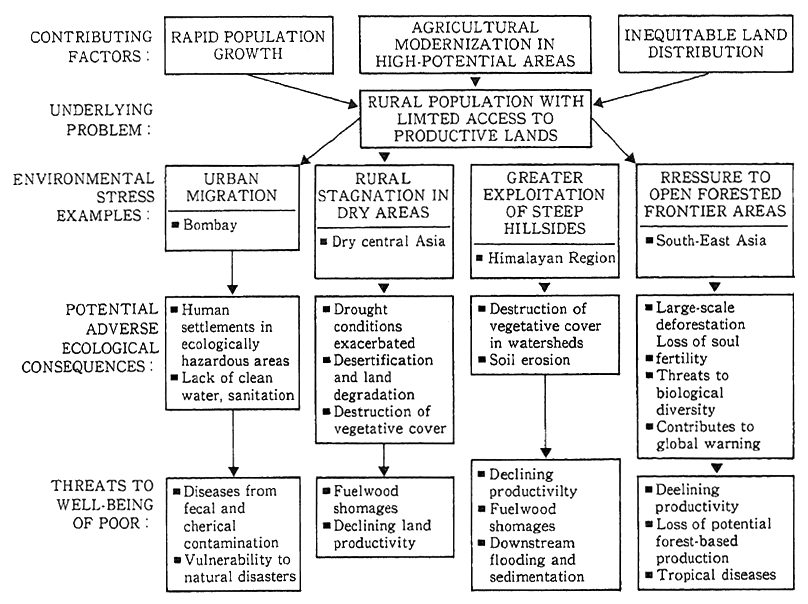
What sorts of impacts do such population rise and poverty produce on the environment? The U. N. Economic and Social Commis-sion for Asia and the Pacific (ESCAP) analyzed relations between poverty and the environment in the Asian-Pacific region. The findings say that people living away from their traditional places of residence in conjunction with population increases, inequitable land distribution and larger-scale farm management stemming from agricultural moderniza-tion, produce a wide variety of pressures on the environment (Fig. 3-2-2). The efforts to solve the population issue both at home and abroad must be backed up also in a perspective of environment conser-vation. The poor are compelled to engage in excessive cultivation, collection of firewood at environmentally sensitive areas such as arid places and steep mountains, illegally felling environmentally valuable forests for cultivation, or migration to urban areas to look for jobs, thereby producing a wide variety of impacts on the environment. In the following, let us check relations between poverty and the environment on the basis of some concrete examples.
Fig. 3-2-2 The Poverty and Environment Connection
Source: ESCAP, "The State of Environment in Asia and the Pacific 1990"
(2) Landless Peasants and Deforestation
Forests provide residents with fuel, food, building materials, cattle feed, etc., slow rainwater flow, check soil and effluence, keep the regional climate, such as the rain pattern, and offer habitats for fauna and flora, thereby becoming the basis for local residents' lives. Defores-tation has become a grave issue at various places. Against the back-ground, there lies poverty.
Let us take a look at the conditions and background of deforesta-tion in Nepal, one of the world's poorest countries, and Thailand, where development has progressed to a certain extent, as examples.
Nepal is an alpine country with its land spread over the Himalayan mountains and neighboring hillocks and plains. With its per-capita GNP standing at $170 (1989), Nepal is one of the world's poorest countries according to the U. N. definition. The primary indus-try is agriculture, which uses 39% of the country's work force and shares 52% of gross domestic product (GDP). Population is increasing at a fast pace, rising at annual rate of 2.34% (projected for 1990-95).
In Nepal, as population increases, people move to the plains, where previously people did not live due to malaria, and cultivate plots in the mountains and on the hillocks to make a living. As forests are felled, farms are opened on the steep slopes. As we will touch upon it later, firewood comes from forests and in this respect the deforestation is a grave issue. As forests are felled in this manner, landslides tend to occur on the steep slopes, causing floods. Frequent floods in Bangladesh are described as having been caused by the deforestation in Nepal and other upstream areas, and the problem spreads regionally beyond national boundaries.
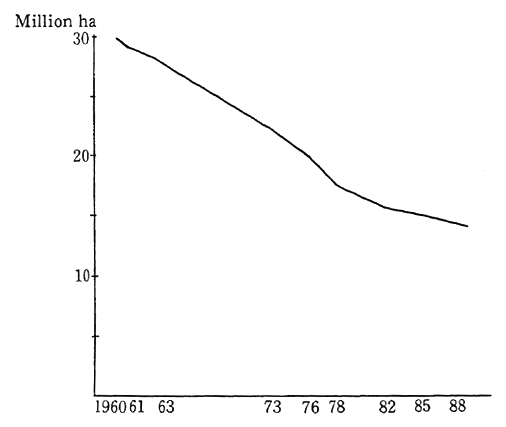
Fig. 3-2-3 Forest Area in Thailand
Source: Data from Royal Forestry Department "Thailand Country Report to UNCED"
Next, let us take a look at Thailand. In Thailand, more economi-cally developed though it is than Nepal, the economic gap between the urban and the rural areas is significant. In 1990, the income of a farmer was estimated to be one-tenth that of an urban worker. There are signs of a rise in the differential. Regionally, the income is highest for resi-dents in Bangkok and lowest for people in the northeastern region. This income imbalance gives rise to the same kind of issues on deforestation as in poorer countries. Thailand was once full of green, known as a country of forests. According to statistics of the Thai Royal Forestry Department in 1961, Thailand had about 290,000 square kilometers of forests, or about 56.7% of the national land. Thailand's forests rapidly depleted, dropping to 143,800 square kilometers in 1978, or a mere 28% of the national land. The Thai Royal Forestry Department projects that tropical forests depleted at an average annual 3,970 square kilometers from 1978 to 1985. This means that forests have depleted at an annual rate of 3% in the last decade (Fig. 3-2-3).
As a result, farmland has been damaged by floods, water-shortages, damage to agricultural land by salt and soil loss which arose from the deforestation. In November 1988, torrential rains it the southern part of Thailand, killing 350 people and destroying 55,000 houses. This disaster prompted the Thai government to ban the felling of natural forests. The area of districts where soil deterioration was observed stood at 172,000 square kilometers, or 22.7% of the total area of the national land, according to an FAO estimation (Table 3-2-5).
Table 3-2-5 Estimated Extend of Degraded Land for Sected Countries in the Asia and Pacific Region
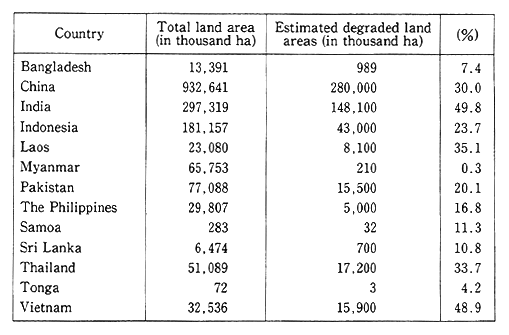
Note: Percentage of degraded land to the total land area is shown in parentheses
Source: FAD (1989) Environment and Agriculture "The State of the Environment in Asia and the Pacific 1990" ESCAP
Illegal commercial felling and clearing for farmland are cited as causes to deforestation in Thailand, but another significant factor is that poor peasants cleared forests and turned them into farm without special consideration given to the cultivation of fertility. Many of them are landless peasants, and they recklessly fell forests, cultivate cash crops, such as cassava and maize, while depending solely on the fertility of the forests, and when the fertility is gone, they simply fell other forests. This type of slash-and-burn cycle is short, unlike the traditional slash-and-burn cycle, in which felling, cultivation, abandonment, tree recovery and fertility cultivation are over a long span of time. With this short cycle, the land gradually deteriorates, without a full recovery of fertility. The Thai government estimates that about 80,000-90,000 square kilometers of forests have thus far been cleared by landless, poor peasants. This accounts for about half of the entire soil deteriorated portion of Thailand.
Fig. 3-2-4 Wood Extraction in the Asian and Pacific Region 1987
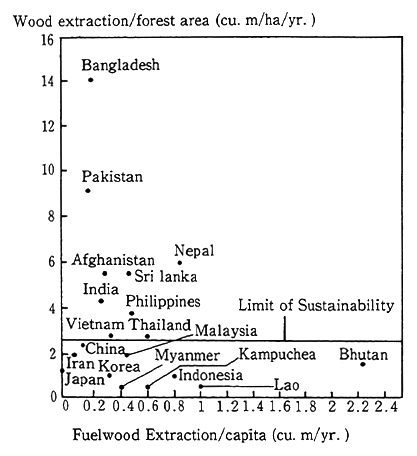
Source: FAO 1988 "Forest Products Yearbook" "The State of the Environment in Asia and the Pacific 1990" ESCAP
Yet another example of deforestation tied in with poverty, as is observed in monsoon and dry areas particularly west of India, is the felling of forests for firewood. The felling of forests exceeds the recy-cling capacity of forests in many countries (Fig. 3-2-4). Then there are many cases in which cattle dung is collected when it is no longer possible to collect firewood, but dung is more effective in maintaining fertility when it is used as fertilizer. The increase in its use as fuel, as will be stated below, will lead to an exhaustion of the farmland and its richness will go down as a stock.
(3) Increases in Rural Population, Soil Degradation and Desertification
Land is used for various purposes, but its use as a place for food production, such as farms and pastures, is important. For such land utilization as farms and pastures, however, people are compelled to take methods which will deteriorate land resources, depending on the condi-tions of poverty in the local area, and those methods will lead to a disruption of the environment, thus aggravating the lives of local people in a vicious cycle.
Desertification is significantly observed in the Sahel region, Africa, as we have seen in Chapter 1. According to data released by the U. N. Environment Program (UNEP) in 1992, the arid areas (according to the definition contained in UNEP reports) which exist in Africa measure 19,590,000 km2, or 65% of the total area of the African conti-nent. In the remaining two-thirds which excludes extremely arid areas, about 400 million people live, or two-thirds of Africa's population (Fig. 3-2-5).
Of those arid areas, 73.0%, or 10,458,400 km2, used as cropland or rangeland, is more or less affected by desertification. (Fig. 3-2-6) Moreover, of Africa's arid areas, 3,554,000 km2, or 18.1% is affected by soil degradation, such as soil erosion, topsoil dispersion and damage from salt. As Japan's national land measures about 378,000 square kilometers, it follows that about 38 times the area of its national land is exposed to desertification and about 9.4 times to soil degradation.
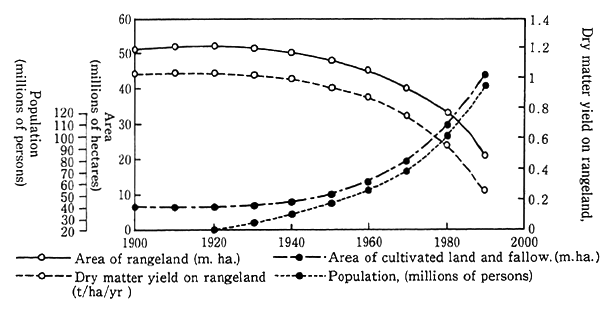
According to the UNEP report, it is pointed out that Sahel's population rapidly increased from l900 to 1990, the productivity of rangeland per unit of area decreased (Fig. 3-2-7). As population in-creased, so did demand for firewood, grains and livestock products. For this reason, the poor were in need of much more firewood, graze cattle in excess of the renewability of rangeland, shortened the cultivation suspension period or cultivated less productive areas. As a result, forests and rangeland degenerate, thus dropping their productivity per unit of area. As their recyclability is low, they tend to be affected by drought as a result of the soil degeneration, creating desertification. Not rich enough to secure substitute fuels and raise productivity, those people are forced to live in areas where the acceptability of the environ-ment is exceeded and the conditions are worse, and that is an important factor responsible for desertification. Besides, the rise in the saline concentration of farmland which is caused by improper irrigation is also pointed out.
Fig. 3-2-5 Dry Land in Africa (Assessment 1991)
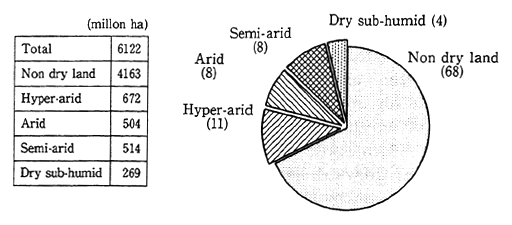
Note: Percentage of each area to total land area the United Nations in shown in parentheses.
Source: "Status of Desertification and Implementation of Plan of Action to Combat Desertification" 1992 UNEP
Fig.3-2-6 Status of Desertification of Agriculturally Used Dry Land in Africa
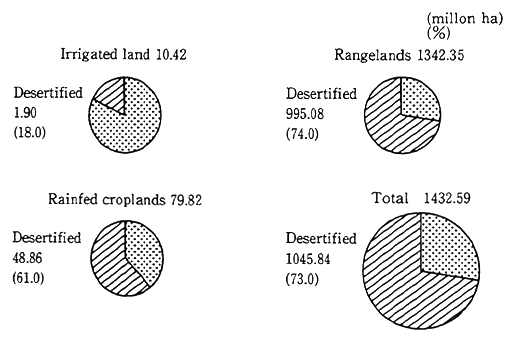
Source: "Status of desertification and Implemetation of Plan of Action to Combat Desertification" 1992 UNEP
Fig. 3-2-7 Evolution of Human Population, Land Use and Productivity of Rangeland in North Africa between 1900 and 1990
Source: "Status of desertification and Implementation of Plan of Action to Combat Desertification" 1992 UNEP
With a peak in 1985, 30-35 million people have been affected by droughts in 21 African countries, about 10 million of them have been forced to migrate as "environmental" refugees. As though they were an annual event, droughts take place somewhere on the African continent, but large-scale droughts in 1968-73, 1983-85 and 1990-1991 unexceptiona-bly occurred in the Sahel region. Those droughts are not of such a nature that they would lead directly to desertification, should there be a local preparedness and appropriate responses, but in areas where those actions can hardly be taken like Sahel, desertification would be accelerated and "environmental" refugees would result.
(4) Urban Poor and Degradation of Environment
In developing countries, the existence of poverty is not confined to the countryside. In cities, too, poor people are concentrated, and they are living in such a manner that they tend to be affected by environmen-tal degradation.
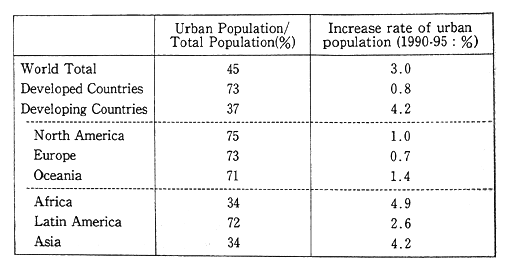
In 1991, the rate of urban population stood at 45% in terms of the average for each country of the world. The average rate came to 73% for developed countries and 37% for developing countries, and the share of urbanites in developing countries' population was never great. From 1990 to 1995, however, the urban population increase rate is projected at 0.8% for developed countries and 4.2% for developing countries. By region, the increase is high for Africa with 4.9% and for Asia with 4.2% (Table 3-2-6). Particularly in the Asian-Pacific region, the development of major cities is conspicuous. A check of cities with a population of more than 4 million indicates that there were five such cities in 1950, including Tokyo, Shanghai, Budging, Calcutta and Tianjin, but the number increased to seven in 1960 and 21 in 1990 and it is projected that it will reach 28 with a combined population of 200 million.
Table 3-2-6 Urban Population of the World (by region)
Source: "The State of World Population 1991" UNFPA
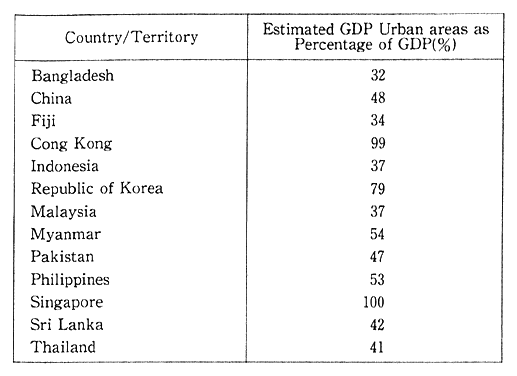
This increase of urban population stems from migrations from the countryside. Urban economic performance is more brisk than in the countryside. The share of urban GDP to overall domestic GDP is high, 54% for Myanmar and 53% for the Philippines (Table 3-2-7). Poor though they are, the poor can more easily live in cities than in the countryside as they can readily have access to a cash income. Those people are too poor to maintain an appropriate living space, so that they live in environmentally poor areas in many cases. On the rate of the poor in the urban population, there is a projection by the World Bank, according to which Bangladesh comes on top of the list with 86%. For low-income countries, the rates are roughly more than 20%, and among medium-income countries, there are countries like the Philippines, for which the rate exceed 30% (Table 3-2-8).
Table 3-2-7 Estimated GDP from Urban Economies in Selected Countries and Territories in ESCAP Region (1985)
Source: ADB Key Indicators 'State of the Environment in Asia and the Pacific 1991" ESCAP
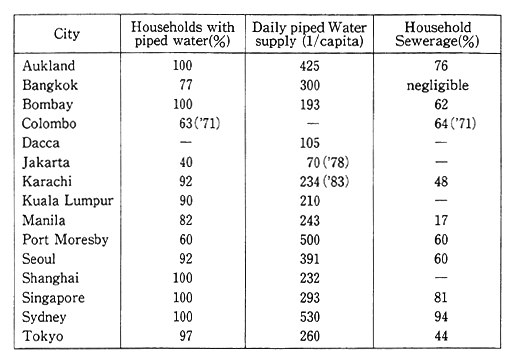
For those people, tap water and sewer systems are not available and they cannot have access to clean water, the most essential need for human. The development of infrastructures, including sewer systems and waste disposal plants, does not catch up with the rapid development of cities and they are lacking in many areas of the cities, to say the nothing of being equipped in slums and other places. Therefore, there is a decisive shortage of basic services, such as tap water systems, sewer systems, drainage, roads, health care and education (Table 3-2-9). In those areas, trash and waste water discarded in rivers and water channels, thereby giving rise to water pollution and disease and deterior-ating the living environment of the poor who cannot live in other areas. The poor in cities are directly affected by an degradation of the environ-ment, Moreover, the conditions in which they live deteriorates the environment in a vicious cycle.
Table 3-2-8 Urban Poverty in Selected Countries of ESCAP Region
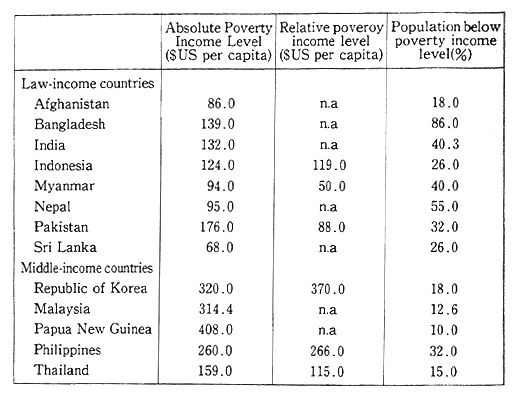
Note: The poverty levels shown in this table are defined as follows the income level of absolute poverty is that below which a minimal nutritionally ade-quate diet plus essential non-food requirements is not affordable. The rela-tive poverty level is that less than one-third of the per capita personal income of the country. Estimated population below the poverty income level is that portion of the population which is either "absolutely poor" or "relatively poor". whichever is greater.
Source: World Bank (1985), Asia Development Bank "State of the Environment in Asia and Pacific 1990" ESCAP
Poverty is a significant cause of issues on the environment, Poverty in the countryside degrades natural resources and deteriorates the environment, including forests, water sources, croplands and ran-geland, and the poor become all the poorer. On the other hand, poor urbanites are compelled to live in environmentally poor conditions and pose problems on water pollution and wastes, on the one hand, and their lives are threatened by those issues, on the other.
Table 3-2-9 Access to Safe Drinking Water and Sanitation Services in Selected Cities
Source: U. N. "Human Settlements Atlas, Part 3" 1985; "State of the Environment in Asia and the Pacific 1991" ESCAP
3-2-2 Ongoing Environmental Disruption in Economic Development
(1) Development of Export-Oriented Agriculture, Forestry and Fisheries and Environmental Issues
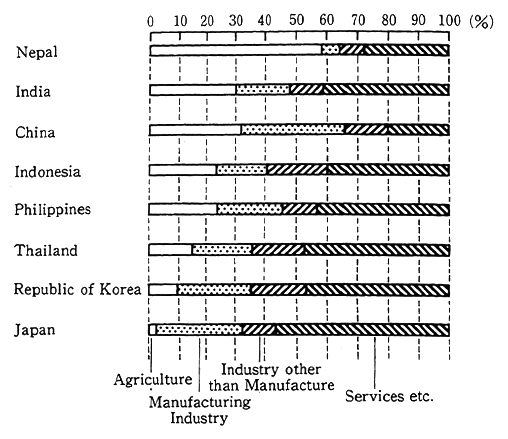
Agriculture, forestry and fisheries are of importance not only for least less-developed countries (LLDCs) but for developing countries as well. There are only a few countries in the group of developing countries where the share of the agriculture sector in GDP exceeds 10%. Only in several developed countries, is the rate of the agricultural sector to GDP several percent (Fig. 3-2-8). The importance of agriculture may be assessed by the share of agricultural productexports to total exports. That share is rapidly going down for countries which are being economi-cally developed in a successful manner. Even so, the rate is 10% to several tens of percent, and they are important export items. The production and sales or exports of agricultural, forestry and fishery products are significantly instrumental in economically growing devel-oping countries.
Fig. 3-2-8 GDP by Industry in Selected Coun-tries
Source: "World Development Report 1991" World Bank
Should the production of agricultural, forestry and fishery prod-ucts not be properly expanded, there will be cases in which significant impacts are produced on the environment. One of the cases in point is the cultivation of sugarcane, and let us look at Fiji as an example.
For Fiji, sugar is the major export item for the acquisition of foreign currency. On the other hand, mention is made of soil loss from sugarcane plantations in the ESCAP report on the environment. From some fields, 15-20 cm of topsoil was lost, which corresponds to 34 tons perhectare a year. In the case of a new sugarcane plantation cleared from grassland, 8 to 14 cm of topsoil was lost before the first harvest, which corresponds to 90 tons per hectare a year. This meant the loss of topsoil which contained organic matter and nitrogen with the aluminum content rising to a level harmful to the growth of plants. The maximum soil erosion in the tropical region is generally rated at 23.5 tons per hectare a year. It exceed that level in the case of the cultivation of sugarcane in Fiji. The improper cultivation of export crops leads to soil erosion, and cultivation and land utilization which would not give rise to such degradation of the environment is necessary for sustainable agri-cultural performances.
A similar case may also be observed in the rapid development of the raising industry. In the Asian-Pacific region, the culture of shrimp is brisk. As raising is fit for brackish waters in coastal areas, the press is high on development along the coast. In Thailand, for example, there exist 185,000 hectares of mangrove forests, but over a period of only 15 years from 1975 to 1989, 132,000 hectares, which corresponds to the area of mangrove forests remaining today, has beenlost. Half those man-grove forests are reserved for the raising industry. In the Philippines 210,000 hectares of culture ponds are prepared. The mangrove forest is a treasure-house of wildlife. Seventy-four of the world's 79 known mangrove species inhabit Thailand's mangrove forests withthe habita-tion of 35 species of mammals, 106 species of birds and 25 species of reptiles. The world's largest mangrove forest exists in Sundatbans, Bangladesh. The expansive mangrove forest measuring 571,508 hectares is inhabited by 25 species of mangrove trees, 32 species of mammals, 186 species of birds, 35 species of reptiles, 8 species of amphibians and more than 120 species of fish. The loss of mangrove forests will result in distracting such rich ecosystems and reducing the rich production of fish in the surrounding areas which have been sustained by ecosystems in mangrove forests. And the costal areas which are protected by man-groves will be endangered by high tides, etc.
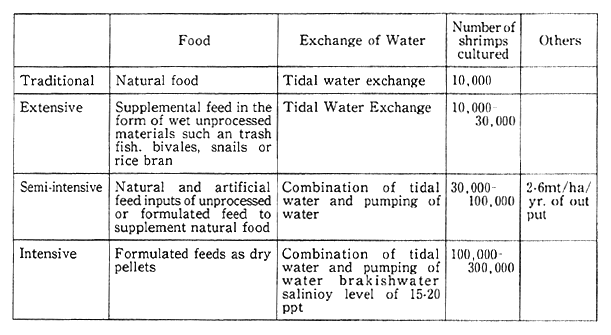
The adverse impacts produced by the improper raising of shrimp do not end merely with adestruction of mangrove forests. The culturing of shrimp is conducted in an intensive manner byadjusting salinity, blending freshwater with seawater and by hatching bait (Table 3-2-10). The intensive culture makes it necessary to draw up groundwater to mitigate the salinity of seawater, and deteriorates the discharge from the hatcheries by excessive bait, dung and metabolites. Thus, it will lead to nearby land subsidence with groundwater excessively drawn up, salinization of groundwater and pollution of the water quality by discharge from the hatcheries. In some areas of Thailand, a ban on pumping up groundwater for the culture of shrimp. If it becomes too intensive, the output of shrimp itself will drop. In Taiwan, for example, the output of cultured shrimp stood at a mere 14,00 tons in 1977 but rapidly rose to 80,000 tons in 1987 But in 1988 shrimps werekilled in enormous numbers with output rapidly dropping to 30,000 ton . In 1989, it was pegged at 25,000 tons. One of the causes is described a water pollution by heavy metals and organic matter in Taiwan's costal areas, and yet another reason is said to be that the water and bottom sediment of hatcheries deteriorated and diseases spread as raising was done in an extremely intensive manner. In situations where shrimp with high value added are cultured without full consideration to the environment, not only will the surrounding environment be deteriorated but theraising businesses themselves will hamper their own otherwise sustainable development.
Table 3-2-10 Example of Intensity in Shrimp Growout System
Source: Honculada Promavera, 1990 "Fish health Management in Asia-Pacific: Report on a Regional Study and Workshop on Fish Disease and Fish Health Management" ADB Aquaculture Department Report Series NO.1 1991
Not just shrimp raising but sea-surface fisheries are simple means to have access torichness, For example, Thailand is a prominent exporter of canned tuna in the world. The tunahauled by Thailand's, ships and imported from foreign countries is processed and exported to Japan and other countries to earn foreign currency. In recent years, nonetheless, marine resources in the waters near Thailand, such as the Gulf of Thailand and offshore of the Isthmus of Kra, havedepleted, and the Thai government is forced to conduct diplomatic talks to secure the right to fishing offshore of Myanmar. Here, again, the depletion and deterioration of stocks is observed.
(2) Industrial Development and Environment Problems in Developing Countries
Industrial development is a centerpiece for the development of developing countries. A review of the rises in GDP rates of NIEs, whose economic development is described as most successful, and their compo-nent rates indicates that the position of agriculture, forestry and fish-eries has generally decreased, and mining and manufacturing industries --particularly, the manufacturing industry--have increased. On the other hand, a number of problems are pointed out as they have cropped up with no appropriate consideration given to environment conservation in the development of industry.
First, let us see the problems of water. Water pollution sources have rapidly increased in proportion to industrialization. For example, the number of industrial plants responsible for water pollution in Thailand increased from 159 in 1969 to 5,393 in 1979 and further to 20, 221 in 1989, rising 127 times over the two decades from 1969 to 1990 (Table 3-2-11). Factories which had increased in this fashion emitted 525, 235 tons of BOD. Of all the effluent, only about 70% was treated.
Table 3-2-11 Number of Polluting Industries in Thailand

Note:1. The total air and water polluting industries excludes those which come into both categories, to avoid double counting. 2. Only factories producing large and moderate quantities of hazardous waste are reported.
Source: "Thailand Country Report to the UNCED 1992" Thailand government
China is in the same boat. In 1989, 35.5 billion tons of waste water was discharged, including 25.5 billion tons (71.8%) of industrial waste water. Of this quantity, 80% was discharged into rivers, lakes and reservoirs and seas without treatment. For this reason, water pollution by toxic chemicals and heavy metals accelerated, and a 1988 survey indicates that 436 of 532 rivers were polluted. The Chinese government has taken measures against water pollution on a priority basis, stepping up the treatment of industrial waste water. The quantity of treatment and the rate of achieving waste water standards improved, but the treatment of industrial waster stood at only 32% (1990), suggesting that much more waste water was discharged without treatment(Table 3-2-12).
The same thing may be said of air pollution. As is the case with water, a check of Thai data reveals that the number of industrial plants registered as responsible for air pollution rose from 68 in 1969 to 26,235 in 1989. From those plants, 208,500 tons of S02, 70,000 tons of nitrogen oxides and 351,000 tons of suspended particulate matter were emitted. The principal source for the discharge of those pollutants is the nonfer-rous industry (Table 3-2-13).
Table 3-2-12 Industrial Liquid Waste Treatment in 1981-1990 of China
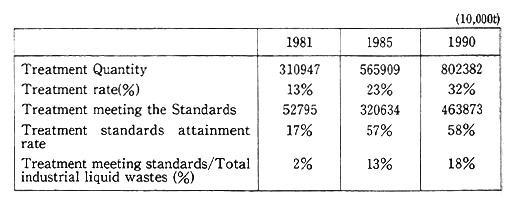
Source: "National Report of the People's Republic China on Environment and Development" 1991 Chinese Government
Table 3-2-13 Emissions from Major Polluting Industries

Note: Percentage share of total industrial emissions. The non-metal industry includes cement manufacture, glass, cermics, etc.
Source: Thailand Development Research Institute 'Thailand Country Report to the UNCED 1992" Thailand Government
Moreover, yet another outcome of such industrialization is the increase of industrial wastes. The composition and administrative definition of industrial wastes and hazardous wastes differ, depending on the nation, but in Hong Kong in 1987, 1,200 tons of industrial wastes a day (about 438,000 tons a year) were generated, including 270 tons of chemical wastes a day (about 100,000 tons a year). It is projected that the discharge of chemical wastes is increasing at an annual rate of 2-3%. In Singapore, where an urban economy has developed as is the case with Hong Kong, 28,180 tons of hazardous wastes were discharged from 2,188 factories in 1985. In Malaysia, 220,000 cubic meters of hazardous wastes were discharged from industrial plants in the peninsular region in 1985. In Thailand, the number of factories discharging hazardous wastes increased from 248 in 1969 to 17,056 in 1989. The amount of noxious wastes almost doubled from 1,151,629 tonsin 1986 to 1,993,602 tons only five years later. For treatment of such industrial wastes, some industrial waste treatment plants have been installed, but when it comes to PCB and other chemicals whose treatment is difficult, some countries are not equipped to domestically process them, so treatment abroad is required, or industrial wastes coming out of small-scale factories (like small plants in town) are not properly treated.
Such acute cases of environmental pollution may be observed in the Republic of Korea(ROK). According to the White Paper on the Environment released by the ROK government, thedevelopment of the ULSAN nonferrous metal and ONSAN petrochemical industrial parks, situated along the nation's eastern coast, began in 1962 and 1974, respec-tively. With an aggravation of pollution, heavy damage was inflicted on agriculture and fisheries, and disputes over the pollution flared up one after another. Even compensation to farmers and fishermen did not help calm down protesters, and residents around the industrial parks had to be moved out to unaffected areas on alarge scale. No reports are available on the causes of the damage and the casual sequence itself. The exodus took five years from 1986, involving 34,533 people in 7,153 families and costing 333.7 billion won (about 57,630 million yen) (Table 3-2-14). The scale of this project was by farlarger than that of the transfer of pollution affected families done in Yokkaichi, Kawasaki and Kita-Kyushu cities in Japan. It might be said that a problem posed by industrialization came outin extreme form.
Industrialization raises incomes for corporation and workers and the government's financial revenue. Unlike situations where environ-mental resources are sold bit by bit for living simply because of poverty, businesses and government whose incomes have increased might invest resources in the conservation of the environment. But judging from Japan's experience, it is moreuseful to start taking environmental measures in the early phase of economic growth and further strengthen-ing of environmental measures is desired.
Table 3-2-14 Progress of Project for Measures on Moves to Ulsan and Onsan Industrial Parks in the Republic of Korea
Source: ROK Environment Ministry: "White Paper on the Environment 1990"
(3) Development of Urban Activities and Environmental Problems
In developing countries, there are signs that commerce and ser-vice and various other industries are concentrated in cities. The eco-nomic performances concentrated in cities enrich them and at the same time give rise to a wide variety of environmental problems.
Cities in developing countries are without exception bothered by air pollution, as we have seen in Chapter 1. One reason is that poor performance auto mobiles are used in enormous numbers. In China, for example, the number of automobiles, which stood at about 1.8 million in 1984, rose more than two times to 4,120,000 in 1987 In the ROK, too, it rose from 9,480,000 in 1984 to 16,110,000 in 1987 (Table 3-2-15). The use of secondhand automobiles and the leniency of restrictions constitute major reasons for urban air pollution. In Hong Kong, for example, there were about 17,000 automobiles in 1989 inspected as ones which had exhausted black smoke. As a result of the inspections, the registrations of about 500 automobiles are canceled (Table 3-2-16). Because there were about 300,000 automobiles in Hong Kong, it meant that 7-8% of them were running there emitting black smoke. Such an inspection is not conducted in almost any other country.
Beside industrial plants, emissions from households are yet another major cause for air pollution. In China, for example, coal with a high percentage of sulfur is used as household fuel. As the chimneys are short, the concentration of sulfur oxides gets particularly high in the heating season.
Table 3-2-15 Country-Specific Number of Automobiles Owned in Asia
Sources: Ministry of Transport: "Overseas Transportation Statistics": "State of the Environment in Asia and the Pacific 1990" for Hong Kong.
Table 3-2-16 Statistics for the Vehicle Smoke Control Program in Hong Kong

Source: "Environment HONG KONG 1990 : White Paper-pollution in HONG KONG-A Time to Act". Environment Protection Department of HONG KONG.
Cities discharge enormous quantities of wastes. The collection of wastes in Singapore, for example, rose from 1498.50 tons in 1984 to 1, 979,40 tons in 1989 In 1985, the discharge of wastes per-capita stood at 344 tons in Japan but was fairly high for Singapore with 585 tons,while that of the ROK was roughly the same as Japan with 396 tons. The collection and treatment of wastes is properly done in Singapore, but such collection services are not necessarily developed in other countries, and wastes are illegally dumped into urban rivers and seas. Such illegal dumping gives rise to water pollution and a deterioration of the environ-ment, directly hitting areaswhere the poor live. This issue might be described as lying behind the wealth of cities.
(4) Development Strategy and Environmental Administration in Developing Countries
The production of agricultural products and the development of industry are stepped up by the activities of people who intend to become economically rich with the production of cash merchandise. Southeast Asian countries might be described as successfully taking this direction and, in particular, stepping up the development of export-oriented economies. But, as we have just seen, there are cases in which due consideration is not given to the environment, eventually tearing apart the basis of industry. Environmental measures are wanting in industrial production, natural resources are used in an excessive and plunderous manner and pollution is caused by rapid urban sprawl, because each economic entity gropes for immediate profits and it is hard to take action with consideration given to the environment. Another reason is that the importance of environment conservation and the knowledge about damage caused by a deteriorated environment are not necessarily disseminated to the full among government officials and entrepreneurs.
From a UNEP survey in 14 countries in Africa, Asia, Latin America and Europe in 1988, people in each country are conscious about protection of the environment. But, asked if the respondents agreed with the view that "it is so difficult to live in this country today that whatever happens to the environment has nothing to do with me", 58% of the ordinary persons and 49% of the leaders in Africa said yes, and in terms of the world average, about 40% said that environment conser-vation was not necessarily a matter of primary interest.
Against the background of such consciousness, policies in which little consideration is given to the environment and which might there-fore lead to a deterioration of the environment are seen. For example, there are some cases in which tax incentives are given and the owner-ship of developed plots ins given free of charge to encourage people to take part in the exploitation of wilderness. In case these incentives do not work as the governments expected, the settlers whose number is in excess of the carrying capacity of forests, converge on them, open up forests and make excessive use of the soil. Finally, in some cases, the soil deteriorates and the development projects do not work out the way they were expected. The felling and opening-up of forests sometimes develops at a rapid pace without consideration for the native people. It might be said that in making judgments on a policy, there is the need to take full account of what sort of meaning that policy has for the environment.