

Quality of the Environment in Japan 1992
(3) Actual expenditure, burden and funding of pollution prevention investment by businesses
1) Expenditure and burden of pollution prevention costs
It is very difficult to determine generally how and to what degree pollution prevention investment impacts business performance, since the views of top management and the financial bases of the industry sectors and individual companies are different. Thus an evaluation on the degree of pollution prevention investment by industry types was tried based on an assumption. The calculation of pollution prevention invest-ment excludes the costs for the measures which are not directly involv-ing the facility investment, e.g., the expenditures of energy source conversion and research and development, for lack of available data. Using available statistics on the initial investment amount for pollution prevention facility, the total pollution prevention cost was estimated assuming the sum of the pollution prevention investment consists of the facility depreciation (annual 10%), average interest rate (annual 10%) and operating cost (annual 20% of the facility investment). The evalua-tion was made for major industry sectors (only those enterprises with 10 billion yen or higher in capital). It should be noted that the evaluation results were not derived from the accumulation of the costs of individ-ual plants.
The evaluation result is as shown in Fig. 2-3-17, and it can be understood that the portion of pollution prevention investment in the industry sectors with potential pollution generation, particularly around 1975, was as large as a half of the profit when no pollution prevention measures were undertaken.
It is said that "public pollution elimination has progressed as the result of strenuous struggles made by the enterprises" and the situation around 2197.5 was quite similar to that expression. The enterprises made every endeavor in a short period of time to suppress the exhaust of pollution material, sacrificing business profit in order to meet the requirements of governmental regulations.
It can also be said the prior pollution prevention investment was insufficient. As shown in Fig. 2-3-17, the profit rate of enterprises was still high in the first half of the 1960's and the later half of the 1970's in spite of pollution prevention investment. If an appropriate amount of investment had been made during the high growth age, environmental deterioration could have been prevented, and the burden of pollution prevention for businesses could have been lighter. It is necessary to pay attention to pollution elimination while the economic circumstances are good and it is far more effective.
Fig. 2-3-17 Rates of Profit Drops by Added Outlays for Pollu-tion Prevention
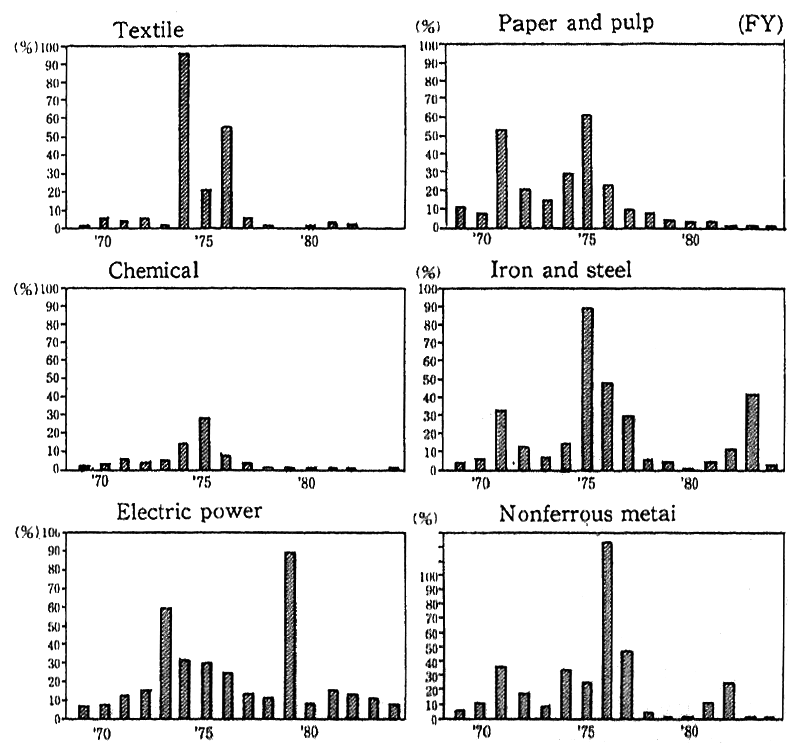
Source: Prepared from the Yearbook of Corporate Statistics and the Japan Development Bank' "Survey on Trends in Investments in Facilities and Equipment".
Notes; Rate of profit drops by added outlays for pollution prevention =added outlay for pollution prevention,/(added outlay for pollution prevention +pretax net term profit). Added outlay for pollution prevention =depreciation cost for investment in pollution prevention (depreciated at a fixed rate of 10% a year) + interest (10% a year) +operating cost (20% of the amount of initial invest-ment for all the year).
The degree of impact of pollution prevention costs to business performance differ by industry types as well as business sizes.
For example, according to a survey "the impact of pollution prevention investment by financial analysis" conducted in 1980 by the Consultants Association of Small and Medium Enterprises sponsored by the Metropolitan Environmental Science Institute, there is a correlation between enterprise size and business impact. The smaller the size, the larger is the degree of negative business impact by pollution prevention investment, judging from "the profit analysis items" which indicate the profit sizes and "the financial fluidity analysis items" which indicate the stability of enterprise. With larger businesses, the burdening and absorp-tion power of the pollution prevention costs is larger so that the impact is not prominent on the financial sheets (Table 2-3-10).
As a typical example of the relationship between pollution pre-vention costs and the burden of large-size enterprises, let's look at the electric power industry which consists of only large size companies. As can be seen from an estimate of financial impacts of the pollution-related cost to the business of 9 electric power companies in 1975 (Fig. 2-3-18), it was a serious concern that public pollution regulations would severely impact business profits. However, the trends of business profits which followed (actual figures) showed a steady growth in spite of a series of regulations, except during economic depressions just after the oil crises. The fact that there was a difference between the estimate which was made in the middle of regulatory enforcement and the actual figures indicates that pollution prevention costs did not negatively impact the business performance of companies, as the costs were absorbed through improved business operation such as rationalization, offering of value-added services, transfer of the cost to prices, and cost/ performance improvement of pollution elimination plants and facility. As result, for large-size companies with large amounts of management resources and many other choices, the initially anticipated financial burden was not realized. This experience indicates that the expenditures for pollution prevention measures implemented along with economic growth can be justified by the economic fruits produced by the growth itself.
2) Financing of pollution prevention costs
When economic circumstance were good during high economic growth periods and before the oil crises, businesses could invest in pollution prevention with internal reserves plus low interest rate loans. On the contrary, under the circumstance thereafter when internal reserves decreased due to profit decline caused by oil crises and interest rates were high because of a series of total demand suppression policies, it was very difficult to get external funding to finance "unproductive" pollution prevention, particularly for Japanese companies originally with a low ratio of owners' equity (Fig. 2-3-19). However, it was necessary to implement pollution prevention relying upon externally available funding in order to meet the requirements of regulations after 1970.
Table 2-3-10 Indices of Degrees of Influence by Items of Profitability Analysis
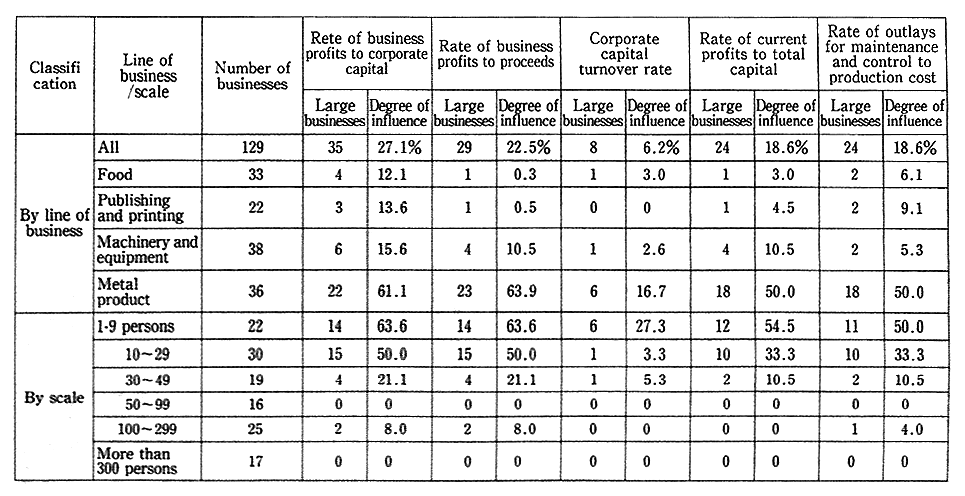
Source: The degree of influence represents the balance between the normal rate and the special rate. When the balance is great, the of is great, and the rate of greatly affected businesses is used as the yardstick for the degree of influence. 21. Source: Tokyo Metropolitan Enuironmental Science Research Institute
Fig. 2-3-18 Impacts of Strengthened Environ-mental Controls on Profit Rates (Electric Power Companies)
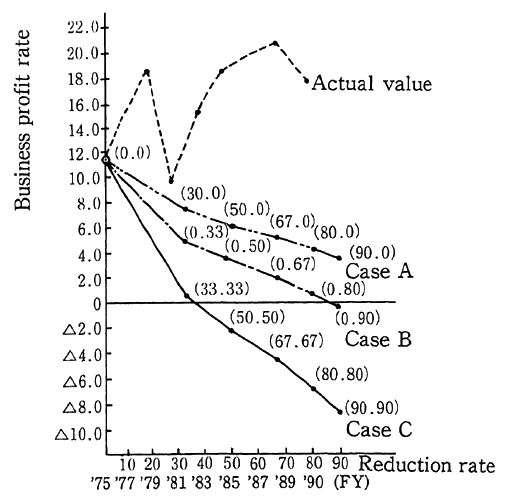
Sources: Prepared from the survey commission by the Ministry of International Trade and Industry (1975) and the Japan Development Bank's "Survey on Trends in Investments in Facilities and Equipment.
Notes:1. Case A: Projected business profit rate only with SOx controlled
Case B : Projected business profit rate only with NOx controlled
Case C : Projected business profit rate both with SOx and NOx controlled
2. The projected business profit rates repre-sent in situations where it is hypothesized that the electricity charge (Y1O.41/KWH) prevailing in 1975 remain intact.
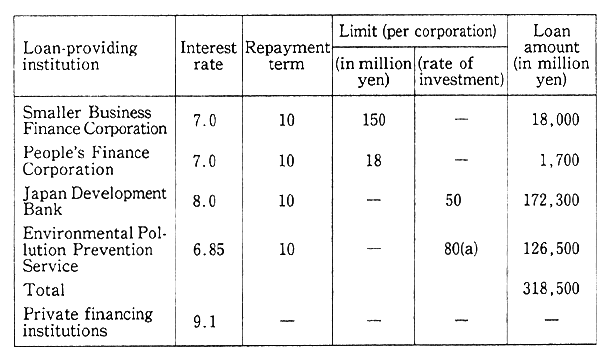
As private commercial banks were not necessarily willing to finance unprofitable pollution prevention investment, loans to business from so-called special banks, i.e., project investment type banks or government-sponsored financial institutions, were helpful to support financing of anti-pollution investment. Looking at the relationship of the financed amount with pollution prevention investment, we see that the rate of financing against the sum of pollution prevention investment had significantly grown, while the rate of financing for facility investment by the special banks compared to facility investment had not much changed (Fig. 2-3-20). It is evident that enterprises were largely depen-dent upon the long-term loans of lower interest rates from the special banks to support pollution prevention investment (Table 2-3-11). This indicates that policy considerations are effective to avoid an obstacle to financing pollution prevention.
Fig. 2-3-19 Indices for Assessments on Fund Raising
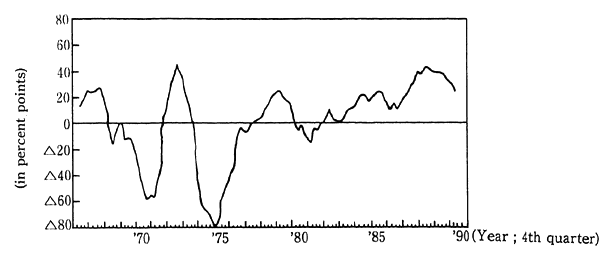
Source: Band of Japan: "Short-Term Economic Observation of Major Businesses".
Table 2-3-11 Plans for Special-Interest Loans for Investment in Pollu-tion Prevention in Japan
Sources: "Environmental Policies in Japan" (OECD 1977) and data from the Bank of Japan.
Note a. The rate is 50%, depending on the case.
Fig. 2-3-20 Rates of Loans for Pollution Control by Government Af-filiated Banking Institutions
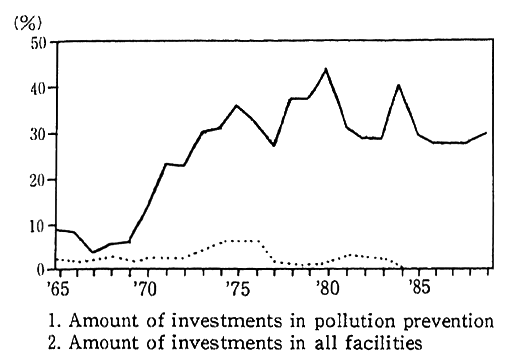
Sources: Japan Development Bank "Survey on Trends in Investment in Facilities and Equipment"; Ministry of Interna-tional Trade and Industry "Survey on Trends in Investment in Facilities and Equipment".
Note: The rate of loans by government-affiliated banking institutions to all investments in pollution prevention is the rate of the total amount of pollu-tion prevention-related loans by the Japan Development Bank and the Envi-ronmental Pollution Prevention Ser-vice Corporation to the amount of investments in pollution prevention shown in the above survey performed by the Ministry of International Trade and Industry.
Though the businesses could temporarily rely upon low interest loans, they had to bear the cost of pollution measures in the end in a form of long-term payment. Then how could the enterprises bear the cost?
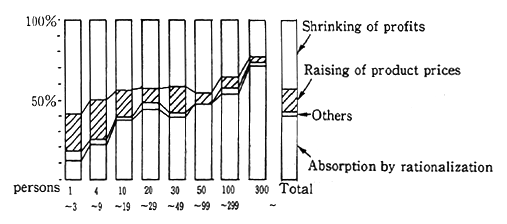
First, the cost could be transferred to product prices. It is rather difficult to distinguish the price shift portion of the cost due to pollution control from price hikes caused by inflation (e.g., influenced by higher energy prices and demand/supply constraints of commodities) due to oil crises, since the active investment period for pollution prevention overlapped with the economic turmoil following the oil crises. However, according to a survey (previously mentioned) of "the measures to cope with pollution related cost increase" among private enterprises made in Tokyo, though there were differences by industry sector, generally those enterprises with high costs responded that "profits were squeezed" or "transferred the cost to prices," but the enterprises with lower costs indicated that the cost was absorbed by savings of other expenses and not much was transferred to prices (Fig. 2-3-21). When viewed by size of the enterprises, large-size enterprises absorbed the cost by rationali-zation of business operation, but small-size enterprises had to squeeze profits or transfer the cost to prices. For small-size enterprises with no room to save other expenses, which could not absorb the investment cost for pollution prevention by their management effort, the invest-ment posed a heavy burden. According to a survey by the Small and Medium Enterprises Agency, absorption of pollution prevention costs by rationalization and sales increases occurred more than expected, but the cost transfer to prices could not be made easily from the economic circumstance at that time (Fig. 2-3-22) . The anti-pollution policy, in allocation of control responsibility applies, relatively heavier regulation criteria or specifications to large-size plants in general, and lighter criteria to small-size plants (Fig. 2-3-23). Also in strategic policy financ-ing, special consideration was paid to small and medium enterprises. This was made so taking into account a graduated scale merit of larger plants in pollution prevention measures. It was revealed in a study made later that special consideration was appropriate in planning the anti-pollution policy.
Fig. 2-3-21 Measures to Cope with Cost Increases by Installation of Pollution Preven-tion Facilities and Equipment
Source: Tokyo Metropolitan Environmental Science Research Institute : "Questionnaire to Businesses in Tokyo (1998)"
Fig. 2-3-22 Methods to Cope with Rises in Pollution Prevention Costs
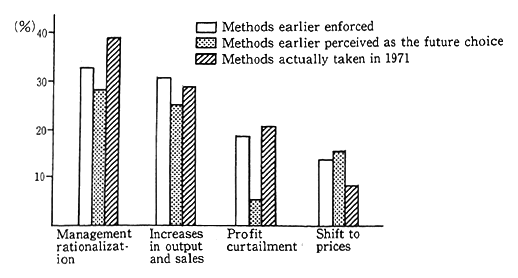
Source: "Fact-Finding Survey on Environmental Issues" made by the Small and Medium Enterprises Agency in November 1971.
A severe squeezing of business profit may result in social loss in forms of reduced share dividend, labor remuneration, and investment for future technological innovation. It is important to analyze the scope of social loss in the national economy. It is desirable that pollution prevention costs were transferred to product and service prices. It is highly expected in practicing pollution prevention measures that changes in consumer attitudes are made such as appreciating products of those businesses which pay attention to pollution prevention.
(4) Background of aggressive development of environmental preservation technologies
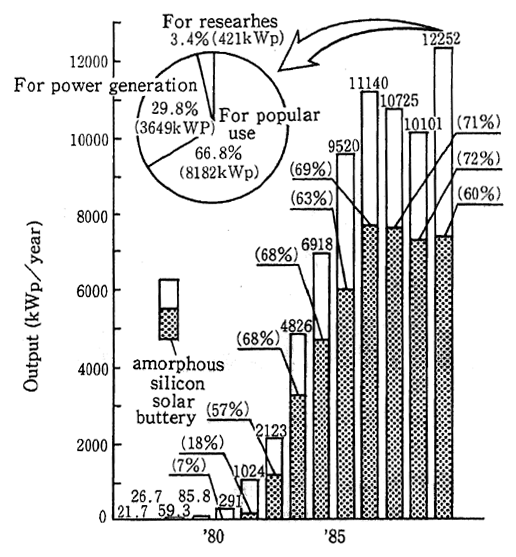
The R&D expenditures related to environmental protection in private enterprises jumped in the 1970's. It has been pointed out that rising R&D expenditures are due to rising of public opinion against pollution, accurate regulation and guidance by national and local gov-eminent based on the technological capability to respond, and business efforts in technology development to meet these regulations and guid-ance. According to a study of the Prime Minister's Office, R&D expendi-tures related to environmental protection jumped up in the period of the 1970's when government regulations were reinforced (Fig. 2-3-24). It is evident that the enforcement was reflected to the technology develop-ment trend. Looking back on past experiences, we can see good perfor-mance of pollution control when the factors stated above were ade-quately combined. In the case where technology does not exist to meet excessive regulations for enterprises, like the case of Muskie Act of U. S. A, overly strict regulation did not contribute to development and promotion of pollution control technologies. On the other hand, when clear regulation standards are not given and technology development is carried out voluntarily by private enterprises, development of environ-mental protection technologies are liable to be influenced by manage-ment. We have good example on development and diffusion of solar batteries and electric cars. Companies engaged in those areas had no common premise of "regulations," and their motivation for technology development is always influenced by the factors such as "if the technol-ogy development can be accepted by the market or not" or "if the products can be competitive or not." In fact, the technology develop-ment promotion of the two types of products has been largely influenced by the economic factors such as currency conversion rate and oil prices. The rate of solar battery production increased largely after the first oil crisis, and was stagnant from 1986 to 1988 because of decreased export competitiveness due to arise in yen value, with external demand greater than domestic demand. Based upon increased global concern for envi-ronmental protection since 1989, production has shown an upward trend again (Fig. 2-3-26). On the one hand, domestic sales of electric cars from major manufacturer company E rapidly grew after the first oil crisis, and dropped significantly in the period of 1983 to 1988 as crude oil prices dropped. The sales have grown again since 1989 for the reason of increased concern of global environmental protection (Fig. 2-3-27).
Fig. 2-3-23 Standards for Nitrogen Oxide Emissions by Soot and Smoke Generating Facilities (Liq-uid Fuel Incinerating Boilers)
Source Environment Agency
Fig. 2-3-24 Trends in Environment Protection-Related Research Expenditures in Japan
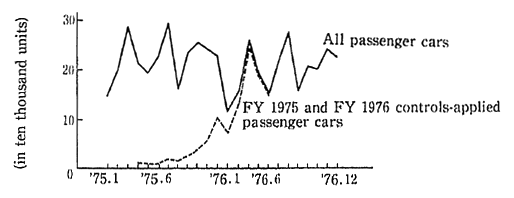
On the other hand, when accurate regulation and guidance are implemented based on technological acceptability (estimated using a technology assessment), effective measures can be made. For example, looking at actions of the Japanese automobile industry for exhaust gas regulation and numbers of model types of cars conforming to 1975 and 1976 restrictions, almost all model types of domestically produced cars sold in Japan conformed to the 1976 restrictions by the end of Aug. 1976 (the end of Mar. 1972 was the postponed time limit for full enforcement of the regulation) (Fig. 2-3-25). Given that production of conforming cars is impossible without corresponding technology development capa-bilities, severe competition among automobile manufacturers, based upon a common target of meeting the accurate anti-pollution specifica-tions, can be said to be one factor of accelerating technology develop-ment.
Fig. 2-3-26 Numbers of Electric Cars Sold in Japan ("E" Corporation)
Fig. 2-3-27 Numbers of Japanese Passenger Cars Sold in Japan
Note: Japan Automotive Industry Association's Sta-tistical Monthly Report on Automobile. and a survey the Planning Coordination Bureau, Environment Agency.
Fig. 2-3-25 Trends in Output of Solar Batteries in Japan
Source: Surveyed by the Optical Industrial Technology Promotion Association
Next, we will examine the concrete example of anti-pollution measures taken by 2 automobile companies in late 1960's and early 1970' s. When indexing transitions of R&D expenditures to automobile exhaust gas and indexing the size of research staffs related to R&D of exhaust gas, assuming the bases of two factors for 1965 and 1967 as 100 respectively, the former indicates a rapid growth from 1970 to 1973, when the automobile exhaust gas regulations were tightened in a series of steps (Fig. 2-3-28), and the latter jumped from 1970 to 1975 (Fig. 2-3-29). Automobile companies had given high priority to reducing automobile exhaust gas, and the two companies had dedicated depart-ments for pollution prevention in the latter half of the 1960's and special attention was put on allocating expenses and staff to the area of exhaust gas measures to cope with the regulations. Needless to say, the existing R&D department had a number of research items other than pollution prevention measures.
Fig. 2-3-28 Trends in R&D Expenditure and Environmental Measures-Related R&D Expenditure ("C" Corporation) (Indexed with FY 1965 at 100)
2. Pollution measures-related R&D expenditure
3. Project all R&D ependiture
4. Source : Data from "C" Corporation
Fig. 2-3-29 Trends in Rate of Automobile Emission Gas-Related Researchers to All Researchers ("D" Corporation)
Source: Date from "D" Corporation.
Even at present, automobile companies have devoted themselves to research and development in order to coordinate balance such demands as emission control, noise reduction, safety and recycling, all of which are intricately related and even mutually exclusive. Accurate regulation and guidance are not sufficient to promote technology devel-opment. As enterprises have various risks in technology development, positive governmental support is also important. Implementing such policies as regulation and guidance under long-range forecasting and support to technology development as needs arise, stimulate formation of the markets that accept those products which are less harmful to the environment.
It's generally said there are three steps in technological innova-tion; the first is an invention stage, the second is a technology develop-ment stage, and the third is a business implementation stage. The closer to the first stage, the more uncertainty exists, where the required fund is less. On the contrary, the closer to the third stage, the more the technological uncertainty diminishes, but the "market uncertainty" -if the product can be accepted in the market-increases. At this point more funding is required to build up the production facility. It should be pointed out that the government played an important role in the process of moving from the second stage to the third stage as described below as to the reason why the development of automobile exhaust gas reduction technology was successful.
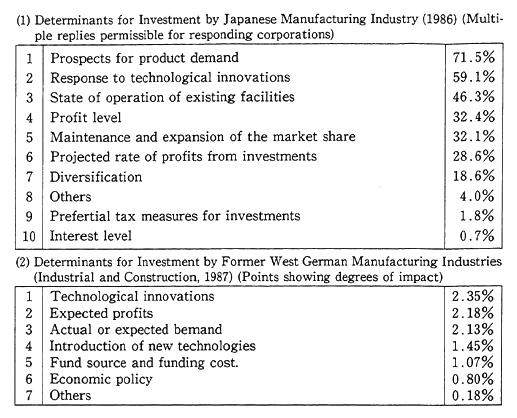
First, as to the market uncertainty which happened at that time, a clear indication of the regulatory schedule was shown by the govern-ment, so that those cars conforming to the strict specifications could be accepted by the market, enabling investment for mass production, and overcoming the anticipated high-cost at the initial stage of technology development. Since the major subjective investment decision factor in the Japanese manufacturing industry is "the projected product demand" as shown in Table 2-3-12, the fact that the strengthened regulations contributed to reducing the feeling of "market uncertainty" is meaning-ful. Thus, under the automobile exhaust regulations, automobile manu-facturers competed with each other in a free economy, and development and implementation of environment protection technologies were ac-celerated (Table 2-3-13).
Secondly, for Japanese enterprises with a lower ratio of owner's equity compared with the U. S. and European enterprises, an enormous amount of funds required for the shift to mass production system encountered in the technology implementation phase could not be cov-ered by the total effort of the enterprise including priority spending of equity capital. In such an environment, long-term loans of lower interest rate offered by the government financial organs such as the Japan Development Bank for exhaust gas measures were very supportive.
Table 2-3-13 Japanese and American Responses to Muskie Act
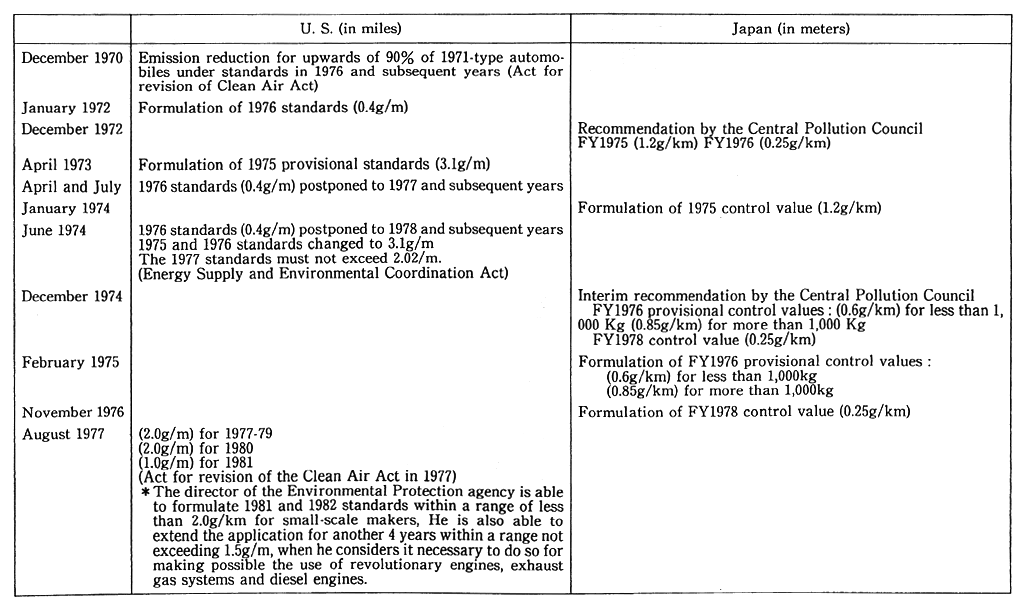
Table 2-3-12 Subjective Investment Determinants in Japan and Former West Germany
Notes : The following points are given to each option, and the total is computed by weighting the rate of responses.
Grave impact= 4
Considerable impact= 3
Limited impact= 2
Small impact= 1
No impact= 0
Sources: Questionnaire Survey on Corporate Performances (Economic Planning Agency, 1987) Franke Neumann (1989), Capital Spending in West Germany Investment Motivation and Environment
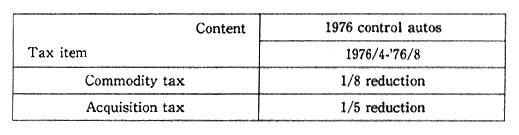
Thirdly, selling prices of the cars conforming to the strict specifi-cations had to be set higher in order to collect the R&D and production line alteration costs (Table 2-3-14) and the possible resulting shrink of market demand was a serious concern. However, the car type models meeting the strict requirements were readily recognizable for the con-sumers at that time, and a tax incentive measure was made available for the purchasers of that type of car. Therefore, those measures were effective in encouraging consumers for car choices with the lower exhaust gas specifications (Table 2-3-15). Various kinds of considera-tions supporting the market were helpful to recouping the investment in anti-pollution technology development by the businesses.
Table 2-3-14 Reflection of Development Costs on Product Prices ("D" Corporation)
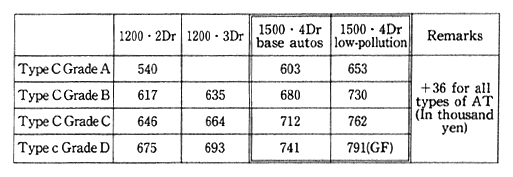
Source : Data from "D" Corporation
Table 2-3-15 Preferential Tax System for Exhaust-Related Low-Pollution Automobiles
(5) Benefits to business produced by pollution-related technology development
The development of pollution control technology allowed produc-tion activity of the conventional size to continue while meeting the strict regulations, but, in addition, it is worth noting that a still further positive effect was associated with business operations.
A pessimistic view was dominant in the automobile industry, that the enforcement of emission regulation which was considered to be the severest in the world would result in a demand decline and drastically reduce total production of the nationwide manufacturing industry, because selling prices would be around 10% higher with the installation of pollution control devices, and fuel efficiency factor and performance would be lower with the anti-pollution devices. However, though selling prices became higher, demand actually increased and fuel efficiency of the 1976-specification cars reached a level almost comparable to that of 1973-specification cars in 1976, because a great effort was made for to improve fuel efficiency while keeping performance at a practical level. As the result, in spite of the enforcement of exhaust gas regulations, the automobile industry expanded and the national economy grew. Accord-ing to a study on the two companies stated above, conducted by the Environment Agency, several other important benefits were revealed. The two companies responded that the frontier spirit was created among the employees saying "there is a way to solve difficult problems when challenged" promoting the will to work and morals, challenges to develop new technology was highly evaluated by the public as socially meaningful, and company image was improved. In addition, the progress of exhaust regulation was not only effective to pollution prevention, but also brought forth secondary or related technologies such as advanced combustion control and quality control methods. Thus it was possible to produce gasoline cars with higher fuel efficiency and lower pollution, making the Japanese automobile industry very competitive in the world.
The attitude of businesses that "putting too much emphasis on environment protection sacrifices profitability" can be said to be overes-timated. Rather, the natural way of thinking that long-range profitability is important, was effective to promote the automobile exhaust gas measures. It is important to build up a social system in which those enterprises who make a positive effort for environmental preservation are rewarded.
(6) Impact of pollution control investment on the national economy
The cumulative sum of pollution control investment by the private sector was about 5,300 billion yen (1970 value) during the period of 1965 to 1975 when investment was concentrated. We will now discuss the influence of this investment on the Japanese economy.
As a framework of evaluating influences of the anti-pollution investment on the economy, two aspects have to be considered; one is the cost increase compared to prices associated with the investment, and the other is the income effect by increased demand created by the investment.
Firstly, though the major influences on prices are dependent upon demand/supply relationship of products, the increased cost due to anti-pollution investment is normally reflected in product prices. This results in increased prices of intermediate products from those industry sectors which purchase raw material or components at increased prices, and then prices of final products are raised in the end. Price increases are reflected as demand decreases depending upon the price elasticity (rate of demand change against price change) of material demand. As a result, the facility investment of each industry sector is decreased and becomes an element to draw the supply down.
Secondly, as to the major effect given to the income aspect, pollution control investment is a cost. However, at the same time it means in created demand for the industry sector which accepts orders for the investment. In addition, the increased demand in the pollution control industry equals the demand creation of material and compo-nents covered by pollution prevention investment capital, inducing increased investment in the related industry sectors and expansion of the supply.
As discussed above, the first effect is a factor of decreasing the real GNP (price effect), while the second effect is a factor of increasing the real GNP (income effect). In order to fully discuss the economical influences of the pollution prevention investment along with the real. ities, there are a number of other factors to be considered. Figure 2-3-30 shows result by consolidating the two effects using an econometrics model developed by the Environment Agency. Real facility investment of the private sector increased by about 7.4% in 1975 compared to the case without any pollution prevention measures, real personal consump-tion increased by about 0.4%, real ordinary overseas surplus decreased about 300 billion yen (1970 value), and real GNP increased by about 0. 9%. The consumer price index which was at a level of 170.4 in 1980 (1975 = 100) increased by about 1.2% as the effect of pollution control investment. This means an average annual price increase rate of 8.3% was raised to 8.4%. The whole sale price index which was at a level of 154.2 in 1975 (1970= 100) increased by about 1.7%. This meant an average annual increase rate of 5.5% to 5.7%.
Though economical impacts by pollution control investment are different by industry sectors, there was no severe negative impact to the whole national economy in the past high economy growth process. The experiences of other countries are also similar as OECD points out in its report that "the impact of pollution prevention investment against national economy is neutral or negligible." Apart from the time when production capacity increase was in progress like the high economic growth age, as far as the economic recession period after the oil crises when the peak investment of the pollution control overlap is concerned, pollution control prevention investment helped to stimulate the demand recovery and supported facility investment and employment.
Fig. 2-3-30 Economic Consequences of Private Investment in Pollu-tion Prevention
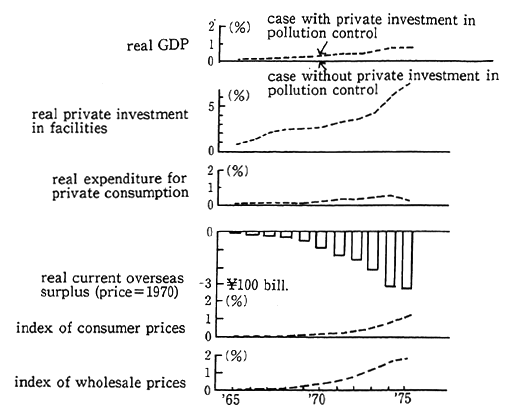
Note: Estimated by the integrated environmental model of Environment Agency. simulating two cases ; with private investment in pollution control without private investment in pollution control, and compare these cases in terms of rate and real sum.
In the market economy, it is necessary to win the competition by reducing the costs of services and products as low as possible and supplying good-quality products at lower prices. It is the principle of the market mechanism that the resources of the entire society are efficient-ly utilized and optimum distribution of the resources is made through market competition. Normally prices need not be paid for utilization of the environment, however, if any form of system by which the utiliza-tion cost is included in the economic calculation could be invented, every sort of resource including the environment can he efficiently distributed through the market, as incentive of self elimination of such external uneconomic factor as environmental destruction will he applied to the market economy. In the process of promoting anti-pollution measures, the environment-related costs of the enterprises increased. however, the economy as a whole kept growing. It oust he certain that the resource distribution function efficiently worked. The resulting forms of the economy are different, of course, between cases where the environment utlization costs are included and those not included in the economic calculation. When environment-related costs are included, prices of products from pollution generating industries rise, resulting in de-creased demand for the products, and demand for alternative products with the same function from less polluting types of industry increases. Through such a it mechanism the industry structure and consuming pattern are dynamically changed, and this dynamic change itself stimu-lates it smoooth transition of capital between industries and help avoid unnecessary pains and loses to the whole economy. In contrast to the situations of the old U. S. S. R. and Eastern European countries as discussed in Chapter 1, maintaining this dynamism of the free market economy is important to lighten the socil burden associated with strengthening of the anti-pollution measures. According to the Japanese experiences, though there must have been room for promoting anti-pollution measures more smoothly using the benefits brought forth by high economic growth, even under the circumstance of economic depres-sion and rapidly strengthened measures following the worsening envi-ronmental problems, with some exemption tuf some companies suffering damage, the anti-pollution measures did not necessarily pose extreme burdens to economic growth, viewed from individual enterprises and industry sectors, and from the whole national economy, as the efficiency of free maket economy and governmental policies considered worked properly.
2-3-3 Citizens and NGOs
Citizens movements played an important role in environment problems, particularly in past pollution problems. As severe environ-mental destruction brought about damage to property and human health, local citizens' groups started various activities to protect them-selves. Particularly since 1955 when industrial pollution had rapidly increased, the local citizens which had experienced damage to health by air pollution or water contamination by heavy metals practiced direct actions to the plant, appealed to law suits or complained to regulatory bodies requesting remedies.
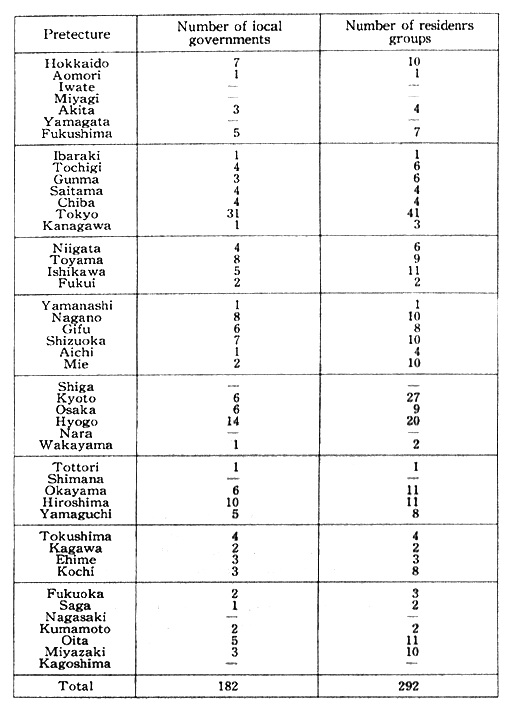
In 1970, a number of discussions were made at the congress on pollution problems and it is called as "the pollution Diet session. Complains about public pollution were pervasive and 292 citizen groups formed in 182 cities and towns according to a study of the Ministry of Home Affairs (Table 2-3-16).
The motivations of forming citizen groups falls into categories of 1) requesting compensation for or protection measures against public pollution generation, 2) protest-movement to plant installations which would potentially cause pollution, and 3) awareness orientation of citizens for improved living environment. The majority fit the cate-gories of items 1) and 2). In the early stage of regulative measures, the people had to protect themselves. They prevented installations of new plants through citizens' movement and gained favorable judgment in law suits. This kind of activity gave significant impacts to the govern-ment attitude thereafter on pollution problems.
In 1958, triggered by a violence case between a paper mill plant and fishermen on fishery damage caused by contaminated drainage from a plant by the River Edo, "the Law Relating to the Preservation of Water Quality in Public Waters" and "the Law Concerning Regula-tion of Industrial Effluent" was established. Because of protest-movement against installation of a petrochemical complex at the Mishima/Numazu area in 1963 and 1964, the plan had to be abandoned and it became a turning point in the local area development policy. In the Yokkaichi city pollution case of 1972, the court ruled that 1) it recognized the existence of joint liability for doing unlawful acts, and 2) enterprises should have taken all preventive measures using the highest level of technology and knowledge sacrificing the profitability to con-trol exhaust of pollutants that could be known potentially harmful and dangerous. Thus the enterprises were liable to the fault of negligence such preventive measures. It was the first case debated upon the public pollution caused by harmful exhaust gas from many plants in the area, so that it attracted attention as a typical example of many other similar cases which widely existed. At this point, this case is unique from the other major 4 pollution cases (on the subjects of Kumamoto Minamata, Niigata Minamata and Itaiitai diseases) which were related to discharge heavy metals (such as mercury) from manufacturing plants. By the court decision in favor of the plaintiff, claims for pollution damages became common in many places (Table 2-3-17).
Table 2-3-16 Residents' Activities Against Pollution
Source: Ministry of Home Affairs.
Note: As of Judy 15, 1970.
Table 2-3-17 Numbers of Cases of Pollution Damage Compensation in Dispute at Local District Courts in or Around 1970 (As of the end of June 1970) Classification b. Number of cases
Note: 1. Civil Affairs Bureau, Supreme Court (From the White Paper on the Environment, 1972). 2. The figures in parentheses represent those as of the end of 1969.
Along with the introduction of a no-fault liability system based upon a partial revision of the Air Pollution Control Law and the Water Pollution Control Law in 1972, businesses recognized the need to quickly resolve compensation issues and requested establishment of administra-tive relief measures. In such a background, "the Pollution Related Health Damage Compensation Law" was established in 1973 as a part of the administrative relief system to bear the civil liability for pollution disease patients.
However, since lives and health lost or damaged by pollution could not be recovered after the damage had occurred, there evolved a mood requesting establishment of laws and regulations for prevention of pollution damages. On the one hand, a number of suits were presented concerned about public pollution and destruction of nature associated with new installation of traffic systems and local development In leg I suits requesting stoppage of plant operation, a number of cases resulted in rejection of appeals as ineligible or in unfavorable court decisions for the citizens, even in cases where the right of request is admitted, such as interference to life and sleep, for instance, without direct physical damage can be negligible, interpreting the request very strictly.
While such circumstance, public opinion arose that preventive measures for environmental destruction should be made based upon environmental assessment including pre-investigation, reviews of busi-ness plans and estimation of influences, instead of individual court appeals to prevent potential infringement of personal rights of citizens and the establishment and enactment of environment impact assessment were required.
As discussed above, the influences given by citizens movement and citizen groups were significant to the establishment and strengthen-ing of the environment-related laws and regulations.
At present, various types of activities of citizen groups are widely seen, related to anti-pollution activity against businesses, policy change requests for government administration, recycling of material, national trust activity, and water drainage purification. Those activities are characterized by reconsideration of the like styles of citizens, and pursuit of lowering the impact on the environment in order to contribute to environment conservation. It is expected to be meaningful that a social structure is build up in that the citizens' effort can be more concentrated to the improvement of environment instead of struggles for compensation of pollution damages and recovery of personal rights.
An ecology park created in the suburbs of Manchester as part of the Grand Work Project
Piles of conpressed cans for recycling (left, steel cans; right, aluminium cans)
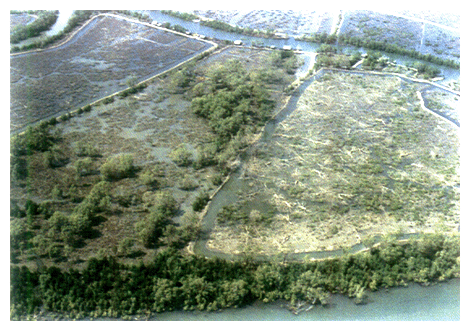
Destruction of mangrove forests
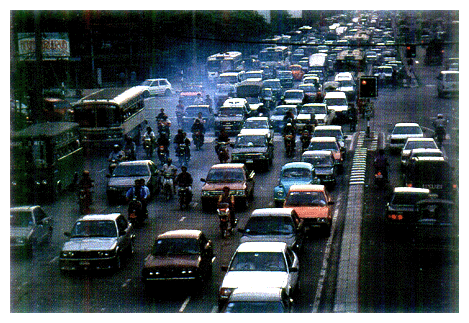
Air pollution caused by vehicle exhansts in Bangkok, Thailand
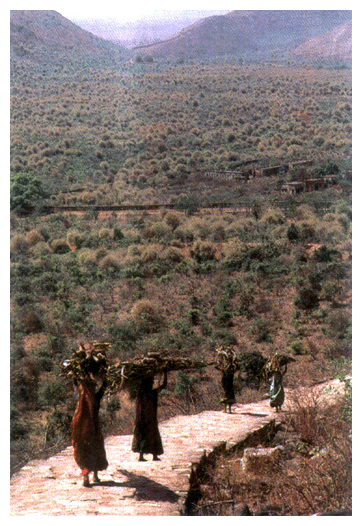
Firewood is a thing for daily necessity in Nepal
Chapter3. Recent Socioeconomic Trends and Sustainability
As we have seen in Chapter 2, we have come to learn how to recover and maintain sustainability through experience which might impair a sustainable society and during the process to cope with it. Nonetheless, a review of socioeconomic performances in recent years suggests that there are moves which might spoil sustainability in Japan and in the rest of the world. In this chapter, we will take a look at those trends in Japan and in developing countries, especially Asian countries, with which Japan is closely tied in.
3-1 Recent Socioeconomic Trends in Japan and their Evaluation from a Point of Sustainability
In Japan, as we described in Chapter 1, improvements have been unsatisfactory in the urban and living environment pollution, such as air pollution in major cities, and in the natural environment, too, signs of deterioration have been observed with a depletion of wild fauna and flora. Yet in another aspect, Japan has put a considerable load on the global environment. One reason is a growing expansion of activities putting loads on the environment against the backdrop of brisk eco-nomic performances in recent years. As we will see in Fig. 3-1-1, all indices that indicate the tendency of economic performance associated with environmental loads, such as energy consumption, the volume of freight traffic and the area of developed forest lands, has begun to rapidly rise in the last few years, and there is concern about a drop in sustainability. In this chapter, we will reflect on those trends and causative factors by taking up as examples the increasing loads on the atmosphere of nitrogen oxides and carbon dioxide, the increasing production of wastes and so forth, the impacts of agriculture, forestry and fisheries on the environment and the impacts of local development, including resorts, on the environment.
Fig. 3-1-1 Trends in Economic Performances Closely Related to the Envsroment (Index with FY1975 at 100)
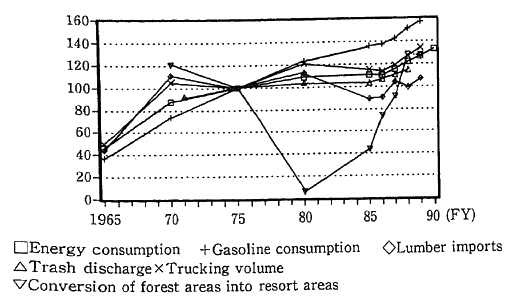
Notes: The figure which represents the area of forests convert-ed into resorts in 1970 is the mean for 1970-72.
Sources: Prepared by Environment Agency based on: the Minstry of International Trade and Industry
"Comprehensive Energy Statistics" and "Energy Pro-duction and Demand Statistics Yearbook"
Minsry of Finance:
"Outline of Foreign Trade"
Minstry of Health and Welfare:
"Wastes in Japan"
Minstry of Transport:
"Outline of Land Transport Statistics"
National land Agency:
"White Paper on Land" : etc.
3-1-1 Increasing Loads on the Atmosphere
(1)Increased Nitrogen Oxide Pollution in Major Cities
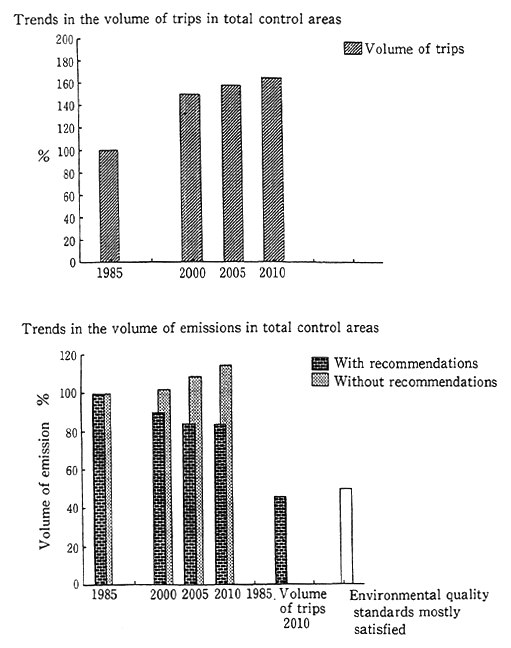
As we have seen in Chapter 1. reduction of air pollution by nitrogen oxides in major urban spheres, including Tokyo, Yokohama and Osaka. has remained unsatisfactory in recent years. This fact is posed as a grave issue because there are signs of further deterioration. The achievement rate of environmental quality standards reveals that they have been attained at about half of the air pollution monitoring stations and a majority of automobile exhaust monitoring stations, and there have in recent years been signs of a drop in the number of monitoring stations where concentrations meet the standards. In a check of the proliferation of polluted areas, there are signs of an increase in areas where the environmental quality standards are surpas-sed (Fig. 3-1-2).
Fig. 3-1-2 Distributions of Environmental Concentrations of Nitrogen Dioxide in Tokyo Bay Area (Automobile exhaust gas monitoring stations)
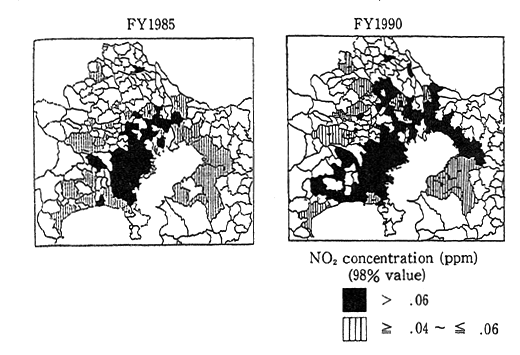
Sources: Enviromesnt Agency
This tendency stems from the fact that the effects of exhaust gas controls per motor vehicle are offset by the rise in automotive traffic volume and the increase in the ,share of diesel vehicles in that volume.
Fig. 3-1-3 Trends in Automobile Trip Distances (Indexed with FY1987 at 100)

Sources : Ministry of Transport:
"Automobile Transport Statistics Yearbook".
Fig. 3-1-4 Trends in Numbers of Automobiles Owned (Indexed with FY1986 at 100)
Sources: Cooperation Society for Automobile Inspec-tion and Registration "Trends in Possesssion of Antomobiles in Japan".
Automotive traffic volume, 'as is discernible from rises in the distance of trips (Fig. 3-1-3) and in the number of motor vehicles owned (Fig. 3-1-4). has risen steadily do to increases of privately-owned cars and increased reliance on motor vehicles in cargo transport. In terms of national average, the rate of car ownership by household stands at 75%, and shout 30% of all household. hay more than one car. The increas-ing dissemination of home delivery and just-in-time systems in which emphasis is on convenience constitute one factor for an upturn in the volume of freight traffic. In the midst of an upswing in traffic volume, traffic congestion is chronic in major urban areas, and in Tokyo and the prefectures of Kanagawa and Osaka, the situation is such that traffic volume is always in excess of the road traffic capacity. Such traffic snarls reduce traffic efficiency, raising the emissions of nitrogen oxides and other chemicals per traffic volume (Fig. 3-1-5).
In terms of the types of motor vehicles, on the other hand, the increase of diesel-engined motor vehicles, which feature greater emis-sions of nitrogen oxides, is more remarkable than that of gasoline-engined automobiles. Of the trucks and buses, in particular, the rate of diesel-engined ones exceeded 50% in 1985 and reached about 65 % in 1989. The number of diesel-engined automobiles of the direct-blast type, which emit greater amounts of nitrogen dioxides than those of the auxiliary-chamber type, is rapidly increasing (Fig. 3-1-6), and this ten-dency is responsible for a rise in the emission of nitrogen dioxides per motor vehicle. Light oil, which is the fuel for diesel-engined motor vehicles, features lower retail prices than gasoline because of the deferences of taxes and business relations. Such economic predomi-nance in terms of lower prices, easy maintenance, good fuel efficiency and other factors constitutes a major factor for a growing inclination to use diesel-engined automobiles. In a perspective of environment protec-tion, there is the need to study relations between those economic factors and the environment.
Fig. 3-1-5 Trends in Degrees of Road Conges-tion
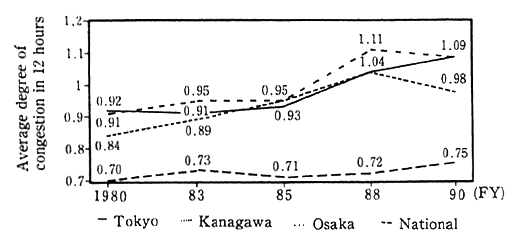
Notes: Degree of congestion =Traffic volume in 12 hours/road capacity. Degree of congestion more than 1.00 means that traffic volume is beyond road capacity.
Fig. 3-1-6 Increase of Diesel-Engine Trucks (with vehicle weight of 2.5-5 tons)
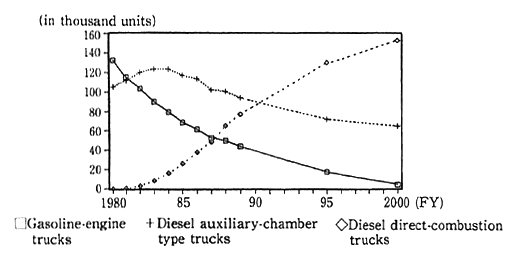
Notes: 1. Trends in the possession of trucks in Tokyo's 23 wards 2. For 1995 and 2000. projected values are given in situations where no special measures are taken.
Sources: Estimated by the Environment Agency baced on the data from the Cooperative Society for Automobile Inspection and Registration and the Japan Automotive Industry Associa-tion.
For reduction in nitrogen dioxide pollution in the midst of this tendency, controls on exhaust gas from individual motor vehicle were strengthened in accordance with the recommendation, "On the Way Measures Should be for Reductions in Automotive Exhaust Gas" made by the Central Council for Environmental Pollution Control in Decem-ber 1989, and the emissions of nitrogen dioxides, primarily from diesel-engined automobiles, will be reduced by 30-60% in the next 10 years. For a prompt realization of those strengthened controls, serious efforts are being made to develop the pollution prevention technologies and to reduce the content of sulfur in the light oil. With this strengthening of the controls, if the traffic volume is stabilized at the level of 1985, it is projected that the whole-area emissions of nitrogen dioxides would go down below those levels with which the environmental quality standards could be achieved, even in Tokyo and other areas with high pollution levels. Nevertheless, if the traffic volume remains on the upswing, sufficient improvements could not be expected in coping with nitrogen dioxide pollution in major urban areas (Fig. 3-1-7), so there are calls for formulation of more powerful measures which would go as far as to include automobile use. Given this state of affairs, the government presented to the Diet the bill for a Special Measures Law for Reduction of Nitrogen Dioxides Emission Exhausted from Automobiles," the details of which are given in Section 2, Chapter 2 of Part 2 (In this text, part 2 is omitted).
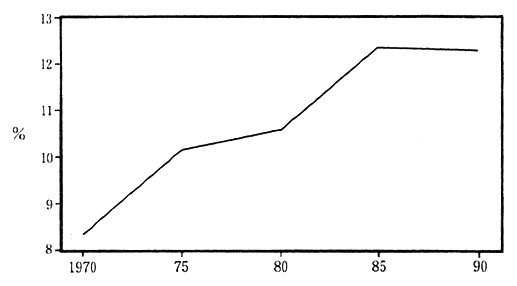
(2) Rises in the Volume of Carbon Dioxide Emissions
The term "global warming" refers to the phenomenon of temper-ature rise caused by emission of carbon dioxide, methane, and nitrous oxide from human and animal activities, which serve to increase the concentration of greenhouse gases in the atmosphere, and serves to raise the earth temperature. This, in turn, causes significant changes in climate which is part of the very foundation upon which human beings and the overall ecological system exist. At the present time, emission control of green-house gases such as carbon dioxide has become a key issue of the world. According to the report of IPCC, there are many causes for the increases of green house gases such as: emission of carbon dioxide as a result of use of limestone; cutting downs of forests which reduce the sink of carbon dioxide; emission of methane gas and nitrous oxide due to combustion of bio-mass etc. While these are important, carbon dioxide emission forms 55% of man's contribution to global warming. And of this total, emission of carbon dioxide from consump-tion of energy accounts for about 80%. Thus, emission of carbon dioxide from energy consumption is considered to be the biggest of the factors for global warming, for which human activity is responsible.
Fig. 3-1-7 Volume of Automobile Trips and Emissions of NOX in Future Based on Recommenda-tions
Source: Environment Agency
In Japan, energy consumption again began to increase after 1986. For this reason, carbon dioxide emissions resulting from energy con-sumption have been rising steadily in recent years.
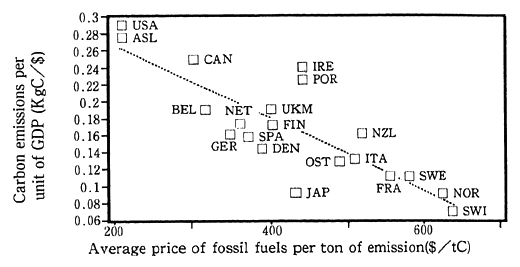
In Japan, the energy consumption per unit of GDP is smaller than in other developed countries, and so, carbon dioxide emissions from energy consumption are smaller than other developed countries in relation to the size of the economy. And it can be said that the structure for energy consumption is more efficient than that for other developed countries from the standpoint of environmental protection. In the background of this is the fact that efforts for energy conservation made headway after the second oil crisis in the 1970's, the cost of energy is relatively high, and there is a relatively lower level of demand for heating compared to other developed countries, and that thanks to geographical factors, there is a high level of dependence on railway transport and coastal marine transport both of which have a high level of energy efficiency. (Fig.3-1-8)
Fig. 3-1-8 Prices per ton of eission and eissions inten-sities
Source: OECD "Energy Prices, Taxes, and Carbon Dioxide Emissions"
A check of trends in the emissions of carbon dioxide in the past indicates that the degree of energy intensity (energy consumption per unit of GNP) has continued to drop since the first oil crisis in 1973 thanks to the energy-saving efforts made by industry and other sectors and to the marketing of merchandise with higher values-added, and that the emissions of carbon dioxides have virtually stabilized with signs of a drop seen in the per-capital emission. From 1986 on, however, the reduction in the degree of energy intensity slowed down, and with economic performance becoming more brisk, emissions rose at a rapid pace (Fig. 3-1-9). According to the estimate of the Environment Agency, from 1986 to 1990, the emissions rose by 19% (at anaverage rate of 4.4% a year), and the per-capita emission of carbon dioxide reached the level that existed in 1973. The Action Program to Arrest Global Warming formulated by the government in 1990 is designed to stabilize carb dioxide on a per-capita basis in the year 2000 and beyond at about the same level as in 1990 and to stabilize total emissions of carbon dioxide in the year 2000 and beyond at about the same level as in 1990 through progress in the development of innovative technology, etc. at a pace and scale greater than currently predicted, but because the rise in total emissions in 1990 remained high at 4.6%, according to the estimates of the Environment Agency, the situation remains tough.
Fig. 3-1-9 Trends in Emissions of C02 fron Energy Consump-tion in Japan
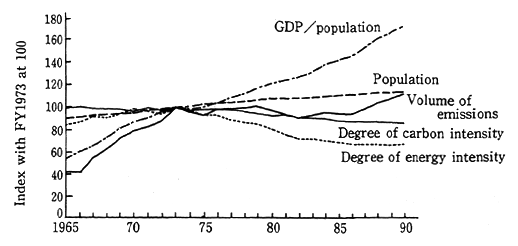
Remarks: 1. Estimated based on the "Comprehensive Energy Statistics, "etc. 2. Volume of carbon dioxide emissions =degree of carbon intensity (volume of carbon dioxide emissions per unit of energy)× degree of energy intensity× per-capita GDP× population.
Fig. 3-1-10 Trends in Fuel Costs for New Passen-ger Cars. (made in Japan) (10-Mode Fuel Costs)
Source: Ministry of International Trade and Industry, Ministry of Transport
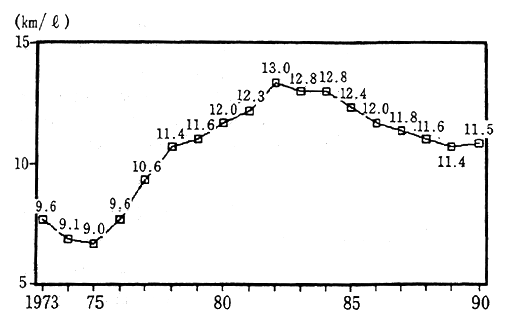
Signs of a slowdown in the reduction of energy usage may be observed in economic performance. A case in point is trends in the consumption of energy by automobiles. The sales of large-sized automo-biles with large engine displacement are on the upturn, and the fuel efficiency of new automobiles have begun to drop (Fig. 3-1-10). Reduc-tions in power consumption by household electric appliances held con-stant in recent years (Fig. 3-1-11). The temperatures set for air-conditioning systems in buildings suggests that energy saving has come to a standstill (Fig. 3-1-12). Reductions of energy use in per-product, which went on at a rapid pace in the industrial sector during the years of th oil crisis, have also come to a standstill in recent years (Fig. 3-1-13).
Fig. 3-1-11 Trends in Energy Consumption by House-hold Electric Appliances (Trends in Power Consumption with 1973 at 100)
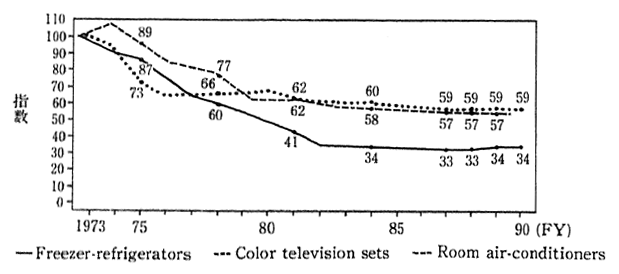
Note: The figures for freezer-refrigerators represent power consumption for 1 month on the annual average for 2-door freezer-refrigerators of the 170-liter class Those for color television sets represent power con-sumption for 19-inch and 20-inch television sets. Those for room air-conditioners represent power con-sumption of room air-conditioners of the separate type.
Sources: household Electric Appliance Association
Against the backdrop for those trends lies the fact that the crude-oil prices which had soared following the oil crises have dropped substantially and are lower than levels before the oil crises, because the production control system carried out by the Organization of the Petroleum Exporting Countries (OPEC) began to fall apart in and around 1985, and because the yen remained strong (Fig. 3-1-14). As the
Fig. 3-1-12 Trends in Temperatures Set for Air-Conditioning
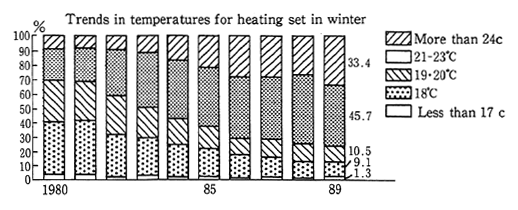
Note: Replace "21-23oC" with "21 and 22oC" for and "More than 24 C" with "More than 23c" for FY 1980 and FY 1981.
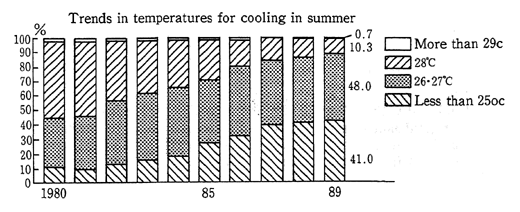
Source: Agency of Natural Resources and Energy, "Findings of Survey on Effective Use of Energy".
Note: The figures for FY 1980 to FY 1985 are based on the Survey on Energy Saving by Large-Lot Users" carried out inFY 1980-1985 (the predeces-sor to the aforementioned survey with the same survey subjects). prices of oil energy dropped and the share of energy outlays n the production cost dropped with the progress of energy saving, investments by the private sector in energy saving have continued to go down from a peak in 1981.
As long as corporate performances are within the framework of competitive markets, decision-making on whether certain energy-saving measures are to be taken, such as with the introduction of high energy efficient facilities with capital outlays, is done according to the judg-ment of whether those investments could serve to reduce production costs as a whole. In other words, measures will be taken only in situations where the cost of investments in facilities is compared with the effect of a drop in the fuel cost brought about by energy consump-tion reduction which stems from the implementation of the measures, and it is found that the former is greater. In such a corporate decision-making process, it would do well, at least theoretically, if an energy investment is worthwhile in terms of the life of the facilities as a whole, but it is pointed out that in actual corporate performances, no measures would be taken unless the investment cost could be recovered within 2 years. The extent to which the fuel cost may be saved has become a primary factor to determine whether energy saving measures are to be actually taken, but in reality, there are calls for greater benefits from fuel saving than those which come from a theoretical evaluation of gains and losses. Thus this actual corporate way of decision may make it difficult to decide on corporate performances which may contribute to a reduction of carbon dioxide emission.
Fig. 3-1-13 Trends in Original Unit for Energy Consumption by Major Industries
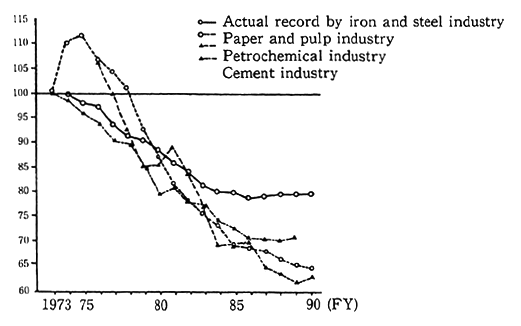
Notes; 1.Indexed with 1977 at 100 for the petrochemical industry. 2.Original unit of consumption adjusted acoording to conditions of production prevalent in 1974 for the iron and steel industry. Source: Ministry of International Trade and Industry.
Fig. 3-1-14 Oil Prices and Investments in Energy Saving
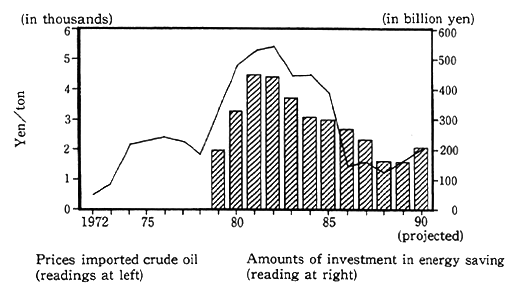
Note: The amounts of investments in energy saving before FY 1978 are unknown.
Sources; Ministry of Finance: "Japan Monthly Trade Table";
Ministry of International Trade and Industry:
"Plans by Major Industries for Investments in Facilities and Equipment".
In households, a strict evaluation of gains and losses as is done by corporations is not actually done, but energy prices of energy have a significant impact on their behavior. As is discernible from the fact that the dissemination of solar water heaters has come to a standstill in recent years, whether people save energy in their daily life and whether people purchase energy saving merchandise depend largely on the cost saved by doing so and is greatly influenced by energy prices.
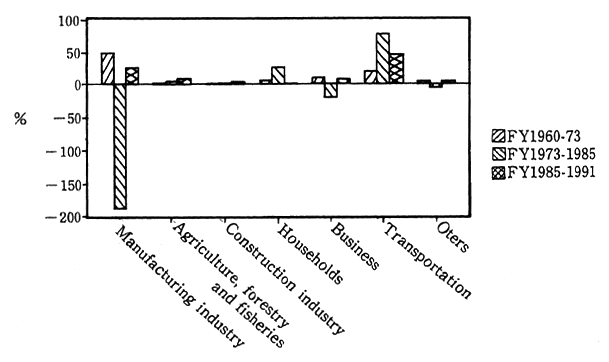
Let us review trends in oil consumption which has a great share in energy, by sectors in order to understand determining factors for energy consumption volume. Reflecting changes of crude oil prices, consumption of oil rose until 1973, when it began to drop until 1985, and it has since been rising again. A sector-specific check of oil consump- tion indicates that it decreased in manufacturing from 1973 to 1985 when oil prices were high, but began in 1985 to increase at a rapid pace. In the transportation sector, we can see that it has consistently risen and the increase has accelerated since 1985 (Fig. 3-1-15).
Fig. 3-1-15 Rates of Contributions to Oil Consumption Increases/ Decreases by Sectors
Source: Estimatedbased on the Agency of Natural Resources and Energy's "Comprehensive Energy Statistics".
Fig. 3-1-16 Emissions of Carbon Dioxide in Japan (FY1990; in terms of carbon)
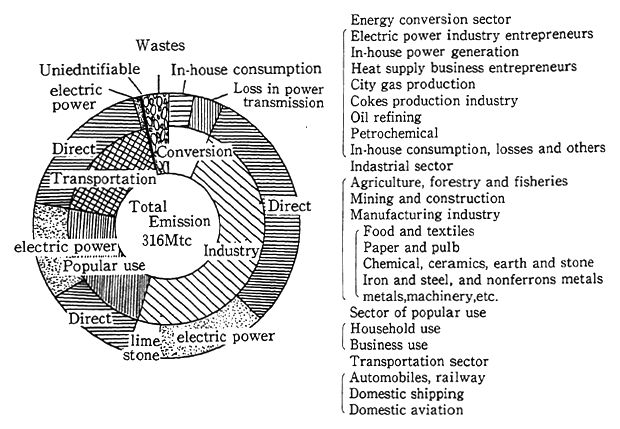
Note:
1. Projected according to "Comprehensive Energy Statistics," etc.
2. Emissions are computed in terms of carbon.Multiplied by 3.67 for the mass of carbon dioxide.
3. 8.4Mtc of emissions by bunker oil are not included.
4. By type of fuel, coal and the life account for 77.6Mtc,oil and the like account for 182. 0 Mtc, natural gas accunts for 27.6 Mtc,and other fuels account for 5.0 Mtc.
Source: Environment Agency
The breakdown of carbon dioxide emissions in Japan has been estimated by the Environment Agency and given in Fig. 3-1-16. Of the total emission of 314 MtC (in terms of 1 million tons of carbon) in Japan, 292 MtC comes from energy consumption. As for total emissions in each sector, for power generation, depending on power consumption, the industrial sectors represented by iron and steel, ceramic, earth and stone industries, accounted for about one half, or 48%, up 3.3% from the previous year. The share of popular use, including household energy consumption, was about 23% (12% by households and 11% by busines-ses), lower than that of the industrial sector, but with a higher rise from the previous year with 5.0%. The transportation sector (where automo-bile emissions accounted for about 90%) had a share of about 19%, up 4.5% from the previous year.
In this way, energy consumption sustains humankind's economic activity, but at the same time, it results in emissions of carbon dioxide which can cause global warming. In recent years, there has been a sharp increase in the emission volume resulting from energy consumption, and so, we cannot help but be concerned about the impact on the sus-tainability of humankind and its society.
Also, outside of energy consumption, carbon dioxide is discharged in the course of dissolving of limestone, and incineration of wastes. According to preliminary figures drawn up by the Environment Agency, 12.7 MtC of carbon dioxide was discharged from limestone in 1990. Although it is difficult to estimate the volume of emissions from waste incineration, it is estimated that about 8 MtC were emitted from inciner-ation of household wastes in 1990. However, carbon dioxide originating in wastes includes a considerable amount of carbon that was photosynthetically converted from atmospheric CO2 to organic carbon by living organisms in the form of paper and wood pieces.
We have analyzed the problem of emissions of carbon dioxide in the foregoing part, but in order to control these emissions, the situation calls for powerful measures to deal with a broad range of fields includ-ing industries, residential communities, and transport. Also, in addition to these measures, we need to control emissions of methane gas, nitrous oxides and other green house gases. At the same time, we need to promote steps to strengthen the sinks of green house gases. Further-more, there is an urgent need to further upgrade the scientific knowl-edge base regarding the various mechanisms involved in global warm-ing.
Based upon the understanding of this situation, the "Action Program to Arrest Global Warming" sets forth various kinds of mea-sures to prevent emissions of carbon dioxide in various spheres of human life such as the urban structure, transportation systems, indus-trial structure, and structures for energy, as well as our life styles. Also incorporated are measures to control the emission of other green house gases such as methane, measures to reinforce sinks of carbon dioxide (greenery such as forests), steps to promote scientific research and surveys, promotion of observation and monitoring, and others. It is necessary to actually implement these broad-ranging steps in a steady way.
3-1-2 Shift to A Mass-Consumption and Mass-Discharge Society
(1) Reduction of Sustainability with Increases in Collection and Discharge
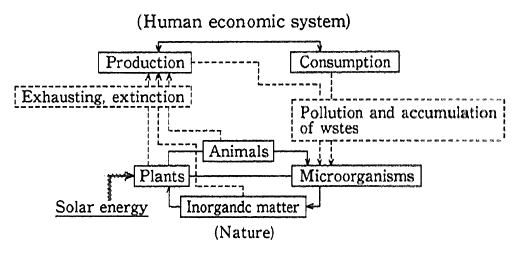
Man's economic activity depends on mineral and biological resources and on discharge of wastes into nature as waste water, waste gas and garbage after consumption. When economic activity was lim-ited, it was possible for man to act as though nature's capacity as a source of resource supply and as a sink of wastes was infinite, but as activity expanded, there emerged such phenomena as depletion of resources and extinction of species due to their collection, and accumu-lation of pollutants because of the discharge of waste materials, and there came a keen awareness of the fact that nature is finite. Ultimate-ly, the important thing is to keep the quantity of renewable resources within the recycling capability of nature and to set the quantity of wastes discharged into nature within a quantity acceptable by nature (Fig. 3-1-17).
Fig. 3-1-17 Human Economic System and Nature
The material balance in which the input of resources in economic performance and the flow of waste was estimated (Fig. 3-1-18). This reveals that Japan collected 2040 million tons of resources at home and abroad in 1990, domestically accumulated 1240 million tons of matter as building materials and consumer durables, and put 790 million tons out of Japan's sphere of economic activity in the forms of discharge or export. Besides those discharges, 180 million tons were recycled and set aside as inputs.
In order to reduce environmental loads and raise the sus-tainability, it goes without saying that methods for the collection of resources and the discharge of waste must be so designed that there will arise fewer impacts on the environment. Not only that, it is also impor-tant to reduce collection and discharge themselves. For this, there is the need to cut back the consumption of unnecessary things and increase recyclable matter.
Fig. 3-1-18 Japan's Material Balance (FY 1990 ; in hundred million tons)
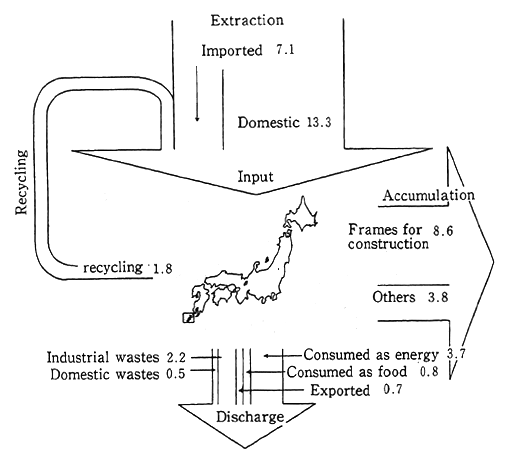
Source: Estimated by the Environment Agency based on various data
In past years of high economic growth, in which industries producing heavy and bulky products took the lead in boosting produc-tion, output and consumption measured by weight was used as a crite-rion of wealth, but now that it has become evident that the earth is finite, these sense of values no longer applies. In Japan, too, there are rising calls for communion with nature, leisure and culture other than materialistic values. It is only natural that production and consumption which is required for the maintenance and enhancement of living stan-dards should be assured, but in the future, it is necessary for us to change the direction toward a pursuit of "development" and grope for richness in the genuine sense of the word, which cannot be expressed in terms of the "quantity" of substances.
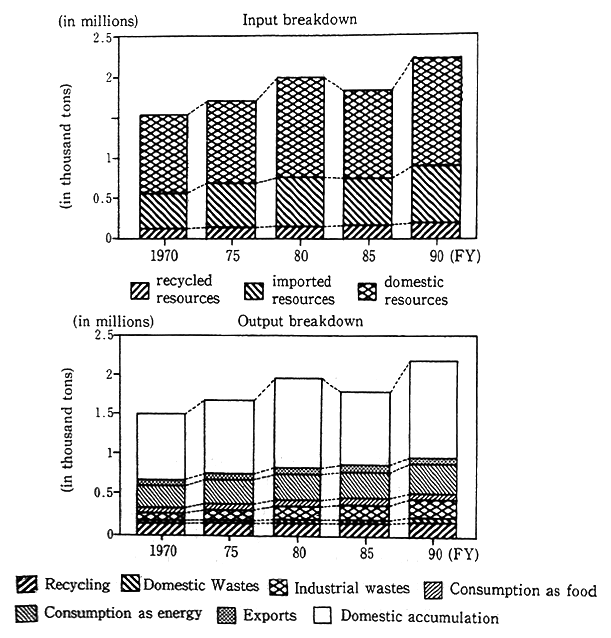
Changes in Japan's material balance suggest that though accumu-lation temporarily went down due to a decrease in the number of construction projects, due to investment restraint in public works projects in 1985, discharge and consumption consistently went up. ft put and output (total of the quantity accumulated as things usable, the quantity discharged, etc., and the quantity of exports) were about 1.5 times the value in 1970 (Fig. 3-1-19). In particular, a check of per-capita changes in the quantity of discharge and consumption which has nothing to do with the production of usable products, suggests that the increase has accelerated in recent years (Fig. 3-1-20).
Fig. 3-1-19 Trends in Japan's material balance
Source: Estimated by the Environment Agency based on various date.
According to the material balance of collection and input of resources, Japan imported large amounts of non-renewable resources from around the world. For example, imports accounted for 5.6% of world oil production and 18.0% of iron ore production of the world (Table 3-1-1). There also are items for which Japan's shares in the world's imports of renewable resources are high (Table 3-1-2). Thus, Japan's economic performance produces a significant impact on the sustainability of the economy as a whole.
Fig. 3-1-20 Annual Consumption of Substances Per Person
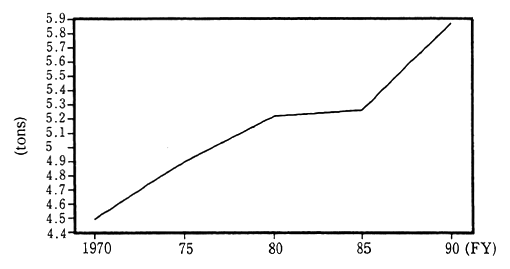
Note: Total of the discharge of domestic wastes,discharge of indus-trial wastes,food consumption and energy consumption per person.
Source: Estimated by the Environment Agency based on various date.
Table 3-1-1 Japan's Inports of Non-Renewable Resources (1989)
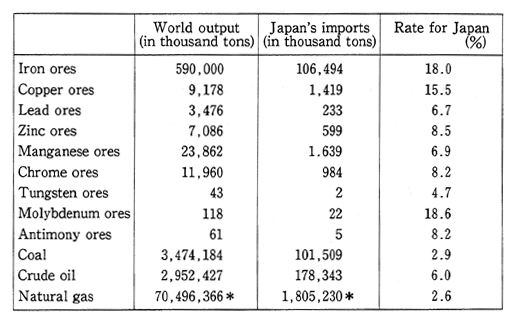
Sources: "Illustrated States of Countries in the World," "Handbook on Mining Industry" and "Comprehensive Energy Statistics"
Notes :1. In trillion joules for natural gas.
2. Crude oil for 1988.
3. Inported ores include those produced at overseas mines.
Table 3-1-2 Japan's Imports of Renewable Resources (1989)
Source: FAO, "Trade Yearbook" and "Forestry Product Statistice Yearbook".
Note: In cubic meters for lumber.
Generation of wastes rose faster than the increase of inputs (Fig. 3-1-21), doubling from 1970 to 1990. In the midst of such a rapid rise, the remaining capacity of disposal space is on the decline partly because of a drop in the availability of suitable places. Because of the difficulty of securing final disposal spaces and other factors, there occur cases in which wastes are dumped in the forests, fields and other places. The number of cases in which police arrests we made on charges of illegally dumping wastes reached about 1,500 (in 1989).
Fig. 3-1-21 Trends in Rates of Waste Discharges to Resource Inputs
Source: Estimated by the Environment Agency
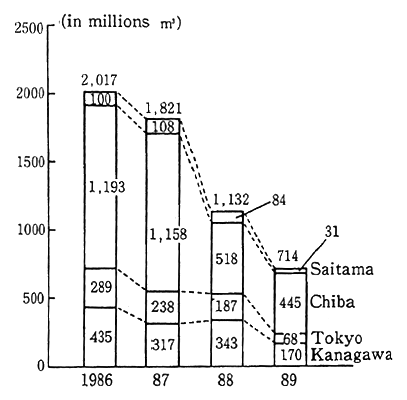
If new space is not prepared, it is projected that industrial waste would surpass its handling capacity in one-and-a-half years and house-hold waste in 8 years. Particularly in the National Capital Region and other major urban spheres, there is an acute dearth of disposal space (Fig. 3-1-22), and industrial wastes may be carried all the way to Tohoku and Hokuriku (Fig. 3-1-23). Because of the increase of illegal dumping, some local governments restrict the inflow of those wastes. In the National Capital Region, it is projected that even if disposal space could be secured at the same pace as in the past, final disposal space would feature a total shortage which would correspond to a 2.8 meter high pile if piled up in the area inside Japan Railways' Yamanote Line in Tokyo according to the estimate by "consulting meeting on conserva-tion and creation of environmental resources in large cities" sponsored by the Planning and Coordination Bureau of the Environment Agency. The lack of final disposal plants might impair the performance of industry itself, to say nothing of our living environment. Given this tendency, efforts are concentrated in insuring final waste disposal space, but the assurance cannot be made without the reclamation of valleys in the mountains and the sea surface, suggesting that it cannot be done without losing the natural environment.
Fig. 3-1-22 Residual capacities of Final Industrial Waste Disposal Areas (Tokyo and 3 Prefec-tures in National Capital Region)
Source: White Paper on Health and Welfare.
Fig. 3-1-23 Trans-Prefecture Movement of Industrial Wastes in Kanto Region
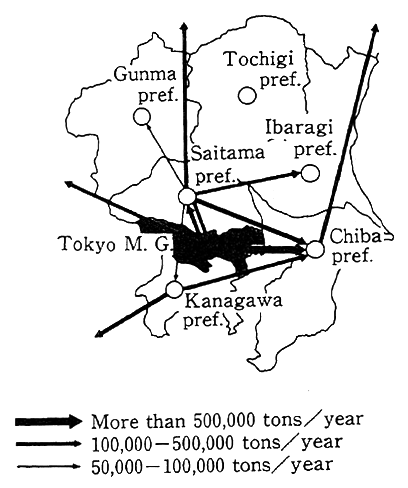
Notes:
1. Projected on the basis of the actual values of the quantities transported by collecting and forwarding agents for final disposal. For Saitama Prefecture, the quan-tities transported for interim treat-ment are included.
2. The discharge from Tokyo to areas outside the region includes the dis-charge to Gunma,Tochigi and Ibara-ki Prefectures.
3. The discharge from Chiba Prefecture to areas outside the region includes the discharge to other prefectures in Kanto Region.
4. The figures for the discharge from Yokohama City to other areas in Kanagawa Prefecture are projected figures.
Source : White Paper on Health and Welfare.
A review of the history of policy on the utilization of resources in Japan suggests that four principles for the "Basic Posture to Deal With Issues on Industrial Materials and Resources in Japan" were defined in the report of the Resource Survey Council of the Economic Stabilization Board in 1951--"(1) problems of industrial materials and resources will be reviewed in line with trends of technical development in the world, (2) features of industrial materials and resources would be fully understood, (3) consideration will be given to the general conservation of materials and resources in Japan and thought will be given to the availability of materials and resources in Japan, and (4) the methods which disrupt the integrity of nature and interfere with the use of other resource should be changed. Methods which would positively contribute to nature's law of circulation would be worked out." As the basic perception which formed this principle, the report showed this concept: "Nature exists as an integrated entity and itself has a law of circulation. Therefore, various natural resources are balanced while they are interrelated. If resources are collected and disposed of in disregard of this law of circulation, that balance will be disrupted, thereby bringing about dreadful impacts on our lives in some instances." Already 40 years ago, the perception about the use of resources with less loads on the environment on the basis of nature's circulation and ecosystems was presented. As we have seen, nonetheless, the collection of resources and the discharge of wastes in Japan have rapidly increased in the meantime, thus forming a society of mass-consumption and mass-discharge. In terms of outcomes, it follows that the purport of this report has not been realized.
As Japan's socioeconomic structure is oriented toward mass-consumption and mass-discharge, there is concern about a reduction in sustainability in terms of utilization of those substances.
(2) Increases of Material Consumption Due to Changes in Consumer Life
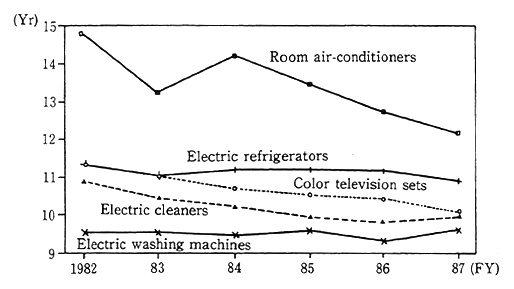
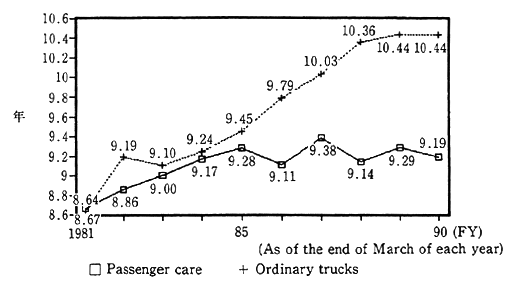
As we have described, in order to enhance the sustainability of Japan's economic performance, there is the need, first of all, to reduce the consumption of unnecessary products. Nevertheless, the brisk tone of business that has lasted from 1985 has driven consumer preference to run counter to sustainability, shifting it to one of high-quality and large-sized goods and enticing consumers into replacing goods with new ones. For example, automobiles on the market have become gradually larger in size (Fig. 3-1-24), and the periods during which household electric appliances and automobiles are used before their abandonment are shortened, or there are signs that moves for their use for longer periods come to a standstill (Fig. 3-1 25 and Fig. 3-1-26). In Japan, model changes are made in a cycle of 1 year or so for household electric appliances and about 4 years for automobiles. Such frequent model changes have advantages in themselves, such as an enhancement of technological innovations and products quality, but have constituted one factor for increases in consumption and abandonment by making exist-ing products look obsolete and stimulating consumers' preference for replacements. As regards systems on automobiles and various other products in use, it is pointed out that if they were not properly operated, it would shorten the periods in which they were used. With attention focused on those points, it has become necessary to study and cooperate among producers, consumers and administrators, in order to build a society in which goods may be cherished and used as long as possible.
Fig. 3-1-24 Trends in Shares in Number of Passenger Cars Owned by displacement volume
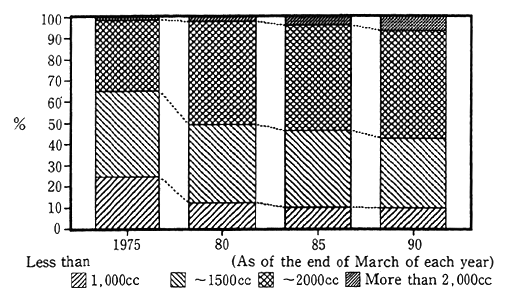
Source: Cooperation Society for Automobile Inspection and Registation: "Number of Automtbiles Owned".
Fig. 3-1-25 Trends in Average Years for Use of Household Electric Appliances
Source: Household Electric Product Association: "Report on Projec-tion,Survey and Research on Output of Discarded Household Electric Products".
Fig. 3-1-26 Trends in Average Years for Use of Automobiles
Source: Cooperation Society for Automobile Inspection and Registra-tion "Trends in Possession of Automobiles in Japan".
(3) Obstacles to Promotion of Recycling
a. Promotion of Recycling--Values and Necessity
Recycling is an act in which matter is circulated in a system of human activity by once again introducing discarded materials. By so doing, it is possible to reduce the collection of raw materials from natural ecosystems and the discharge of waste to natural ecosystems, while retaining consumption necessary for life, and enhancing the sus-tainability of economic performance.
Nonetheless, the values of recycling are not yet fully appreciated in the economic system. Recycled resources, such as old paper and scrap priced by manufacturing corporations, are compared with virgin resources, so that they are valued merely as resources. Manufacturers which are to become the users of recycled resources do not take account of the impact of a wide variety of environment conservation effects, such as reductions in the volume of wastes, drops in environmental loads accompanying waste disposal and in reductions of energy use and discharge of pollutants in the manufacturing process.
Having said so, recycling possesses external value which is undervalued in the present economy system. To give thought to its magnitude, let us think about costs for the treatment of wastes, which may be quantitatively assessed, as an example. In Numazu City, where recycling is in progress, the discharge of wastes per-resident a year is 321.7 kg (1988), 17% below the national average of 386.5 kg (1988). If recycling makes advances nationwide and the discharge of wastes per person drops to the same level as in Numazu City, it will be possible to save the cost for the treatment of wastes, which amounts to about 190 billion yen. At present, as local governments basically bear costs for the disposal of household wastes with general taxes, people are not con-scious about the costs needed for disposal of wastes, when they purchase merchandise or discard waste. As a result, they are hardly conscious about cost savings which might come from recycling.
In addition to the effect of saving costs for the disposal of wastes, recycling is of effect in enhancing sustainability, such as reductions of pollutant discharges and consumption of energy and resources. The effect will presumably amount to a considerable sum, though it is difficult to quantitatively assess the effect. Thus, as the values which are brought about by recycling are not fully appreciated in the existing economic system, recycling is done within the framework of profitability in the present system, so much so that its scale is much smaller than in situations where it would correctly reflect its values.
In the following section, we will describe steel cans and used paper, the goods with which people are familiar, in order to check where those goods stand in terms of the present state of recycling and think what barriers there are to stepping up recycling.
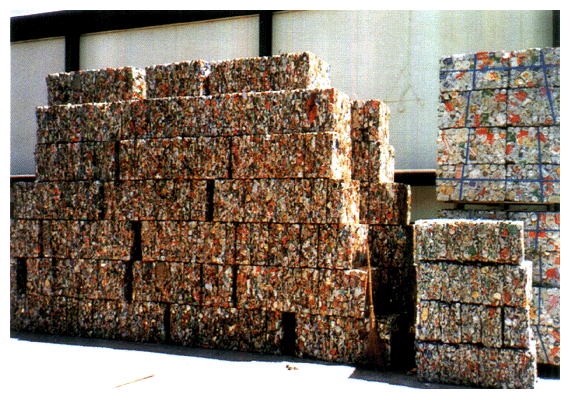
b. Recycling of Steel Cans
Steel cans accounted for about 70% of the output of cans for drinks and food in 1988. Gathered by means of separation and selection, they are pressed or crushed with shredders by dealers of renewable resources and then delivered to about 40 electric furnace steel makers around the country, who in turn melt, refine and process them to produce round rods and other steel materials for use in construction and civil engineering works.
Obviously, the weight of wastes will be reduced and resources saved if iron is recycled, but an estimate suggests that about 65% of the energy may be saved from iron ores over iron production. Another estimate indicates that the generation of air pollutants may be cut by about 85% and that of water pollutants by about 76% in the manufactur-ing process. Though a considerable degree of effort is required to maintain the quality of recycled steel, the effects brought about by the recycling of steel cans on environment conservation are indeed great. When it comes to cans and containers, such as steel cans, there still is no end to the careless discarding of empty cans, and their litter is a factor in the deterioration of the nearby environment. In this respect, too, it is important to collect empty cans without fail and recycle and reuse them.
Fig. 3-1-27 Trends in Rates of Recycling of Steel Cans
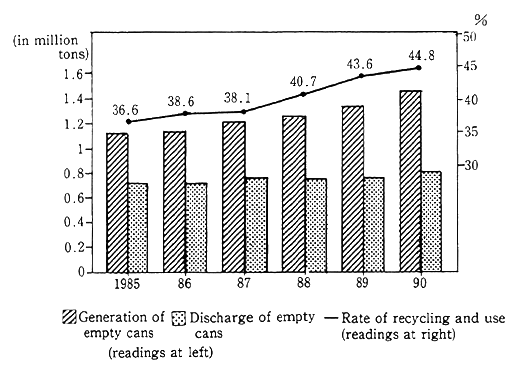
Note: As it is considered that the number gained by subtracting the number of empty cans recycled from the number of empty cans generated,that number is estimated as the number of empty cans discharged.
Source: Empty Can Disposal Measures Association.
Partly because of rising enthusiasm for recycling, the steel can recovery rate has gradually risen from 1987 or so (Fig. 3-1-27). As things now stand, however, the purchase prices of steel cans have significantly plummeted, as has been the case with imported scrap and iron ores, since the strong yen in 1985. Especially since the latter half of 1991, prices have dropped more sharply because of decrease of demand caused by decrease in electric furnace steel production under the decelerated economy (Fig. 3-1-28). Given this situation, when dealers in renewable resources purchase collected cans from local governments and other collectors, there have appeared cases where collectors con-versely call for dealers to take cans away at collectors' cost, so much so that the value of discarded steel cans as a resource is virtually unreal-ized.
Sharp drops in the prices of renewable resources threaten the management of dealers of renewable resources. They make it a practice to keep in store collected materials until they reach a specific quantity. Then they sort them out for delivery to wholesalers and makers. They are doing business at sizable tracts of land in primary suburban areas. Beside the drop in profitability due to the low prices of scrap iron, which we have mentioned earlier, land prices in major urban areas have skyrocketed, so that many dealers have been forced to either start different lines of business or abandon their business. In fact, the number of dealers began to drop in the 1981-85 period (Fig. 3-1-29). Moreover, as the prices of scrap iron started plummeting in the second half of 1991, it might be said that dealers engaged in the recovery of scrap iron are faced with a life-or-death situation. There is a danger that a further drop in the number of dealers in renewable resources who have sus-tained recycling in the past would significantly hamper the promotion of recycling.
Fig. 3-1-28 Trends in Scrap Iron Prices
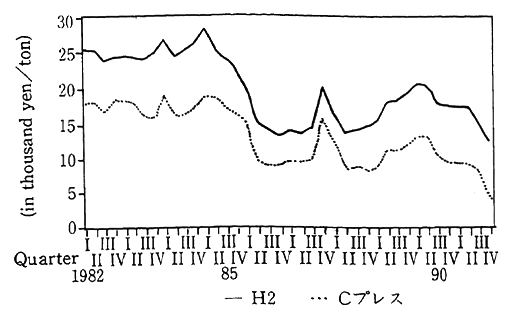
Notes: 1. The prices reprerent those at which scrap iron is bought by electric furnace plants in Kanto Region. 2. H2 and C Press represent the classes of scrap iron.Steel cans are classified as C Press.
Source: Nikkan Shikyo Tsushinsha.
Fig. 3-1-29 Trends in Number of Recyclable Resource Whole-sale Stores
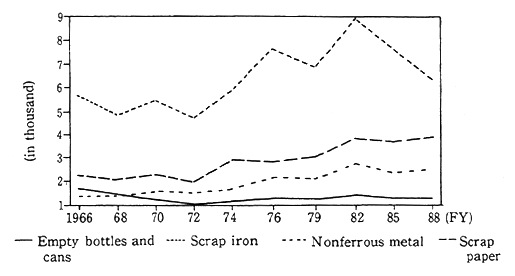
Source : Commercial Statistics Table
In a check of the total generation of iron scrap, designed to foresee how scrap iron demand looks in the future, the accumulation of iron in Japan continues to increase at a rapid pace, so that it may be projected that the generation of discarded scrap will continue to increase (Fig. 3-1-30). On the other hand, a check of scrap iron demand shows that most discarded scrap iron is used by electric-furnace steel makers for the production of ordinary steel, including steel materials for building, and a study has just begun to expand steel can use at blast furnaces. Discarded scrap steel is generated in proportion to steel generation, whereas demand for products does not exceed the annual flow in quantity. Given this factor, in order to maintain the balance between demand and supply of discarded steel, such measures are necessary as expansion of use in blast furnaces, development of new ways of utilization and promotion of export abroad.
Fig. 3-1-30 Accumulation of Iron and Steel and Generation of Discarded Scrap
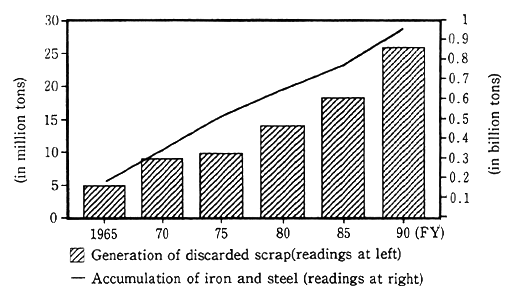
Having said that, the recycling of steel cans is a difficult situation with the fall of prices as the primary factor. Caused by the drop of costs of beverage containers, municipality government must pay cost to dealers in some cases, and must bear more and more expenses for recycling. Following the nose-diving of scrap prices in 1991, it is evi-dent that the purchase prices of steel cans, as long as the present economic system stays intact, might go down to a level where the recycling of scrap is not profitable, depending on signs of business on the part of electric-furnace steel makers. As we have earlier stated, the environment conservation effects of recycling will not been fully consid-ered, as long as recycling is done within the existing economic system. As a result, it is an urgent task to carry out sound recycling in the existing economy, how to realize proper cost sharing in this economy.
c. Recycling of Used Paper
As regards the recycling of paper, an estimate suggests that the use of energy in the manufacturing process may be reduced by 70-75%, the emission of air pollutants by 74% and that of water pollutants by 35% in addition to making wastes lightweight and reducing use of lumber resources. It may also be expected to reduce carbon dioxide associated with the combustion of paper and raise the absorption of carbon dioxide associated with the protection of lumber resources.
Because of the high value attached by paper makers to used paper as a domestically produced resource, the existence of unique collecting systems, such as the exchange of used paper with toilet paper, and other factors, the recycling of paper has been more advanced than in Western countries. The used paper recovery rate had gradually risen before it reached 50% in or around 1985.
Since 1985, paper production has rapidly increased due to an upturn in business and the use of office-automation (OA) paper in business. As against the rise in output, the recycling of used paper made no progress, the used-paper recovery rate hovered low, and the dis-charge of waste paper has sharply increased. Under the assumption that the portion gained by subtracting recovery from consumption and supply in the country is considered as abandonment, it can be estimated that the discharge of waste paper in the last 10 years has increased by about 1.5 timesfrom about 8.8 million tons in 1980 to about 14.3 million tons in 1990 (Fig. 3-1-31).
The recovery of waste paper has hovered low, largely because the purchase prices of waste paper have dropped, while the imports of waste paper have been on the uptrend with the yen becoming strong in 1985 (Fig. 3-1-32). As for OA paper the use of which has rapidly increased, there has been no progress in recovery and reuse, because the conven-tional recovery systems, such as the exchange of waste paper with toilet paper, has failed to respond to the increase. Additionally, businesses have been conservative about recovery in light of the handling of classified documents and other factors. Given those factors, the waste paper recovery rate had continued to drop, coming to 47.5% in 1988. In the meantime, the waste paper use rate in the paper manufacturing process has not fallen, and imported waste paper has been used for production.
Fig. 3-1-31 Trends in Scrap Paper Recycling Rate
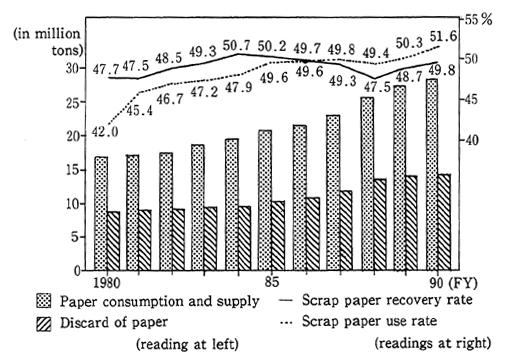
Note: The volume gained by subtracting the volume of scrap paper from the volume of paper (paper and cardboard)supplied for consumption is regarded as volume of paper discharge.
Sources: Ministry of International Trade and Industry, "Monthly Statisiscal Report on Paper and Pulp": Ministry of Finance: "Monthly Tables on Japanese Trade" Scrap Paper Recycling Promotion Center: "Annual Statistical Report on Scrap paper"
Fig. 3-1-32 Trends in Prices of Scrap Paper

Note:
1. The prices are those at which purchases are made by the factories of suburban makers in Kanto Region.
2. The Price for the third quarters of FY1991 is average price of those of June and July.
Source: Scrap Paper Recycling Promotion Center
With the rise in the use of compound materials, such as carbon paper, laminate paper coated with vinyl and heat sensitive paper, their mixing in the recovery process makes processing difficult in the produc-tion process. Thus the increase in the use of those materials hampers recycling.
In 1988, there was an atmosphere conducive to recycling due to an enhancement of consciousness about environment conservation, and waste paper recovery and use rates once again began to rise. In 1991, the waste paper recovery rate had reached 50.8%, and the task for the future is how to encourage the recovery of waste paper under unfavor-able conditions, as is the case with the prices of waste paper which hover low and dealers in renewable resources whose business remains sluggish.
On the other hand, recycling will not make progress unless demand for waste paper gets widespread. The development of recycled paper, for which waste paper accounted for 70%, by the Kanagawa Prefectural Development and "F," a paper manufacturer, gave momen-tum to the use of recycled paper, such as OA paper whose consumption was rapidly rising, in sectors where quality paper had been used before. Recycled paper has more paper powder and lower in the degree of whiteness than virgin-pulp paper. On the other hand, it is easier on the eyes than white paper and drives fasten when printing is done on both sides. Those features suggested that it was fully usable in terms of quality. But its image was bad in terms of color and other factors and its prices were high because the purchases were small, so that its use was not widespread in the beginning. With its use spread among govern-ment organizations in the midst of a rising interest in the global environ-mental issues in or around 1989, demand for recycled paper began to go up. However, there still is concern that the prices of recycled paper are relatively high and that it is low in quality, and this concern hampers a further expansion in use.
As stated above, to promote recycling of waste paper, there are obstacles to overcome in both collection and use.
On the use side, the Japan Federation of Paper Manufacturers' Associations, an organization of paper manufacturers, came out in 1989 with a Recycling 55 Program, which was designed to raise the waste paper use rate to 55% in five years, and under the framework of the Law Concerning the Encouragement of Use of Recycled Resources enacted in October 1991, it was decided to raise the waste paper use rate to 55%. There is the need for a honest achievement of those targets.
Nonetheless, the use of paper in recent years has been increasing at a very rapid pace. Under the assumption that consumption continues to increase at the same pace as in the last 5 years, the use of lumber for paper production and the discharge of waste paper will continue to rise, even if the waste paper use rate of 55% is attained (Fig. 3-1-33). In order to reduce the collection and abandonment of resources and enhance the sustainability of the economy, society and the business community as a whole are called for to make efforts, such as for reduction in the recovery cost and expansion of recycled-paper demand, but not just the promotion by paper manufactures of the use of waste paper.
Fig. 3-1-33 Trends in Use of Resources for Paper Production and in Generation of Paper Trash After Achieve-ment of 55% in Terms of Scrap Paper Use Rate
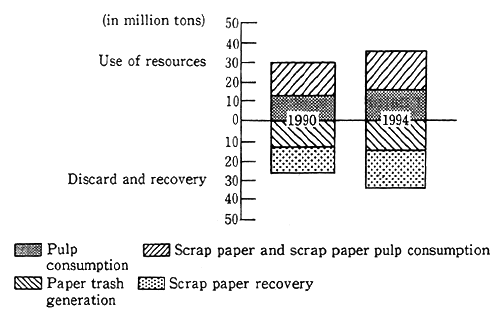
Sources: Estimated by Environment Agency based on the; "Annual Statistical Report on Paper and Pulp" ,Ministry of International Trade and Industry and the "Annual Statistical Report on Scrap Paper". Scrap Paper Recycling Promotion Center
Notes:
1. Actual values for 1990. Projected values for 1994 estimated with the paper consumption and supply assumed to increase in the same rate as recent 5years and with the scrap paper use rate at 55%.
2. Under the Law Concerning the Promotion of Use of Recycled Resources and other laws, the target is to raise the scrap paper use rate to 55% by 1994.
In this section, we have seen moves in Japan's material balance. While the consumption of substances is rising in the midst of an expan-sion of the economy and changes in the behavior of consumers, difficult issues are posed for recycling while the prices of recycled resources remain low. Collection of resources from nature and discharge into nature are on the upturn. In this respect, there is concern about potential impairment of the sustainability of Japan's economic society, and we must take more steps for sustainability.
3-1-3 Sustainability of Agriculture, Forestry and Fisheries and Environmental Protection
(1) Impact of Agriculture on Environment
a. Agriculture's Role for Environmental Protection and its loads on the Environment
Agriculture is an activity in which, based on the circulation of organic matter in ecosystems, matter is improved and production is done by increasing the yield of matter useful for man. In agriculture, it is inevitable that nature as it is should be changed, producing some sort of loads on the environment. If people utilize improper agricultural methods, it is possible to cause environmental destruction such as soil deterioration and destruction of vegetation by over cultivation and over grazing.
But, agriculture can not ignore the natural organic cycle since it must depend on productivity of crops and livestock. If the environment was significantly disrupted, there would be a drop in agricultural output. In agricultural production, careful consideration has been paid in the past so that the natural material circulations may be not be disrupted, presenting itself often as a fine example of sustainable harmony between human activity and the environment and a representation of the sustainable economic society. Moreover, agriculture has indirectly produced in some cases environment conservation effects in that agri-culture prevents land from being diverted for other activities, such as reckless development, which will produce an adverse impact on the environment.
In particular, the paddy fields, for which the farming method of irrigation is used, have functioned to conserve the environment in prevention of soil loss, water purification through nitrogen fixation, groundwater cultivation and flood prevention.
Rural villages are, so to speak, semi-natural areas, and nature and human activity are in harmony while they interact. They also have amenities of their own in terms of unique sights and the living environ-ment. This is also another function equipped to agriculture to conserve the environment (Fig. 3-1-34).
Fig. 3-1-34 Impacts of Agriculture on Environment
