Quality of the Environment in Japan 1990
Chapter4. Comprehensive Promotion Of Environment Administration
I. Budget for Environment Conservation
1. Outline of Budget, Financial Investments and Loans
A total of ¥1,329.5 billion was earmarked in the general and special accounts for the budget related to environment conservation for fiscal 1989, up ¥44.7 billion, or 3.5%, from the amount of the initial budget for fiscal 1988 which stood at ¥1,284.8 billion. Of this amount, ¥1, 185.4 billion was set aside for measures to cope with pollution and ¥144. 1 billion for measures for conservation of the environment (Table 4-1-1). The expenditure for public-works projects by institutions for which financial investments and loans were available in fiscal 1989 came to ¥1, 659.8 billion in the initial program, up ¥43.6 billion from the ¥1,616 billion set aside for the initial program of fiscal 1988.
2. Budget for Environment Conservation
Efforts have been made for the positive promotion of the budget related to environment conservation in fiscal 1989 with the focus partic-ularly on the following items for the execution of various administration on the environment, including the establishment of various criteria, etc., strengthening of surveillance and regulation, subsidization of projec-tions for pollution prevention, replenishment of the protection of suf-ferers from pollution, and the promotion of measures for nature conser-vation.
(1) Establishment of Various Criteria, Etc.
To step up the establishment of environmental quality standards, which form the basis for measures to prevent air pollution, water pollution and other types of pollution, and emission standards, etc., ¥1,007,660,000 was earmarked.
Table 4-1-1 Environment Conservation Related Budget by Ministry and Agency (Initial)
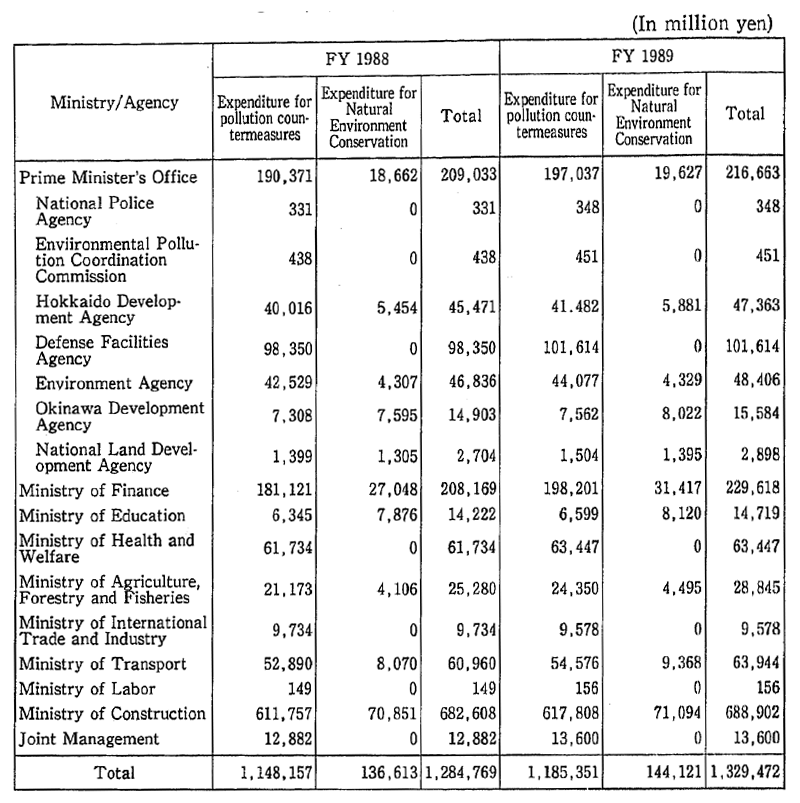
Remarks:1. Surveyed by the Environment Agency.
2. The expenditures which are allocated under implementation programs are excluded.
3. As the first digit of each figure is rounded to the nearest number, the figures thus rounded do not necessarily add up to the figures shown in "Total."
(2) Strengthening of Monitoring and Regulation
To strengthen monitoring and regulation over air, water pollution and the like, ¥5,970,750,000 was appropriated. As regards main items, it included ¥769,450,000 for facilities, such as for monitoring over pollution, at which the state of air and water pollution would be monitored, ¥505,820,000 for measures to assure the safety of chemicals, ¥364,200,000 for measures to prevent water pollution, and ¥269,540,000 for measures to prevent air pollution, etc.
(3) Subsidization of Projects for Polution Prevention
To step up the establishment of facilities for pollution prevention by private businesses, a total of ¥7,479,830,000 was earmarked. As regards main items, it included ¥3,773,640,000 for measures, such as the Japan Environment Corporation's projects for the construction and transfer of facilities, and ¥1,234,970,000 for measures to conserve the environment of fishing grounds.
(4) Promotion of Pollution Prevention-Related Projects, Etc.
To promote public-works projects related to pollution prevention, etc., a total of ¥1,114,661,910,000 was appropriated. As regards main items, it included ¥821,316 million for projects on sewer systems. In addition to ¥139,253,960,000 set aside for the prevention of noise to schools, houses and other facilities around public airports and defense facilities, ¥87,925,100,000 was appropriated for the development of waste treatment plants, ¥26,910,540,000 for drainage projects in farming hamlets, ¥10,640,880,000 for measures to cope with land subsidence, ¥4, 034 million for projects on green buffer zones, and ¥3,032,460,000 for construction work for pollution prevention at mines which were closed or the operation of which was suspended.
(5) Promotion of Surveys and Researches on Pollution Prevention
To strengthen and expand surveys and researches on environ-ment conservation, a total of ¥23,874 million was earmarked. As regards main items, it included ¥4,134,330,000 necessary for the National Institute for Environment Studies, ¥2,283.1 million for experi-ments and researches on pollution prevention, etc., by national institu-tions, ¥1,204,890,000 for the research and development of new-energy technologies, ¥747.1 million for surveys and researches on pollution prevention etc., and ¥510 million in grants-in-aid for scientific researches.
(6) Replenishment of Measures for Protection of Sufferers from Pollution, Etc.
For the replenishment of measures to protect sufferers from pollution, etc., a total of ¥24,684,530,000 was appropriated. As regards main items, it included ¥23,248,850,000 for the compensation for suffers from pollution, and ¥450,510,000 for arbitration and the like in disputes over pollution, etc.
(7) Promotion of Measures for Nature Conservation
To work for nature conservation, a total of ¥144,121,250,000 was appropriated. As regards main items, it included ¥3,943,290,000 for the management of national and quasi-national parks, etc., and the develop-ment of facilities, ¥107,001,330,000 for projects on parks designed to promote urban afforestation, ¥16,519,420,000 for the environmental development of ports and harbors, and ¥8,029,950,000 for the purchase of historic sites and other places, etc.
(8) Others
A total of ¥7,672,450,000 was appropriated, including ¥150,570, 000 for the promotion of the saving and recycling of resources.
3. Loan, Subsidy and Tax Measures for Pollution Prevention, Etc.
(1) Subsidization by JEC
a. Profile of JEC
Since its foundation in October 1965, the Japan Environment Corporation (JEC), acting as the institution specializing in the advance of subsidies for pollution prevention, has performed business on con-struction and transfer of facilities and also on loans to prevent air, water and other types of pollution, thus having positively promoted subsidization for measures by enterprises, etc., for pollution prevention.
(a) Construction and Transfer of Facilities
The business on construction and transfer of facilities are gener-ally classified into (1) buildings for collective use, (2) green park areas, such as a buffer zone, (3) green park areas to abate air pollution, (4) facilities of national and quasi-national parks and (5) sites for factories removal. Assigned business projects by enterprises, etc., who are to construct such facilities, JEC will do all lines of business on the execu-tion of the construction work and transfer the completed facilities to the enterprises at their cost prices with the long-term and low-interest repayment.
(b) Loan
Loan of business is designed to lend funds for (1) facilities for the prevention of industrial pollution, (2) projects for urban area soil pollu-tion control and (3) loan for the installation of individual sewage treat-ment.
b. Projects in Fiscal 1989
Actual projects in fiscal 1988 totaled ¥57.3 billion (¥40.0 billion for construction and transfer business and ¥17.3 billion for loan busi-ness), and those in fiscal 1989 totaled ¥69.0 billion (¥49.0 billion for construction and transfer business and ¥20.0 billion for loan projects).
(2) Advance of Loans by Other Government Institutions
a. Loans Under Funding System for Modernization of Facilities of Medium and Small Businesses
In the funding system for the modernization of facilities of medium and small businesses, prefectures serve as field offices in advancing loans to individual medium and small businesses with a view to encouraging the modernization of their facilities under the Law Concerning Funding and Other Subsidization for Modernization of Medium and Small Businesses. As part of this system, loans are advanced for pollution prevention facilities (only those specified in a government notice). In fiscal 1989, loans were advanced within the framework of ¥40 billion in the aggregate. For small and other entre-preneurs, a facility lease system is in force whereby facilities are leased by lending institutions established by prefectures. In fiscal 1989, facil-ities were leased within the lease framework of ¥51 billion the aggregate.
b. Loans by Smaller Business Financing Corporation and People's Finance Corporation
In fiscal 1990, the Smaller Business Financing Corporation and the People's Finance Corporation advanced special loans for industrial-pollution prevention and other facilities and also special loans for the move of medium and small businesses' factories to mitigate excessive congestion and prevent pollution.
c. Loans by the Japan Small Business Corporation
Under the systems of loans for sophistication by the Japan Small Business Corporation, long-term and low-interest loans are advanced to the entrepreneurs of medium and small businesses which carry out projects contributory to a structural sophistication of medium and small businesses. As part of this system, loans were advanced for projects for the grouping of factories which were to be moved to appropriate sites in attempts to mitigate the intermingled existence of houses and fac-tories and doing production under the same roof, and for projects done by the associations of medium and small businesses for joint treatment facilities for pollution prevention.
d. Loans by Japan Development Bank
The Japan Development Bank advanced loans for pollution prevention and established in fiscal 1988 a new loan system whereby to encourage the adoption of facilities where the emission of cholorofluorocarbons would be constrained. In fiscal 1989, loans were advanced within the pollution prevention framework of ¥65 billion.
e. Others
In addition, loans were advanced by the Hokkaido and Tohoku Development Corporation, the Agriculture, Forestry and Fishery Finance Corporation and the Metal Mining Agency of Japan.
(3) Tax Measures
a. National Taxes
(a) Special depreciation measures were formulated for dust collec-tors which were to be installed to dispose of specified dust.
(b) The term in which special depreciation measures were applicable has been extended for facilities to prevent noise and offensive odor in the category of pollution prevention facilities and for devices to treat toxic sludge in the category of facilities for the treatment of industrial wastes.
(c) The term in which special depreciation measures has been appli-cable has been extended for waste-plastic recycling devices and waste pavement material recycling devices, both being in the category of facilities for the recycling of wastes.
b. Local Taxes
(a) On autos which would satisfy regulations on exhaust gas in 1990, measures were formulated for cuts in the automobile, light-automobile and automobile acquisition taxes.
(b) The term in which special measures were applicable for the automobile, light-autombile and automobile acquisition taxes on electric cars has been extended.
4. Allocation of Costs for Pollution Prevention Projects by Entrepreneurs
The Law for the Burdening by Entrepreneurs of Costs for Pollu-tion Prevention Projects is so formulated that in situations where the State or a local government is to carry out pollution prevention projects, such as dredging projects, projects for the replacement of the soil of polluted farms with that of other places and projects for the develop-ment of green buffer zones, etc., as pollution is caused by corporate projects, the entrepreneurs involved are obligated to bear all or part of the project cost, depending on the degree to which the corporate project is held responsible.
According to the reports filed with the Environment Agency as of the end of March 1990, there had been 77 public-works projects perfor-med with an invocation of that law since its enactment (in May 1971).The total cost for those projects was about ¥166.8 billion, of which about ¥80.4 billion were burdened by entrepreneurs, the average burden-ing rate standing at 48.2% (Table 4-1-2).
The cases in which cost-burdening programs were determined with an invocation of the law in 1989 are shown in Table 4-1-3.
Table 4-1-2 Shares of Cost Burdens for Pollution Prevention Projects by Entrepreneurs
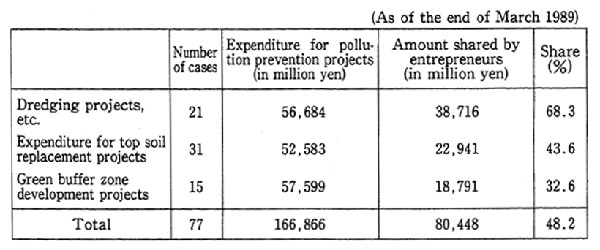
Remarks:1. Surveyed by the Environment Agency.
2. As there are projects in which dredging projects, etc., are conducted along with green buffer zone projects, the number of project-specific cases does not agree with the total of cases.
3. The expenditure for pollution prevention projects and the total of costs burdened by entrepreneurs are on a plan basis.
Table 4-1-3 Cases with Invocation of Law for Burdening of Pollution Prevention Project Expenditure by Entrepreneurs

II. Environmental Impact Assessment
(1) Outline of Environmental Impact Assessment Based on Cabinet Decision
In order that tragic pollution and the environmental disruption of nature may not be repeated and that drastic solutions may be found to the environment problems, it is extremely important to prevent environ-mental pollution.
The environmental impact assessment is something which, when a project is to be carried out with a danger of producing striking impacts on the environment, is designed to fully survey, predict and assess the impacts and release the findings, listen to the views of local residents and other people and formulate adequate measures for envi-ronment protection. It is an effective means to prevent environmental pollution beforehand.
Since the Cabinet approved the guideline "On Environment Con-servation Measures Associated With Various Public-Works Projects" in June 1972, environmental impact assessment has been conducted in Japan under the Public Water Body Reclamation Law and other individ-ual laws, administrative guidance by ministries and agencies as well as ordinances and procedures by local governments.
Moreover in August 1984, the Cabinet approved the "Guideline on Environmental Impact Assessment" and formulated an Operating Pro-cedure for Environmental Impact Assessment as a universal rule on large-scale projects in which the State would be involved.
The projects for which this operating procedure is invoked are those which are large in scale and likely to cause marked impacts on the environment. Carried out by the State or involving it in the issue of permits and so forth, Specified as falling under the category of those projects are on-the-surface development projects, such as road, dam, railway, reclamation, inning, land realignment and other projects.
The outline of the formalities followed by project undertakers follows (Fig. 4-2-1).
(1) On the impacts a subject project is to bring about on the environ-ment, the project undertakers shall survey, predict and assess them and prepare a report on environmental impact assessment and a report of preparations beforehand in accordance with a guideline which is for-mulated upon consultation between the competent minister (who has charge of the subject project) and the Director-General of the Environ-ment Agency.
(2) The project undertaker shall release a report on preparations for a review and hold briefings.
(3) The project undertaker shall strive to come to grips with the views of people who live in the related area. The project undertaker shall call on the competent Prefectural Governor to express his view after listening to the views of related municipal mayors.
Fig. 4-2-1 Flow of Procedures in Outline for Implementation of Environmental Impact Assessment
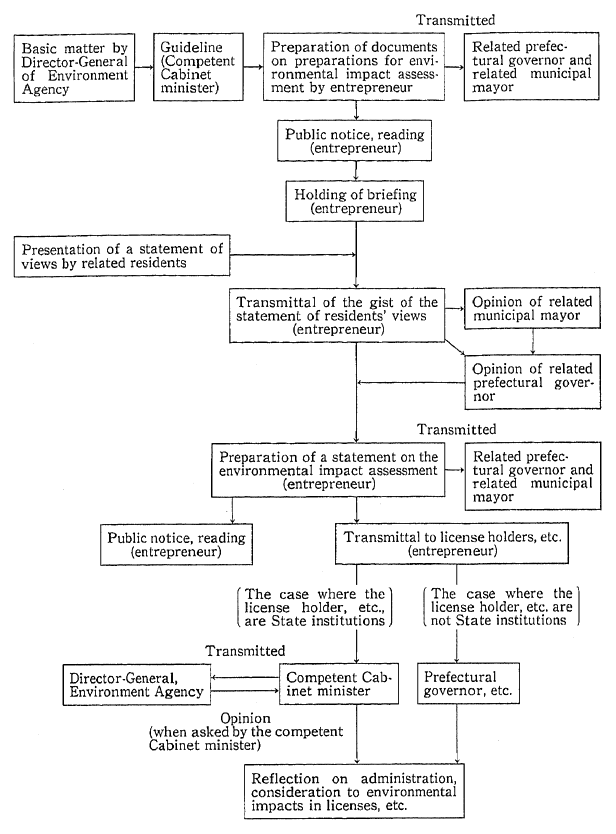
Table 4-2-2 Breakdown of Environmental Impact Assessments Made According to Cabinet Decisions (1989)

Remarks: The figures in parentheses represent the aggregates as of the end of 1989.
(4) After listening to those views, the project undertaker shall check the description in the report of preparations, prepare a report on environmental impact assessment and release it for a review.
In order to reflect the results of such environmental impact assessment on national administration, it is stipulated that administra-tive agencies shall take account of impacts on the environment on the basis of reports of environmental impact assessment when licenses are to be granted on subject projects. It is also stipulated that the competent minister may be able to seek counsel from the Director-General of the Environment Agency when there are items on which such counsel is considered required.
The environmental impact assessment which are made according to the Operating Procedure are something which is carried out after guidance is given and other administrative measures are taken to project undertakers by the competent minister. There were 20 cases of environmental impact assessment in 1989 for which the procedure was completed (Table 4-2-2).
(2) Environmental Impact Assessment, Etc. Underb Individual Laws, Etc.
Environmental impact assessment, etc., under the Port and Harbor Law, the Public Water Body Reclamation Law and other indi-vidual laws have been made in the past, and the gist of those made in fiscal 1989 is as follows:
(1) Port and Harbor Programs
The port and harbor programs stipulated under the Port and Harbor Law are those which portray the way the development, utiliza-tion and conservation of ports and harbors basically ought to be, and it is stipulated that when such programs are to be formulated, assessments be made on the impacts which will be produced on the environment.
In fiscal 1989, the planning panel of the Port and Harbor Council met four times and made necessary coordination in regard to port and harbor programs for Tachibana, Hakata and other ports.
(2) Reclamation of Public Water Bodies
It is stipulated under the Public Water Body Reclamation Law that when a license is to be granted for a reclamation project, impacts on the environment be studied beforehand, and in projects where up-wards of 50 hectares is to be reclaimed or special considerations are required in terms of environment conservation, the competent minister shall seek the counsel of the Director-General of the Environment Agency when a license is to be granted.
In fiscal 1989, a reclamation project in Yokohama Port was studied and the Director-General of the Environment Agency provided a necessary view.
(3) Location of Electric Power Plants
As regards to the location of electric power plants, it is stipulated that environmental impact assessment be made under the administra-tive guidance of the Ministry of International Trade and Industry, and that the conservation of the environment be studied also in deliberations at the Electric Sources Development Coordination Council.
In fiscal 1989, the Electric Sources Development Coordination Council met three times and made necessary coordination on plans for the Gushi River Hydroelectric Power Plant, etc.
(4) Others
a. City Planning for Built-up Urban Areas:
When it comes to city planning for built-up urban areas under the City Planning Law, it is stipulated that counsel be sought beforehand from the Director-General of the Environment Agency. In fiscal 1989, necessary coordination was made from a standpoint of the prevention of environmental pollution.
b. Development of Areas for Comprehensive Rest and Recreation
It is stipulated that when a basic plan is formulated and projects are carried out under the Law for the Development of Areas for Comprehensive Rest and Recreation, studies be conducted from a stand-point of environment conservation, depending on the substance of the projects, and that the competent minister shall consult with the Director-General of the Environment Agency when the former is to approve the basic plan. In fiscal 1989, necessary coordination was made on the plan of Hokkaido and nine other prefectures.
In addition, necessary coordination was made from a standpoint of environment conservation in regard to programs for projects and so forth on which consultations had been made with the Environment Agency.
(3) Approaches by Local Governments
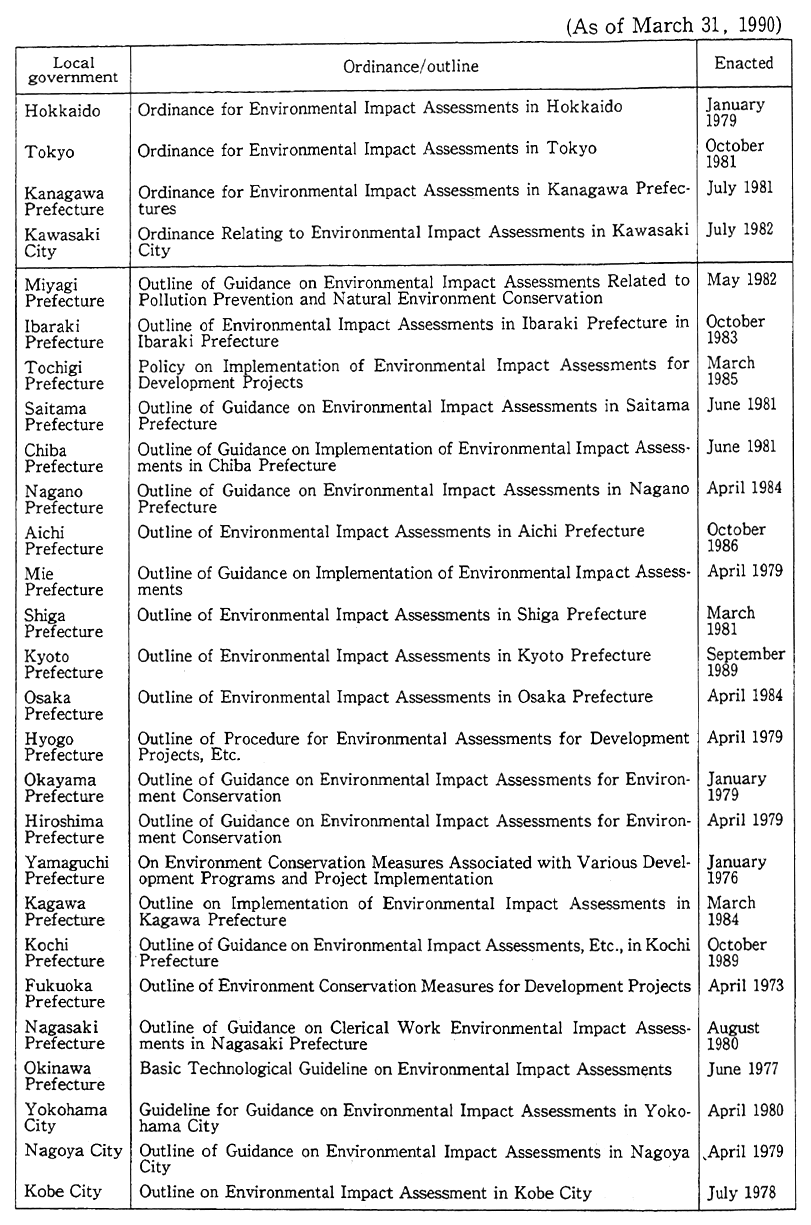
Local governments also grapple with environmental impact assessment, and of all prefectures and administrative ordinance-designated cities, Hokkaido, Tokyo, Kanagawa Prefecture and Kawasaki City enacted ordinances on environmental impact assess-ment, and 23 local governments formulated procedures and so forth (Table 4-2-3).
III. Community-Rooted Environment Conservation
1. Promotion of Environmental Management
(1) It is necessary that environment administration in the future should be oriented not just to the prevention of pollution at present but to the building of a much more comfortable environment as well, along with the pertinent conservation and utilization of water, air, forests and other environmental resources.
For this, there is the need to clarify a desirable local environment based on the intentions of local residents, and for its realization, to promote the management of the local environment in which various measures will be comprehensively and systematically carried out.
(2) Such management of the local environment has been studied by many local governments, and some of them have formulated local environment management programs or are promoting their preparation. But it is necessary work for a replenishment of their substance and provide local governments with guidance and counsel.
For this, the Environment Agency has continued studies since fiscal 1976. In order to contribute to the formulation and smooth imple-mentation of local environment management programs, the Environ-ment Agency made surveys and studies on the implementation of those programs and on concrete measures in fiscal 1989.
From a standpoint of the pertinent conservation and utilization of locally available environmental resources, subsidies were granted to prefectures which were updating information about environmental resources and formulating a guideline for environmental considerations to local development and local development programs with the utiliza-tion of "hometown" environmental resources.
Table 4-2-3 Enactment of Ordinances and Outlines on Environmental Assessments
(3) In the National Capital Region and other major urban areas, the environmental state mostly remain unsatisfactory, as is discernible from some areas where environmental standards are not satisfied, whereas there are mounting calls among residents for a more comfort-able environment. As moves are underway for a boost in domestic demand, many large-scale projects are planned, making it necessary to step up management of the environment from an inter-area perspective.
For this reason, measures for a reasonable conservation and utilization of environmental resources in the National Capital Region and other major urban areas were studied in the Inter-Area Environ-ment Resources Conservation and Utilization Survey as in the past.
(4) Let alone air pollution with nitrogen oxides, which is getting worse in urban areas, and pollution of an urban-life type, such as water pollution with daily domestic waste water, it is important to have a deep understanding about the present state of environmental problems and the significance of environment conservation and to behave in such a manner as to contribute to the conservation of the environment in the everyday life.
Given this factor, the establishment of a fund for the conservation of the local environment was subsidized for an energetic evolution of activity for the conservation of the environment across the nation so that stable financial resources may be assured for the development of an infrastructure for the conservation of the local environment and for various projects, such as education, propagation and enhancement on the environment to local residents and other people, by prefectures and administrative ordinance-designated cities.
(5) Particularly in urban areas in recent years, there have been rising demands for the development of underground space against the back-drop of skyrocketing land prices and a lack of urban space. Above all, underground space of the sort which cannot be utilized by landowners in normal circumstances (underground in great depth) is used for public purposes, such as railways roads and waterways, so that an institutionalization of its utilization is under study by related ministries and agencies. In conjunction with the utilization of underground space, there is concern about environmental impacts, such as ground subsi-dence and impacts on hot-spring sources.
As regards impacts on the environment of the ground for which prudent consideration is required, the Environment Agency began in fiscal 1988 to make a survey with the help of specialists in the Study Group on the Management of the Ground Environment for Underground Development.
2. Promotion of Building of Amenity Areas and Friendly to the Environment
Amenities, such as affluent green, a clean waterside, a beautiful street and a historic atmosphere provide charm and peace of mind to our lives. As needs for the people's life environment are getting sophisti-cated today, it has become all the more important not just to prevent pollution and conserve the natural environment but to positively create such a comfortable environment as well.
For measures to build a comfortable environment, a wide variety of measures, both in terms of hardware and software, are supposed, such as (1) the development of facilities with which to hold communion with a comfortable environment with green and water, (2) the conserva-tion of the favorable natural environment, including forests and water-side close by, (3) the creation of a comfortable urban and life space, such as the spectacles of roads and streets, (4) measures to assure a rule of life and behavior with consideration given to the environment in the daily life, and (5) the preservation of historic and cultural objects with which the quality of the environment may be enhanced.
For this, it is necessary in the building of a comfortable environ-ment for administrative agencies, residents and businesses, etc., to make clear their respective roles, opt for those measures, depending on the local features, and draw a direction toward increased amenity for a comprehensive and systematic evolution of the measures.
From this perspective, subsidies were granted to prefectures which were to formulate an Amenity Master Plan which would show a basic direction in which the building of a comfortable environment in municipalities in their jurisdiction in fiscal 1989 as in the past.
A symposium was also held for a nationwide permeation of a sense of consciousness about the building of a comfortable environment through an introduction of examples in various places.
Also in October 1989, a System of Citation to Local Governments Excellent at Building of Towns Full of Amenities was initiated whereby to commend local governments which had made meritorious achieve-ments in the building of a comfortable environment.
Cities, as they exist today, were formed primarily to make its urban functions efficient. It turns out, therefore, not only that nature existent close by in the cities has been driven to disappear but that the circulation of urban ecosystems has been impaired by the inefficient and sophisticated utilization of energy, and significant loads have been imposed on the global environment beside the arising of regional envi-ronmental issues, such as an increasing number of nights as hot as in the tropical zone.
To step up the building of cities with less environmental loads, therefore, it is necessary to introduce urban systems of an environment-conservation type, such as with water-permeable pavements, the utiliza-tion of waste heat from sewer systems and the use of natural energy, and to work out structural measures to regenerate the circulation of urban ecosystems. For this, subsidization measures were begun in fiscal 1989 for local governments which were to introduce urban systems of an environment-conservation type and formulate an Eco-Polis Program under which the conservation of nature in cities would be comprehen-sively stepped up.
IV. Environmental Pollution Control Programs
1. Outline of Environmental Pollution Control Programs
(1) Formulation of Environmental Pollution Control Programs
In accordance with Article 19 of the Basic Law for Environmen-tal Pollution Control, environmental pollution control programs are prepared by prefectural governors for areas the pollution of which is conspicuous, as directed by the Prime Minister and approved by the Prime Minister.
Under the programs, entrepreneurs, local governments and so forth shall promote projects and measures for the prevention of pollu-tion. Incidentally, for projects which are stipulated under Article 2 of the Law Concerning Special Government Financial Measures for Pollution Control Projects (hereinafter referred to as the "Special Financial Law for Pollution Control"), added national burdens or subsidies are avail-able for a further promotion of the measures.
Environmental pollution control programs were implemented for almost all major industrial cities and urban areas across the country from December 1970 to January 1977. In 1977 and subsequent years, the cities for which the program period had been completed were reviewed, depending on their actual situation. At present, programs are formulat-ed for 39 areas across the country (Table 4-4-1 and Fig.4-4-2), and measures for the prevention of pollution are comprehensively im-plemented in those areas.
Table 4-4-1 Formulation of Pollution Prevention Programs
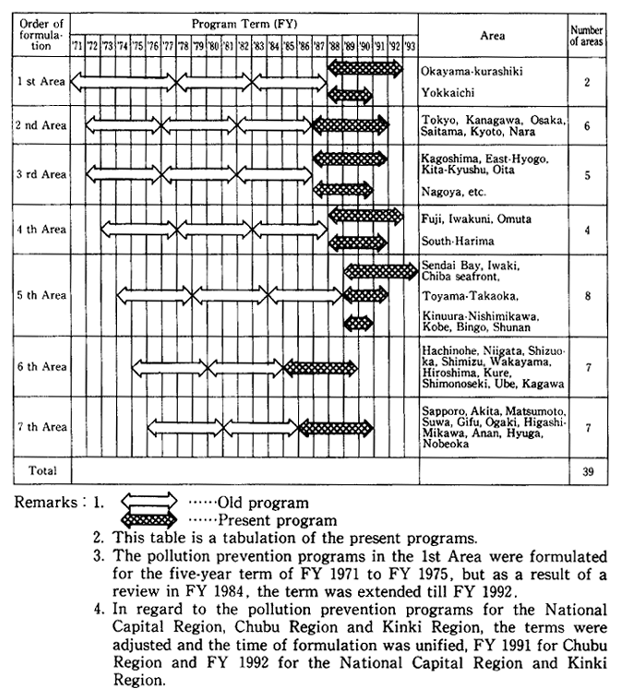
For the fifth set of areas for which the program period came to an end as of the end of fiscal 1988 (Sendai Bay and seven other areas), new environmental pollution control programs were formulated, featur-ing priority measures to cope with an urban and life type of pollution which has come to the fore in recent years.
Fig. 4-4-2 Areas With Pollution Prevention Programs Formulated (Present Programs)
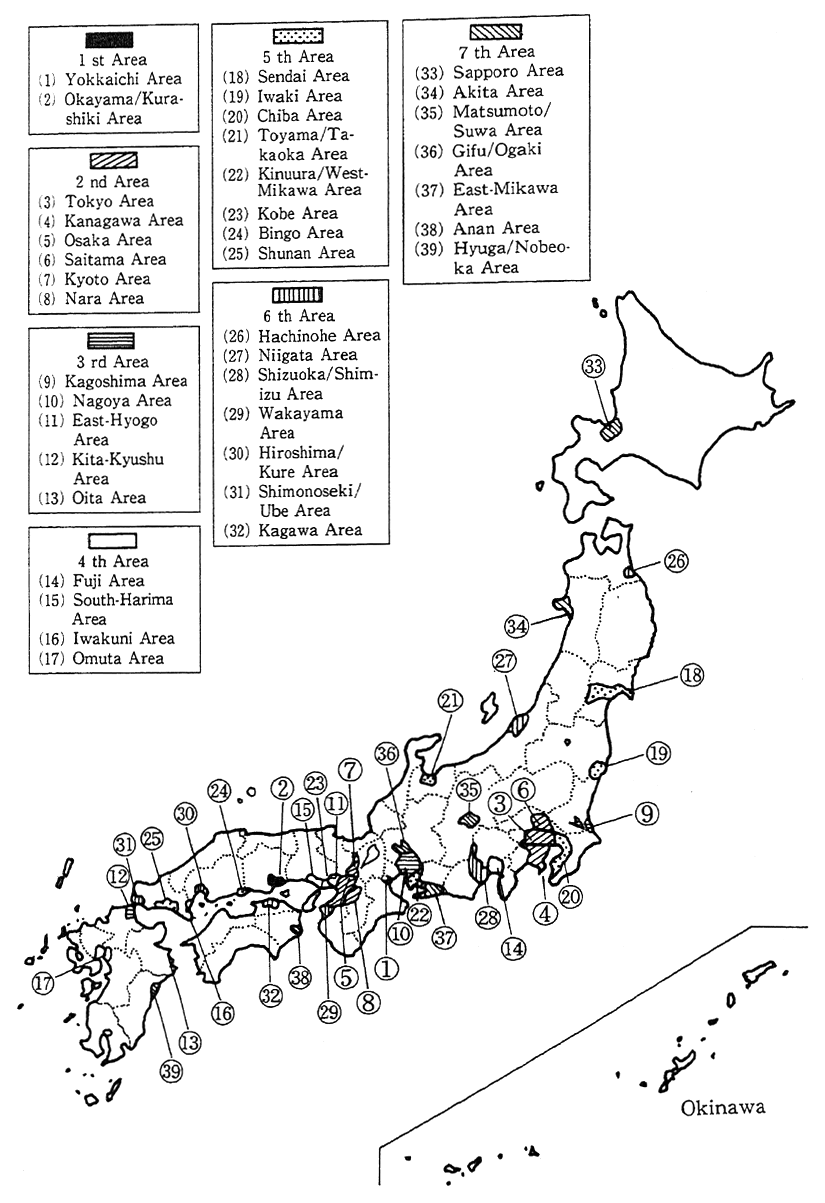
(2) Outline of Areas With Environmental Pollution Control Programs
The areas for which environmental pollution control programs are formulated cover major industrial cities and urban areas across the country. Those areas account for about 9% of the total area of the country, about 54% of the population and about 63% of the amounts of products shipped out.
2. Formulation of Environmental Pollution Control Programs for Fifth Set of Areas
(1) Notification and Approval of Formulation of Environmental Pollution Control Programs for Fifth Set of Areas
As the necessity of formulating new environmental pollution control programs was recognized for the fifth set of areas for which the program period had come to an end as of the end of fiscal 1988, the Prime Minister showed a basic policy on environmental pollution con-trol programs on September 8, 1989, and instructed related prefectural governors to formulate pollution prevention programs.
The related prefectural governors formulated environmental pollution control programs for each area in accordance with the basic policy, and the Prime Minister approved those programs on March 13, 1990.
(2) Outline of Environmental Pollution Control Programs for Fifth Set of Areas
The outline of environmental pollution control programs for the fifth set of areas is as follows:
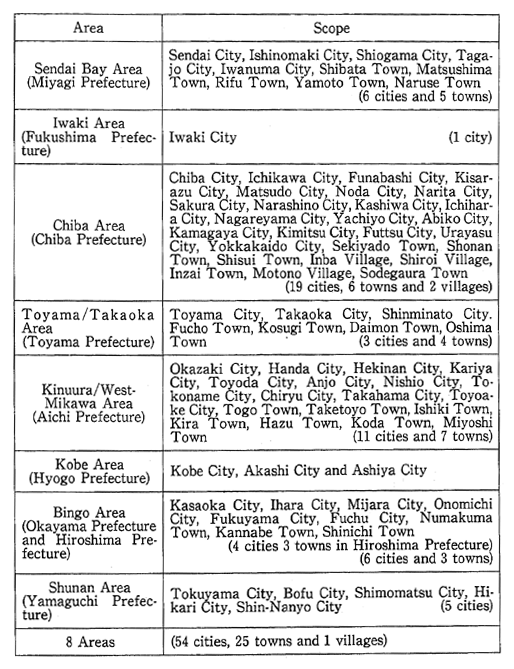
a. Scope of Areas
The scope of those eight areas is shown in Table 4-4-3.
Table 4-4-3 Areas with Pollution Prevention Programs Formulated and Their Scope
b. Program Targets
The program targets consist of environmental quality standards associated with air pollution, water pollution, noise, vibration, offensive odor, ground subsidence and soil pollution, etc., and it is decided to strive to accomplish the targets during the program period as a whole with the promotion of various measures for pollution prevention..
c. Program Period
The program period is set to five years from fiscal 1989 to 1993.
d. Measures for Pollution Prevention
It is stipulated that entrepreneurs shall take measures for the prevention of air and water pollution. It is also stipulated that local governments shall take measures, such as for a wide variety of controls on polluters and so forth, environmental impact assessment, guidance on location, legitimation of land utilization, and measures for medium and small businesses, and that they shall concurrently carry out projects against pollution, including the development of sewer systems, develop-ment of green buffer zones, development of waste disposal plants, development of the school environment, dredging and water convey-ance, land improvement for measures against pollution, and develop-ment of monitoring systems, and such pollution-related projects as the development of parks and green tracts of ground, traffic measures and ground subsidence-related measures, thereby working for a comprehen-sive promotion of the programs.
e. Outline of Costs
The costs which are required in those areas for the implementa-tion of measures for pollution prevention during the program period are estimated at ¥198.7 billion for those by entrepreneurs, ¥1,040.1 billion for projects against pollution and ¥556.7 billion for pollution-related projects.
3. Promotion of Implementation of Environmental Pollution Control Programs, Etc.
(1) Implementation of Environmental Pollution Control Programs
In accordance with environmental pollution control programs, local governments and so forth are comprehensively implementing measures for pollution control. The implementation is down in Table 4-4-4. The costs for projects against pollution were ¥1,725.1 billion and those for pollution-related projects were ¥748.9 billion, adding up to a grand total of ¥2,474 billion.
Table 4-4-4 Implementation of Pollution Prevention Programs
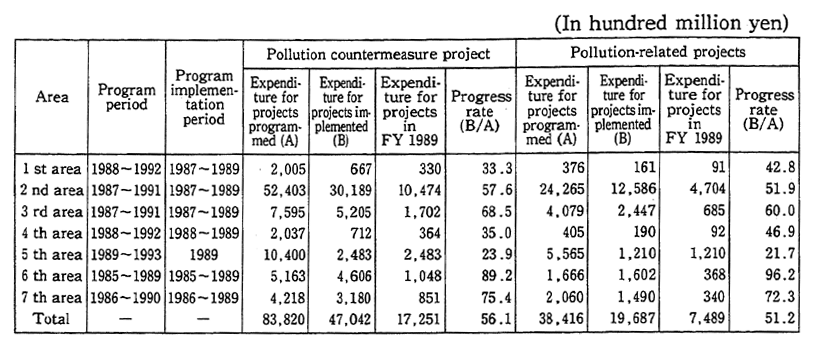
Remarks: 1. Surveyed by the Environment Agency
2. The "pollution countermeasure project," as referred to here, is a project related to pollution prevention. This category includes sewer system development, green buffer zone development, waste disposal facility development, school environment development, dredging and water induction, land improvement for pollution prevention, develop-ment of monitoring and measurement systems, etc.
3. The "pollution-related project," as referred to here is a projected related to pollution prevention. This category includes the develop-ment of public parks, green land, etc., traffic measures and measures to cope with ground subsidence.
4. The project expenditure for FY 1989 is an estimated figure.
5. The program period for the Yokkaichi area in the 1st area extended from FY 1988 to FY 1990.
6. The program period for the Nagoya and other areas in the 3rd area extended from FY 1987 to FY 1990.
7. The program period for the Southern Harima area in the 4th area extended from FY 1988 to FY 1991.
8. The program period for the Koromogaura/Western Mikawa area in the 5th area extended from FY 1989 to FY 1990, and the program period for the Chiba area and the Kobe area extended from FY 1989 to FY 1991.
(2) Special Government Financial Measures for Pollution Control Projects
In order to work for a further promotion of measures to control pollution, special government financial measures are taken for environ-mental pollution control projects which are carried out by local govern-ments and so forth according to the environmental pollution control programs under the Special Financial Law for Pollution Control. These special measures include the raise of the rates of national burdens and subsidies, an expansion of kinds of projects suitable for local bonds and the incorporation of the redemption of principal and interest on local bonds in the amount of standard financial demands.
The national costs for pollution control projects and the in-creased national burdens and subsidies in the last five years are shown in Table 4-4-5. and the increased amounts came to ¥23.7 billion in fiscal 1989.
(3) Conditions of Main Environmental Quality in Areas With Formulation of Environmental Pollution Control Programs
With the promotion of various measures under the environmental pollution control programs, the main environmental quality in areas for which environmental pollution control programs are implemented is as follows.
As regards sulfur dioxide, the rate of monitoring stations achiev-ing environmental quality standards (number of monitoring stations achieving environmental quality standards/number of effective monitoring stations) stood at 100% in fiscal 1988.
The response to environmental quality standards in relation to nitrogen dioxide is indicated in Table 4-4-6. The rate of monitoring stations which exceeded 0.06 ppm, the maximum value of the zone of environmental quality standards, stood at 6.7% in fiscal 1988.
As regards suspended particulate matter, the achievement according to the long-term assessments of environmental quality stan-dards are shown in Table 4-4-7. The rate of monitoring stations achiev-ing the standards in fiscal 1988 came to 36.2%.
Concerning photochemical oxidant, environmental quality stan-dards (with the one-hour value registered at less than 0.06 ppm) in fiscal 1988 were achieved by 10 out of 684 monitoring stations. The concentra-tions which exceeded standard concentrations for the issue of warnings (with the one-hour value at 0.12 ppm) were observed by 234 out of 684 monitoring stations.
With respect to the water quality of rivers, lakes, marshes and seas, the achievement of environmental quality standards for BOD) and COD (number of water bodies for which standards are achieved/number of all water bodies) is indicated in Table 4-4-8. The achievement rates in fiscal 1988 stood at 62.2% for rivers (BOD), 25.0% for lakes and marshes (COD) and 81.0% for seas.
Table 4-4-5 Project Expenditure Associated with Pollution Prevention and State Burdens or Amounts of Subsidies Raised
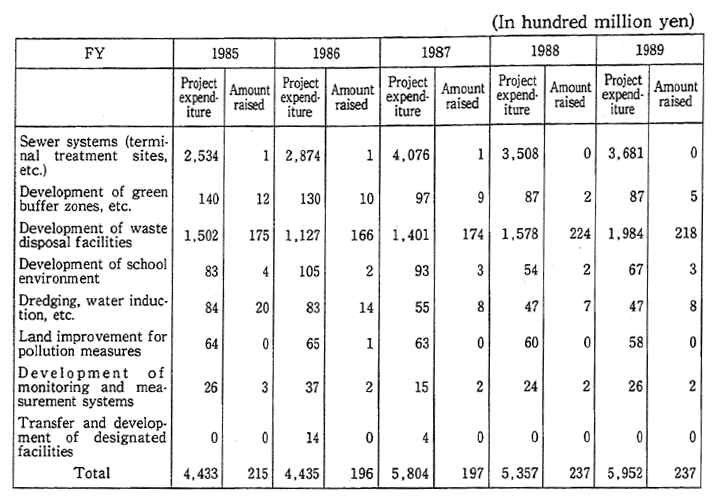
Remarks: 1. Surveyed by the Environment Agency
2. The amounts of the project expenditures and the amounts raised were those projected for FY 1989.
Table 4-4-6 Environmental Standards for Nitrogen Dioxide and Responses in Pollution Prevention Program Areas (General Stations)

Remarks: 1. Surveyed by the Environment Agency.
2. Monitoring stations whose values are less than the effective monitor-ing hours are excluded.
3. Zaruzman's coefficient = 0.84
Table 4-4-7 Achievement of Environmental Standards for Suspended Particulate Matter in Pollution Prevention Program Area (General Stations)

Remarks: 1. Surveyed the Environment Agency.
2. The monitoring stations which have not reached effective monitoring hours are excluded.
Table 4-4-8
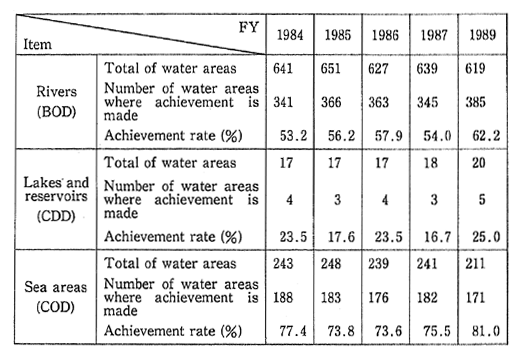
Remarks: Surveyed by the Environment Agency
(4) Execution of Pollution Prevention Projects As Directed by Home Affairs Minister
Of all projects for pollution control, such as dredging and mea-sures against farmland soil pollution, which are carried out by local governments in areas other than those for which environmental pollu-tion control programs are formulated, those which are designated by the Home Affairs Minister upon consultation with the competent minister and the Director-General of the Environment Agency are entitled to the same special financial measures as in pollution control projects based on environmental pollution control programs.
V. Environment Protection Against Impacts of High Technology
In recent years, technologies centering on so-called high technol-ogy have remarkably developed, as is the case with microelectronics, new materials and biotechnology. In this conjunction, Japan's industrial structure is undergoing change.
In light of the development and utilization of such technologies, it is pointed out that there might arise new types of pollution in terms of the sources of pollutants, forms of effluence and impacts.
Given such changes in the states, it is important in the utilization of high technology to make full prior studies on potential impacts on the environment to see to it that there will not arise problems on the environment in the future, and to positively work for the application of fruits of high technology in environment protection.
The Environment Agency compiled a Report on the Environmen-tal Technology Conference in April 1987 on the basic direction of environment protection in response to the evolution of high technology. On the sector of integrated circuits (IC) in whose environmental impacts there is a growing interest, the agency has released technical informa-tion and data and performed a Fact-Finding Survey on the Environmental Impact by the IC Industry (in fiscal 1986) jointly with the Ministry of Health and Welfare, the Ministry of International Trade and Industry and the Ministry of Labor. With respect to the sector of new materials, the agency is collecting and updating technical information. It released "Information and Data Related to the Environmental Impact by Func-tional High Molecules" in December 1989.
As regards biotechnology, including recombinant DNA, a guide-line was formulated for safety in the phase of experiments, but in conjunction with increased tendencies in the industrial utilization in recent years, studies are underway on the safety in the phase of indus-trial utilization both at home and abroad.
In Japan, a guideline for the industrial utilization of recombinant DNA technology were released by related ministries and agencies in fiscal 1986, paving the way for the utilization of recombinant organisms in the closed system. On the utilization of recombinant organisms in the open system, field experiments have started in the United States and other countries, and studies on the safety are being made by related institutions in Japan. With a revision of the guideline on recombinant DNA experiments (Science and Technology Agency) in December 1988, ideas were presented on the experiments in open systems with plants.
In February 1989, the views expressed at the Committee on Biotechnology and the Conservation of the Environment held in the Environment Agency was incorporated in an interim report (Basic Concept on the Conservation of the Environment in Conjunction with the Utilization of Recombinant Organisms in the Open System), which in turn was released to the public. It is pointed out in the report that as regards to the utilization of recombinant organisms in the open system, it is appropriate to use it with prudent considerations, such as the step-by-step confirmation of safety and the assessments of impacts on ecosystems. To discuss biotechnology and the conservation of the environment, an expert committee was established in the Planning Department of the Central Council for Pollution Control in March 1989.
Particularly to pay consideration to the conservation of the environment in response to the utilization of genetically engineered organisms in open systems, the Environment Agency carried out a survey for the formulation of a methodology to assess the safety of microbial pesticides. The agency also began in fiscal 1987 a basic survey on methods for the monitoring of microorganisms and the utilization of biotechnology for the conservation of the environment.
Studies for the establishment of technologies on the prior assess-ment and management of safety of recombinant DNA technology in the open system were started in fiscal 1988 with the coordination of indus-trial, academic and government sectors with the Special Coordination Funds for Promoting Science and Technology.
The National Institute for Environmental Studies carries out research work on the development of highly sensitive plants to photo-chemical smog and other compound pollution with biotechnology as a means to utilize biotechnology for the conservation of the environment. It has also constructed facilities for the systematic conservation of microorganisms, working for the conservation of the genes of micro-organisms in relation to environmental pollution and purification which are useful for studies on the conservation of the environment.
VI .Safety of Chemicals
1. Promotion of Measures on Safety of Chemicals
(1) The Law Concerning the Examination and Regulation of Manu-facture, Etc. of Chemical Substances (hereinafter referred to as the "Chemicals Examination and Regulation Law") was enacted in October 1973, under which new chemicals have been screened before their production or import to see whether they are low degradable, high accumulative and chronically toxic (this procedure is known as a "prior screening of chemicals"), and chemicals which have those properties (specified chemicals) have been regulated on the production, import, utilization and so forth.
Moreover, according to a revision of this law in May 1986, the specified chemicals available earlier were designated "Class 1 specified chemicals," whereas chemicals which were not highly accumulative but low degradable and were suspected of chronic toxicity and other prop-erties were newly designated (designated chemicals). Surveillance is made over the amounts of their production and imports, and when the designated chemicals were considered likely to cause environmental pollution, which would in turn give rise to health hazards, it was stipulated that a survey be conducted on their harmfulness and that when chronic toxicity and other properties were detected as a result of the survey, they be designated as Class 2 specified chemicals and, if necessary, they be regulated on their production and import (Fig.4-6-1).
New chemicals were reported to the Minister of Health and Welfare and the Minister of International Trade and Industry. In fiscal 1989, reports were filed on 242 new chemicals, 200 of which were found to fall neither under the category of Class 1 specified chemicals nor under the category of designated chemicals, and 30 of which were found to fall under the category of designated chemicals.
Furthermore, as regards the confirmation of the safety of exist-ing chemicals, surveys and inspections are being carried out by the Ministry of International Trade and Industry on the degradability and accumulativeness of chemicals, by the Ministry of Health and Welfare on the chronic toxicity and other factors, and by the Environment Agency on the existence of chemicals in the environment. In January this year, tributyltin oxide (TBTO) was designated as a Class 1 speci-fied chemical and seven tributylphenyl tin compounds were designated as Class 2 specified chemicals. Including those chemicals, nine sub-stances were designated as Class 1 specified chemicals, 10 substances as Class 2 specified chemicals, and 22 substances as designated chemicals.
Fig. 4-6-1 System of Controls on Chemicals Under Chemical Substance Screening and Control Law
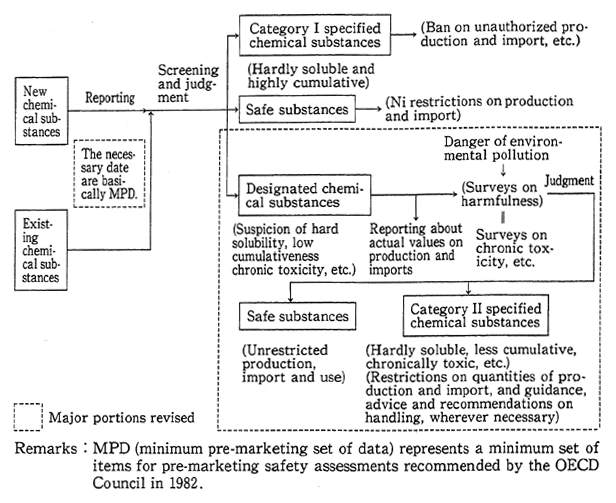
Remarks: MPD (minimum pre-marketing set of data) represents a minimum set of items for pre-marketing safety assessments recommended by the OEOD Council in 1982.
As regards trichloroethylene and two other chemicals, technical guidelines for the prevention of environmental pollution were prepared and other measures were taken in April 1989.
On the other hand, in order to ensure the reliability of test data and step up the mutual acceptance of data by countries, the Good Laboratory Practice (GLP) adopted by the council of the Organization for Economic Cooperation and Development (OECD) was adopted by Japan in March 1984 and put into effect, and efforts have been made to promote the mutual acceptance of test data under bilateral accords with West Germany, Britain and the Netherlands in GLP.
(2) The Ministry of International Trade and Industry is carrying out tests on the degradability and accumlativeness of existing chemicals to determine their safety. As of the end of December 1989, it was concluded that 790 substances did not fall under the category of Class 1 specified chemicals. In order to promptly and efficiently promote inspections on those existing chemicals, the development of new test methods, etc., is underway.
In order to inspect the safety of existing chemicals, the Ministry of Health and Welfare has been engaged over years in tests on the chronic toxicity of chemicals and research to develop methods to test their toxicity. Besides, it has cooperated in the collection by the OECD of information about safety tests on existing chemicals (EXICHEM Database) sincefiscal 1989.
(3) Since fiscal 1974, the Environment Agency has continued to survey levels of chemicals in the environment. In fiscal 1979, it began the First Comprehensive Environmental Survey on the Safety of Chemicals under a 10-year program to 1988 in order to efficiently and systemat-ically survey existing chemicals, which were described as numbering tens of thousands and assess their safety in the environment.
In the meantime, it became necessary to come out with new responses as there were new possibilities of pollution due to changes in production activities and life-styles and to high-tech industry and there arose the need to conduct surveys in an efficient manner in conjunction with the advancement of science and technology. In May 1988, the Expert Committee on Chemicals in the Central Council for Pollution Control made proposals on the way the Comprehensive Environmental Survey on the Safety of Chemicals ought to be in the future, featuring (1) a broader designation of chemicals to be surveyed, (2) a more strict selection of chemicals to be surveyed with the use of the prediction method of persistence in the environment, and (3) a broader designation of substances for the survey and a shorter survey period than earlier. On the basis of the proposals, the Second Comprehensive Environmental Survey on the Safety of Chemicals was started in fiscal 1989. The outline of the survey is shown in Fig. 4-6-2.
Fig. 4-6-2 Outline of the System of the General Inspection Survey
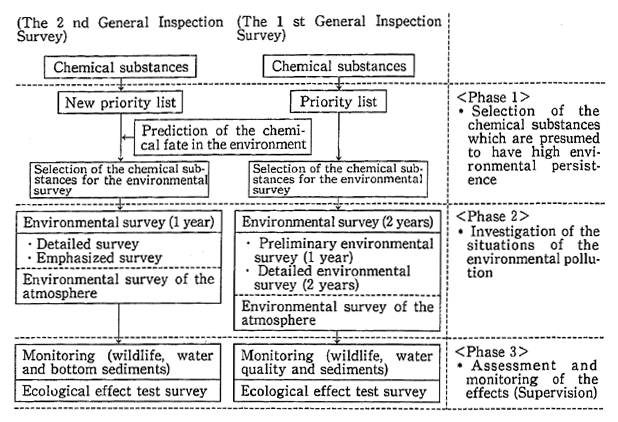
On the basis of this system, a survey on environmental impacts by chemicals, a test on ecological impacts, a GC/MS monitoring on the water and bottom sediment and a biological monitoring, etc., were performed in fiscal 1989. Related surveys and researches, such as the structure-activity relationship of chemicals, were also continued. In addition, surveys and researches were conducted on the basis of an expanded use of chemicals and other factors, including the development of measures and methods for comprehensive assessments on each environmental medium, the updating of information about environmen-tal chemicals, and surveys and studies on comprehensive measures to cope with environmental pollution by toxic chemicals.
2. Comprehensive Environmental Survey on Safety of Chemicals
(1) Preliminary Environmental Survey and Detailed Environmental Survey
In fiscal 1988, the Preliminary Environmental Survey was con-ducted in 24-25 districts across the country on water and bottom sedi-ments for 18 chemicals which seemed to be highly residual and in addition fish for five of those chemicals. As a result, three of those chemicals were detected from bottom sediments but none from water and fish. As regards anthraquinone among the detected chemicals, it was concluded that there was the need for a detailed environmental survey in fiscal 1989.
A survey was conducted on fish in two lakes concerning melamine which had been surveyed in the Detailed Environmental Survey in fiscal 1987 and had been detected in relatively high concentra-tions from fish in lakes and marshes. As a result of this survey, melamine was detected in one lake, but the data did not pose any serious problems.
On a total of seven substances--the triphenyltin compounds which are reported as having been detected with high concentrations in a few samples of fish and fishshells used in the process of development of analytical methods, and six chemicals which were decided to survey more detailedly as a result of the preliminary environmental survey conducted in the preceding fiscal year--water, bottom sediments and fish and shellfish were surveyed in 50 districts across the country.
As a result, the concentrations detected in the environment were not so serious as to cause problems for the six chemicals except for triphenyltin compounds. As regards triphenyltin compounds, the Expert Committee on Chemicals of the Central Council for Environmental Pollution Control evaluated as follows.
(1) The environmental pollution caused by those compounds are inter-regional, and the detected concentrations are also high.
(2) Judging from the state of the environment polluted by those compounds, the present pollution does not cause immediate adverse effects on human health, but should the present pollution level continue over time, it might cause adverse effects.
(3) Consequently, there is the need to conduct adequate surveys and take adequate countermeasures with close cooperation among the related organizations. It is also necessary to monitor the concentration of those compounds in the environment (Table 4-6-3).
(2) Outline of the GC/MS Monitoring for Water and Bottom Sediments
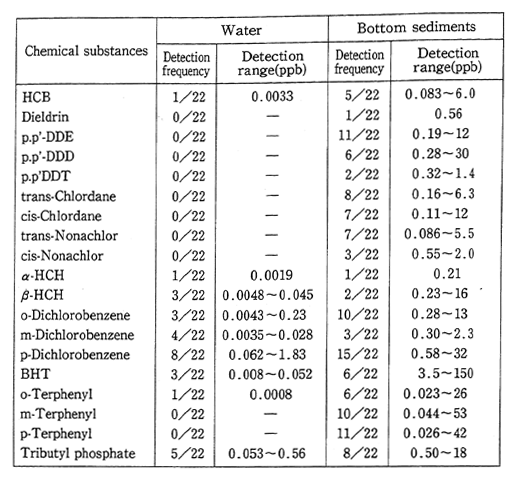
The Monitoring Survey of water and bottom sediments by gas chromatograph/mass spectrometer (GC/MS) has been initiated from fiscal 1986 as part of the Environmental Survey of Chemical Substances. This Survey uses GC/MS whose characteristic is that it can analyze many different kinds of chemicals simultaneously with high sensitivity. The objective of this survey is to watch over the yearly transition of chemicals which have been confirmed to exist in the bottom sediments and water from Environmental Surveys, etc., in the environment on a long-term basis, and to investigate into the unknown substances existing in the environment.
In fiscal 1988, this survey was conducted on 19 chemicals in 22 districts across the country. As a result, 9 substances including p-dichlorobenzene were detected from the water and all of 19 substances were detected from the bottom sediments (Table 4-6-4).
There are no substances which we can recognize special ten-dencies, judging from data in the last three years.
Table 4-6-3 Results of the Perliminary Environment Survey and the Detailed Environment Survey (FY 1988)
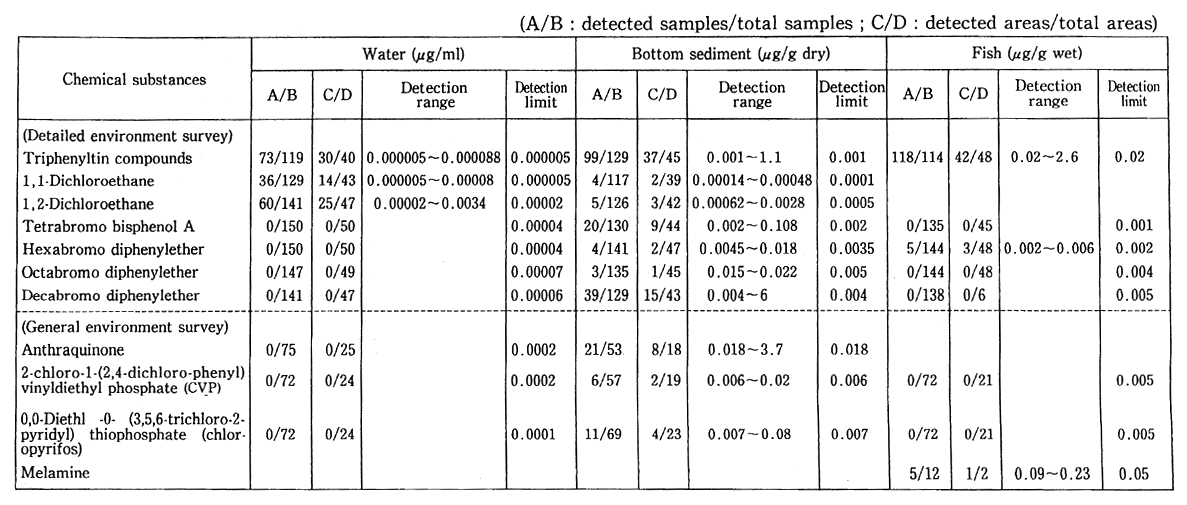
Non-detected substances : 2-sec-Butyiphenyl methylcarbamate (BPMC) m-Tolyl methylcarbamate (MTMC) n-Octyl amine Triethylene glycolethylether o,o-Diethyl fソ-cyanobenzylideneamino-oxyphoshpnothioate (Phoxim) 2-Chloro-1-(2,4,5-trichlorophenyl) vinyl dimethyl phosphate (CVMP) Ethyl 2-dimethoxythiophosphorylthio-2-phenylacetate (PAP) o-Isopropoxyphenyl methylcarbamate (PHC) 3,5-Xylyl methylcarbamate (XMC) 2,3-Dichloro-l-propene Solvent yellow-14 2-Isopropylphenyl methylcarbamate (MIPC) 1-Naphthyl methylcarbamate (NAC) 1,1,1-trichloro-2-methyl propanol
Table 4-6-4 Results of the GC/MS Monitoring Concerning Water and Bottom Sediment (FY 1988)
(3) Outline of Wildlife Monitoring
Wildlife monitoring is so designed that as regards substances on which a careful surveillance is considered necessary, according to the findings of surveys on Class 1 specified chemical substances under the Chemicals Examination and Regulation Law and Detailed Environmen-tal Surveys and so forth, to prevent the progress of environmental pollution of those chemicals, surveillance is conducted over years with wildlife (fish, shellfish and birds) in 17 districts across the country.
In fiscal 1988, the residual concentrations were surveyed for 31 substances. As for chlordane (five kinds of chlordanes), the findings indicated that the detected maximum concentration was at the same level for fish as in the preceding fiscal year, whereas it was lower for shellfish than in fiscal 1987. Pollution by tributyltin compounds gener-ally leveled off. Dieldrin was still detected in 10 districts. Judging from those findings, it was concluded that there was the need for a careful monitoring over the residue primarily of those chemicals in the environ-ment.
3. Outline of Survey on Residue of Designated Chemical Substances in the Environment
As regards designated chemical substances under the Chemicals Examination and Regulation Law, instructions are issued for surveys on the toxicity, depending on the residue in the environment, and according to the findings, they are designated as Class 2 chemical substances, restrictions are imposed on their production and imports and other measures are taken. For this reason, the Survey on Residue of Designat-ed Chemical Substances in the Environment was begun in fiscal 1988 to estimate the residue of designated chemical substances in the environment. For five substances in fiscal 1988, water and bottom sediments was surveyed in 17 districts and ambient air in 7 districts (Table 4-6-5).
Table 4-6-5 Monitoring Results of Environmental Persistence of Designated Chemical Substances, etc. (FY 1988)
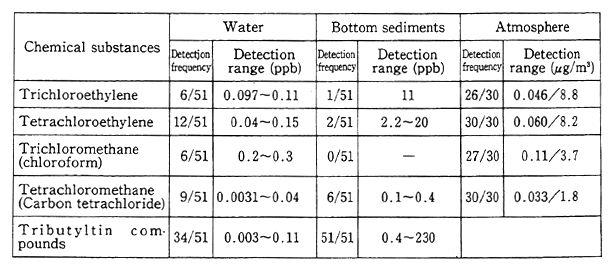
As regards the findings of this survey, the Expert Committee on Chemicals of the Central Council for Environmental Pollution Control evaluated as follows.
(1) It was confirmed that the five surveyed substances broadly remained in the environment.
(2) Comprehensively judging from the state of pollution by those chemicals, it was inconceivable that the current pollution levels were immediately dangerous, but when the state of their utilization and the findings of the surveys conducted in the past were taken into account, it seems necessary to broaden surveys on those substances and continue monitoring the environmental pollution carefully.
(3) In order to prevent the progress of environmental pollution by the five surveyed substances, it seems necessary to continue stepping up measures against environmental pollution with close cooperation among the related organizations.
4. Outline of Survey on Non-intentionally-Generated Chemical Substances in the Environment
This survey was begun in fiscal 1985 to estimate the actual state of environmental pollution by toxic chemicals like dioxin unintention-ally generated in the artificial process, including the production and incineration, and in the natural process, including reactions in the environment. In fiscal 1988, bottom sediments and fish, etc., were sur-veyed with polybrominated dibenzo-p-dioxins (PBDD) and poly-brominated dibenzofurans (PBDF) in addition to dioxins [the general appellation of dioxin (PCDD), polychlorinated dibenzofurans (PCDF)] as samples in 24 districts across the country.
As a result, the Expert Committee of Chemicals of the Central Council for Environmental Pollution Control evaluated as follows.
(1) As regards the state of pollution in the environment by dioxins detected in this survey, it was inconceivable that they would harm man' s health. (2) Though the concentrations were low according to the findings of the survey, dioxins were detected in the environment; there was the need (3) to carefully follow up on and monitor trends in the pollution, (4) to collect findings on mechanisms of pollution, including sources for the generation of dioxins and their behavior in the environ-ment and also on their toxicity.
In respect of PBDD and PBDF, the Expert Committee evaluated as follows.
(1) As PBDD and PBDF were not detected from any samples, it was inconceivable, judging from detection limit for measurement, tox-icity and so on, that those substances would harm man's health. How-ever, (2) PBDD and PBDF are substances similar to PCDD and PCDF, and there were few findings on those substances, there was the need (3) to collect findings on the toxicity, and (4) to survey the conditions of pollution over certain period.
VII. Environment Conservation in Land Utilization
1. Rationalization of Land Utilization
The National Land Use Plan is formulated to assure a stable and well-balanced utilization of the national land over years, as well as to conserve the natural environment with priority given to public welfare. It serves as an administrative guideline for utilization of the national land.
The National Land Use Plan (a national plan) was revised in December 1985. In response to this revision, the National Land Use Plan by 43 prefectures (prefectual plans) were amended (as of the end of December 1989). Guidance is provided to the municipalities through prefectures on the formulation of the National Land Use Plan by municipalities (municipal plans), and prefectures are subsidized on projects for the control and management of national land use plan in order to establish a system of national land utilization programs.
Basic land utilization programs are prepared by the governors of prefectures according to national land use plans. These programs are formed to designate five categories of districts and to coordinate land utilization. Transcending various programs under the City Planning Law, Natural Parks Law and other individual laws, those programs comprehensibly functions for coordination in the administrative sector and play a direct role in land dealings and indirectly serve as standards for regulation on land development through individual laws. Thus these programs promote land utilization in a legitimate and reasonable manner.
2. Rationalization of Industrial Location
In order to work for a drastic solution to the industrial pollution, it is necessary to rationalize the location of industrial plants. In major urban areas, attempts have been made to reduce new construction of plants by strictly invoking the Law Concerning Restrictions on Industry, Etc. in the Existing Built-up Areas of the National Capital Region and other laws.
Under the Industry Relocation Promotion Law, the system of subsidization for costs to promote the relocation of industry and other systems were used, and projects, such as those for the development of core industrial parks by the Regional Promotion and Development Corporation, were carried out in addition to loans and so forth advanced by the Japan Development Bank.
Incidentally, in carrying out measures for the relocation of indus-try, guidance was provided so that full consideration could be paid to environment protection in the location of industry and as regards the utilization of the sites from which factories had been moved out, consideration was given to improvements in the urban environment.
3. Development Green Buffer Belts
In order to prevent pollution and disasters and improve the environment, it is necessary to implement such measures as the rational-ization of land use including the construction of green buffer belts between the sources of pollution and disasters, such as factories, and urban areas. The Ministry of Construction subsidizes local governments and the Japan Environment Corporation, and the Japan Environmental Corporation develops green buffer belts and sell them to local govern-ments in order to promote the development of green buffer belts. In fiscal 1989, about ¥4 billion was laid out to subsidize projects at 19 places including the Futtsu green buffer belt (Futtsu City).
The Ministry of Transport is developing green buffer belts at seven airports including the Osaka International Airport and Fukuoka Airport (with the project outlay coming to ¥13 billion infiscal 1989).
VIII. Public Information and Education
1. Public Information
(1) General Public Information
With public-information activities through television, radio, news-papers and other media with the cooperation of related institutions, the distribution of the public-information journal "Kankyo (Environment)" and the lease of public-information movies made by the Environment Agency, attempts have been made to broadly appeal to the people and enhance their consciousness about environmental conservation. Infor-mation has also been released to press agencies at press conferences and with the distribution of data.
(2) Environment Week
In the Environment Week which starts on June 5, the World Environment Day designated in commemoration of the U. N. Confer-ence on the Human Environment in Stockholm in June 1972, "assembly for the Environment Week" which featured the official commendation of meritorious activities which contribute to environmental conserva-tion, lectures by opinion leaders, and other events including exhibitions under the theme of environmental conservation. Local governments were also called on to hold related events to further enhance the people' s consciousness about environment issues. With the cooperation of local governments, 22,000 saplings were planted in 39 prefectures and at 149 places, including welfare and other facilities in Fukuoka City, to propa-gate tree-planting ideas.
(3) Calls for Designation of "Action Day for Beautification of the Environment"
In order to propagate on a nationwide scale and beef up a environment beautification campaign unfolded at various places, the Environment Agency and the Ministry of Health and Welfare took the lead in calling on local governments to designate an "Action Day for Beautification of the Environment."
2. Environmental Education
(1) Environmental Education in General
In recent years, there has been a rise in the gravity of pollution of an urban and livelihood type and global environmental issues, and there have been increasing needs among the people for communion with nature close to us and the conservation and creation of a comfortable environment.
In order to cope with those increasingly complex and diversified environmental issues, each one of the people needs to have a deeper understanding about his or her association with the environment, and to live and behave with due consideration paid to the environment, so that the promotion of environmental education has become all the more important.
In order to have environmental education broadly take root, there is the need for a comprehensive and incessant approach. For this, we must develop a network for the offer of information, replenish it in terms of substance, develop strategic points, and support civil activities.
As the cooperation between the Environment Agency and the Ministry of Education is of particular importance for the promotion of environmental education, a liaison council was established between them in August 1989.
In order to study relations between the daily life and global environment problems and the way the life-style friendly to the earth ought to be, the "Meeting for the Study on the Global Environment and Life" is held to listen to views.
In order to promote environmental education in the regions, the Environment Agency began in fiscal 1988 to subsidize prefectures and administrative ordinance-designated cities which carried out projects for the promotion of environmental education in the regions, such as the formulation of a basic policy on regional environmental education. The agency also prepared a Report on Environmental Education in October 1989 which covered projects on environmental education in various places.
From a standpoint of encouraging an enhancement of the people' s participation in environmental activities, the Japan Environment Association, a foundation, produced television programs and movies, and held study meetings on environmental education. Besides, it held symposia on environment conservation and on a comfortable environ-ment under the cosponsorship with the Environment Agency. The Environment Survey Center, a foundation, conferred the Environment Prize, issued its bulletin "Environmental Research" and took other measures. The Clean Japan Center, a foundation, also evolves a wide variety of activities, including the propagation among the people of thoughts about the recycling of wastes to seek their understanding and cooperation.
In May 1989, an Environmental Information Propagation Center was established to contribute to the promotion of environmental educa-tion through the offer of easily-to-understand information about knowl-edge and thought about environmental science and technology.
(2) Education on Environmental Conservation at School
At school, environment conservation has been taught in the courses of social studies or science.
In the course of social studies at junior high school, for example, students are encouraged to understand that it is necessary to conserve the environment for improvements in the people's life and welfare. In the course of science, they are encouraged to take account of the importance of conserving the environment as there are cases in which the development and utilization of nature will sometimes destroy the balance of nature.
In the learning guidance procedures for elementary schools, junior high schools and senior high schools revised in March 1989, the substance of guidance on the environment was further replenished.
Chapter5. Air Pollution, Noise, Vibration, Offensive Odor--Present State And Measures
I. Present State of Air Pollution
According to the data provided by monitoring stations estab-lished across the country, the state of air pollution by type of pollutant are as follows.
(1) Sulfur Dioxide
a. Changes in Annual Average Concentrations
Data on the monitoring of sulfur dioxide were secured by 1,601 effective monitoring stations in 652 municipalities (the effective monitoring stations are those which did monitoring for more than 6,000 hours a year) in fiscal 1988.
Secular changes in the annual average concentration at 15 air pollution monitoring stations which have been in continuous operation since fiscal 1965 are shown in Fig. 3-1-1, Chapter 3. With a peak of 0.059 ppm in fiscal 1967, the mean has generally been on the decline, and in fiscal 1988, it came to 0.010 ppm, the same as in fiscal 1987.
b. Trend and Current State of Compliance with Sulfur Dioxide Environmental Quality Standards
(a) Compliance with the Environmental Quality Standards Based on the Long-term Criteria
The long-term criteria of environmental quality standard (EQS) means the case when the highest daily average readings at certain air pollution monitoring stations over a year, excluding the 2% highest readings (e.g., in the case that data is available for 365 days, the 8th highest daily average reading is evaluated), shall not exceed 0.04 ppm and readings of any two consecutive days over the year shall not exceed 0.04 ppm.
The degrees to which environmental quality standards were achieved on the basis of long-term criteria are shown in Table 5-1-1.
Table 5-1-1 Attainment of Environmental Quality Standards (Long-term Assessment)

Remarks: 1. Surveyed the Environment Agency.
2. The monitoring stations which have not reached effective monitoring hours are excluded.
(b) Compliance with the Environmental Quality Standards Based on the Short-Term Criteria
The rate of the number of monitoring stations with the daily average of downwards of 0.04 ppm on all effective monitoring days to that of effective monitoring stations stood at 98.9% in fiscal 1988, virtually the same as in fiscal 1987.
The rate of effective monitoring stations with the hourly average of 0.1 ppm at all monitoring hours to effective monitoring stations stood at 94.9% in fiscal 1987, slightly rising to 95.6% in fiscal 1988.
(2) Nitrogen Dioxide
a. Changes in Annual Average
(a) Air Pollution Monitoring Stations
Monitored data on nitrogen dioxide in fiscal 1988 were secured by 1,337 effective monitoring stations in 612 municipalities.
Secular changes in the simple mean of the annual average concen-tration registered at 15 monitoring stations which have been in continous operation since fiscal 1970 is indicated in Fig. 3-1-1, Chapter 3. Though there had been signs of a drop from fiscal 1979, it came to 0.028 ppm in fiscal 1988, leveling off from 0,028 ppm in fiscal 1987.
(b) Autombile Exhaust Monitoring Stations
Monitored data on nitrogen dioxide in fiscal 1988 were secured at 304 effective monitoring stations in 170 municipalities.
Secular changes in the annual average concentration registered at 22 monitoring stations which have been in continuous operation since fiscal 1971 are indicated in Fig. 3-1-1, Chapter 3. In fiscal 1988, the mean stood at 0.042 ppm, slightly rising from the 0.041 ppm registered in fiscal 1987.
b. Compliance with the Environmental Quality Standards Environmental Quality Standards for Nitrogen Dioxide
As regards the environmental quality standard associated with nitrogen dioxide, it is stated in the revision specified by the Environment Agency Notification No. 38 in July 1978 (hereinafter referred to as the "Notification") that "the daily average of hourly values shall be within or less than a range of 0.04 ppm to 0.06 ppm." It is stipulated that efforts shall be made to arrive at 0.06 ppm within 7 years (2-1, the Notification) in areas where the daily average exceeds 0.06 ppm, in principle, and that in areas where the daily average is in a range of 0.04 ppm to 0.06 ppm, efforts shall be made to maintain the present level or a level around it within this range or not to significantly exceed it, in principle" (2-2,the Notification).
In regard to 1,337 effective air pollution monitoring stations and 299 effective automobile exhaust monitoring stations (monitoring sta-tions with sampling inlets situated outside the driveway) in fiscal 1988, responses to environmental quality standards for nitrogen dioxide are shown in Fig. 1-1-2, Part I, depending on the monitored daily average value corresponding to 98% from the lowest over the year (hereinafter the annual 98% value of the daily average).
A check of air pollution monitoring stations where the annual 98% value of daily average exceeds 0.06 ppm, the upper ceiling of the environmental quality standard indicates that the value has generally leveled off, albeit with some fluctuations, in recent years, coming to 4. 1% in 1987. smaller than 6.0% registered in 1987.
There were 95 automobile exhaust monitoring stations (31.85%) where the annual 98% value exceeds 0.06 ppm, and they were concen-trated in major cities in Tokyo, Osaka, Kanagawa and other prefec-tures.
c. Trends in Air Quality of Areas within a Zone Specified by the Environmental Quality Standards for Nitrogen Dioxide
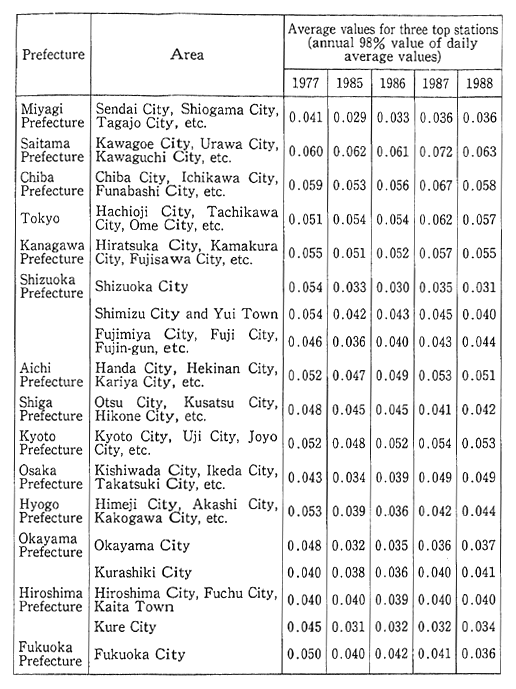
Trends in the environmental concentration in areas where the daily average of the environmental quality standard for nitrogen diox-ide ranges from 0.04 ppm to 0.06 ppm are indicated in Table 5-1-2. Trend are shown by the differences between monitored findings in fiscal 1975, which is the "present level "specified in 2-2, in the Notification and those monitored from fiscal 1985 to fiscal 1988.
d. Nitrogen Monoxide
(a) Air Pollution Monitoring Stations
Monitored data on nitrogen monoxide in fiscal 1988 were secured at 1,337 effective monitoring stations in 612 municipalities.
Secular changes in the simple mean of the annual average values at 29 monitoring stations which have been in continuous operation are indicated in Fig. 5-1-3. There were signs of a drop in fiscal 1971. It has generally leveled off in the last 10 years or so but was slightly lower in fiscal 1988 than in fiscal, 1987.
(b) Automobile Exhaust Monitoring Stations
Monitored data on nitrogen monoxide in fiscal 1988 were secured at 304 effective monitoring stations in 170 municipalities.
Secular changes in the simple mean of the annual average values at 22 monitoring stations (the same as in the case of nitrogen dioxide) which have been in continuous operation since fiscal 1973 are indicated in Fig. 5-1-3. It stood at 0.075 ppm in fiscal 1988 as was the case with fiscal 1987.
(3) Carbon Monoxide
a. Automobile Exhaust Monitoring Stations
The primary source of carbon monoxide is automobiles. In com-ing to grips with degrees of pollution, therefore, there is the need to check trends in the concentration of carbon monoxide on both sides of streets, intersections and other places where there is much traffic.
Table 5-1-2 Trends in Nitrogen Dioxide Concentration in Areas Within a Range of Daily Average Values from 0.04ppm to 0.06ppm
Remarks:1. Surveyed by the Environment Agency.
2. Areas with increases 2 areas
Areas virtually with the present levels. 16 areas
However the areas with more than 0.06ppm are counted as areas with increases.
Fig. 5-1-3 Year-specific Trends in Simple Average Values of Annual Values of Nitrogen Monoxide
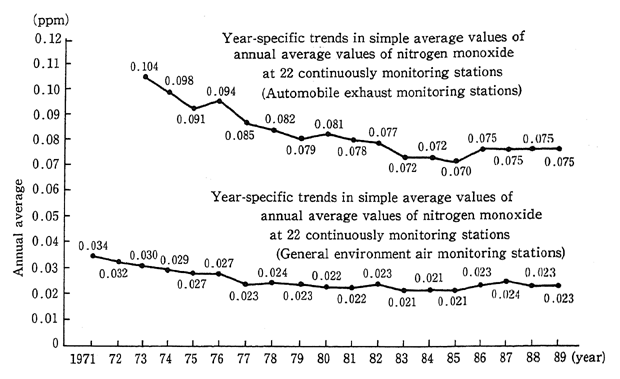
Remarks: 1. Surveyed by the Environment Agency.
2. Oxidization rate = 70%. This rate is also used later.
Monitored data on carbon monoxide in fiscal 1988 were secured at 305 effective monitoring stations in 179 municipalities.
(a) Trends of Annual Average Concentration
Secular trends in the simple mean of annual average values at 15 monitoring stations which have continued monitoring since fiscal 1971 are indicated in Fig. 3-1-1, Chapter 3. Though there were signs of a drop, but the simple mean has generally leveled off in the last several years, coming to 2.4 ppm in fiscal 1988.
(b) Compliance with Environmental Quality Standards
All of 301 effective automobile exhaust monitoring stations (effective monitoring stations with sample inlets placed outside the driveway) have attained environmental quality standards in long-term criteria. In short-term criteria, all monitoring stations except one monitoring station have attained environmental quality standards for daily average, and all monitoring stations have achieved environmental standards for eight-hour values.
b. Air Pollution Monitoring Stations
Monitored data on carbon monoxide in fiscal 1988 were secured at 186 effective monitoring stations in 160 municipalities. Environmental quality standards have been attained by all effective monitoring stations both for the eight-hour value and the daily average.
(4) Photochemical Oxidant
Monitored data on photochemical oxidant in fiscal 1988 were secured at 1,035 stations in 551 municipalities.
How often photochemical oxidant appears depends on weather conditions to a significant degree, so that there are fluctuations, depend-ing on the year, but the appearance decreased in fiscal 1988 from fiscal 1987. Among 963 monitoring stations which have continued monitoring since fiscal 1974, the average number of days per station with a concen-tration higher than that for which a warning is issued (0.12 ppm an hour) (Table 5-1-4).
(5) Nonmethane Hydrocarbon
In August 1976, the Central Council for Environmental Pollution Control filed a recommendation "Concerning the Guideline on the Concentration of Hydrocarbon in the Atmosphere to Prevent the For-mation of Photochemical Oxidant." It was recommended that nonmeth-ane hydrocarbon be monitored instead of all hydrocarbons and that the concentration of nonmethane hydrocarbon come within a range of 0. 20-0.31 ppm in terms of the average of three hours from 6 a.m. to 9 a. m, which corresponds to the envrionmental quality standard for photo-chemical oxidant, the one-hour value of 0.06 ppm.
Table 5-1-4 Trends in Average Number of Days with Concentrations Requiring Issue of Warnings (General Stations)

Remarks:1. Surveyed by the Environment Agency.
2. The Tokyo Bay area consists of Tokyo and six prefectures including Ibaraki, Tochigi, Gunma, Saitama, Chiba and Kanagawa.
3. The Osaka Bay area consists of Kyoto Prefecture, Osaka Prefecture, Hyogo Prefecture and Nara Prefecture.
4. The values in the table are computed by dividing the total number of days when the concentration exceeded at continuously monitoring stations by the number of continuously monitoring stations.
Table 5-1-5 Distribution of Annual Average Concentration of Non-methane Hydrocarbon (FY1988) at 6-9 O'clock
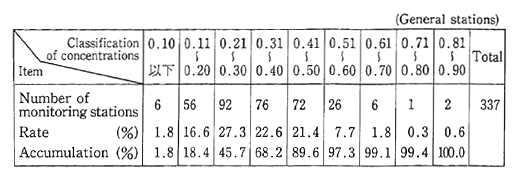
Remarks: Surveyed by the Environment Agency
Table 5-1-6 Year-specific Trends in Simple Average Values of Annual Values of Non-methane Hydrocarbon at 11 Continuously Monitoring Stations at 6-9 O'clock

a. Air Pollution Monitoring Stations
Monitored data on nonmethane hydrocarbon in fiscal 1988 were secured at 337 monitoring stations in 233 municipalities. The distribu-tion of concentrations in terms of the average from 6 a.m. to 9 a.m. is indicated in Table 5-1-5.
b. Automobile Exhaust Monitoring Stations
Monitored data on nonmethane hydrocarbon in fiscal 1988 were secured at 151 monitoring stations in 98 municipalities.
Secular changes in the simple mean of the annual average from 6 a.m. to 9 a.m. at 11 monitoring stations which have been in continuous operation since fiscal 1977 are indicated in Table 5-1-6.
(6) Suspended Particulate Matter
Monitored data on suspended particulate matter in fiscal 1988 were secured at 1,095 effective monitoring stations in 534 municipalities.
The rate at which environmental quality standards are attained according to long-term criteria has leveled off in recent years. But it dropped to 47.0% in fiscal 1988 from the 52.6% registered in fiscal 1987 (Fig. 5-1-7).
Secular changes in the simple mean of the annual average at 40 monitoring stations which have been in continuous operation since fiscal 1974 are indicated in Fig. 3-1-1, Chapter 3. Generally, there were signs of a drop but it has leveled off in the last several years.
Fig. 5-1-7 Attainment of Environmental Standards for Suspended Particulate Matter (General Stations)
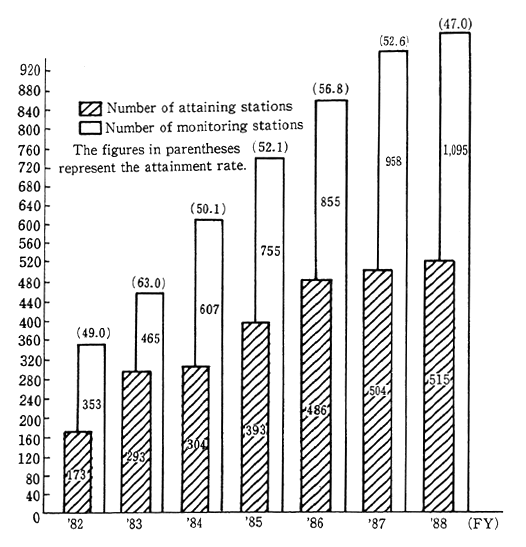
Remarks: Surveyed by the Environment Agency.
(7) Dust Fall
Dust fall, as referred to here, are soot and dust of the sort in particulate matter suspended in the atmosphere which falls by dint of gravity, rain and so on.
A check of the number of monitoring stations by quantity of fallen soot and dust at 1,336 points, where monitoring was done for hours longer than those for effective monitoring, of 1,424 monitoring points in fiscal 1988, there were 11 points with more than 20 t/km2/ month but less than 30 t/km2/month (three points infiscal 1987), and eight points with more than 30 t/km2/month(seven points in fiscal 1987).
(8) Other Substances
As regards particulate matter, attention has been focused in recent years not just on the quantity but on the components and other qualitative aspects as well.
At air pollution monitoring stations established by the central government in major areas across the country, the components of suspended particulate matter sampled with high-volume air samplers [benzene solubles, sulfates, nitrates, vanadium and other heavy metals, benzo-(a)-pyrene and so on) and those of suspended particulate matter sampled with low-volume air samplers (aluminum, barium and 29 other elements) in addition to the substances of which the surveillance and monitoring are constantly made as stated earlier. Besides, the monitor-ing and analysis of mercury began in fiscal 1982.
Asbestos, formaldehyde, dioxins and other chemicals have been continuously monitored one after another every other year since fiscal 1985. The survey findings thus far secured indicate that they have not reached levels which immediately requires some measures (Table 5-1-8).
(9) Findings of Monitoring by National Environment Air Monitoring Stations
National environment air monitoring station are established at the edges of major plains across the country for the constant monitoring of pollutants. The findings serve as a good means to know degrees (background values) to which the concentration in non-polluted areas stand (Table 5-1-9).
Table 5-1-8 Results of Monitoring Controlled Air Pollutants as of the End of FY1988
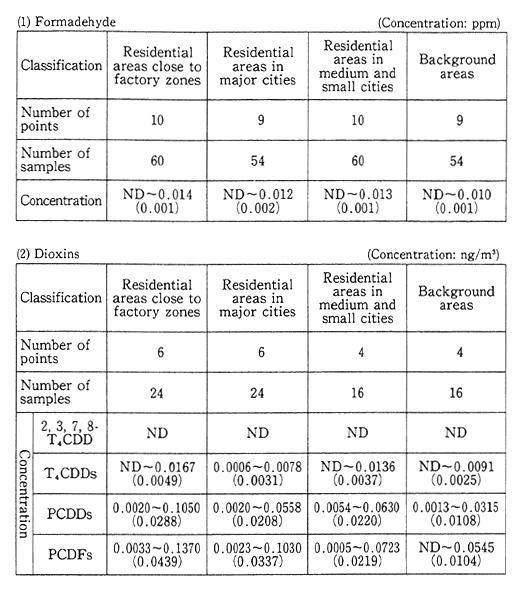
Remarks: 1. Surveyed the Environment Agency.
2. Ing represents one-one hundred millionth of 1g.
3. "ND" indicates "not detected."
4. The figures in parentheses average values (in terms of NF).
5. "2, 3, 7, 8-T4CDD" represents 2, 3, 7, 8 dioxin hetrachloride, "T4CDDs" represents total all dioxins hetrachloride, and "PCDDs" represents dioxins polychloride and "PCDFs" represents polychloridedibenzofran.
Table 5-1-9 Results of Air Monitoring at State-Established Air Monitoring Stations (Annual Average Values)
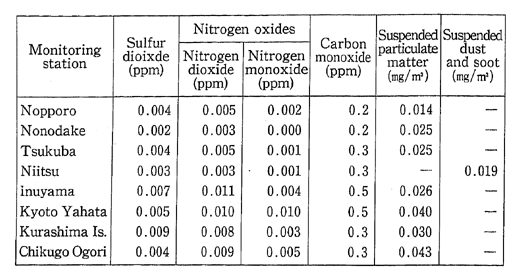
Remarks:1. Surveyed by the Environment Agency.
2. The figures in parentheses represent the annual average figures when the monitoring hours is less than 6,000 hours.
3. See Fig. 5-3-11 for the location of the monitoring stations.
II .Measures Against Various Air Pollutants
1. Measures Against Sulfur Oxides Pollution
(1) Emission Control
The emission of sulfur oxides is controlled both by emission standards for each facility and by areawide total pollutant load control standards for each factory in highly polluted areas. The emission standard per facility is known as the K control value, and the maximum tolerable emission value is determined, depending on the height of the outlet and the constant K value set for each area (16 rankings ranging from 3.0 to 17.5; the smaller the K value, the more strict the control). The K values have been gradually revised and reinforced eight times since December 1968.
The areawide total pollutant load control standard per factory is such that areas with a concentration of factories and business establish-ments where it is difficult to maintain environmental quality standards only according to emission standards are designated by the State as areawide total pollutant control areas, and this system is implemented under an areawide total pollutant reduction program formulated by the competent prefectural governor. At present, there are 24 such areas.
In October 1987, gas turbines and diesel engines were added to controls. The exercise of controls began on new facilities in February 1987 and on existing facilities in February 1991.
In addition, standards for the use of fuels concerning the sulfur content in oil fuels are determined for facilities for the source of soot in areas the air of which is extremely polluted, depending on the season, due to a rise in the consumption of fuels, such as with heaters, and for small-scale factories and business establishments to which areawide total pollutant control standards are not invoked.
(2) State of Measures to Cope With Pollution Sources
To cope with the sources of pollution in response to regulations on the emission of sulfur oxides, (1) the desulfurization of heavy oil and (2) the installation of facilities. to desulfurize exhausted smoke, etc., were implemented.
(1) For the desulfurization of heavy oil, direct and indirect desulfur-izers have been installed since fiscal 1967, and the capacity of dealing with heavy oil as of the end of fiscal 1988 stood at 66,000 kl/day with 12 desulfurizers and 138,000 kl/day with 29 indirect desulfurizers.
With the desulfurization of heavy oil and other measures, the mean sulfur content of heavy oil for domestic demand came to 1.08% in fiscal 1988.
(2) The research and development of smoke desulfurizers were started by the Ministry of International Trade and Industry in fiscal 1966, and the operation of practical models began in 1970. The number of desulfurizers installed and their processing capacity have steadily increased later (the installation of smoke desulfurizers by fiscal year is indicated in Fig. 5-2-1).
Thanks to the implementation of those measures, the pollution of the atmosphere by sulfur dioxide has remarkably improved. But as there are areas where environmental quality standards have yet to be attained, efforts are being made to probe the causes to the failure to achieve them, such as with inspections on the effects of existing measures, in areas where the standards have yet to be attained.
Fig. 5-2-1 Installation of Exhaust Desulfurization Facilities by Year
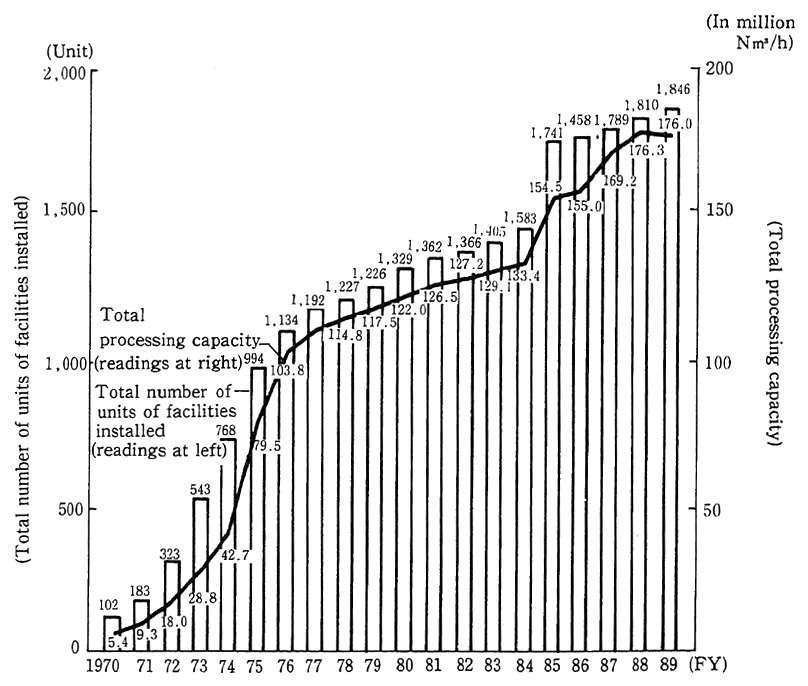
Remarks:1. Surveyed by the Environment Agency.
2. The figures for FY1982 and the preceding years are those as of January 1 of the given year, whereas those for FY 1983 and the subsequent years are those as March 31 of the given year.