Quality of the Environment in Japan 1989
Section4.Promotion of Regional Pollution Control Programs
1. Overview of Regional Pollution Control Programs
(1) Status of Formulation of Regional Pollution Control Programs
The regional pollution control program is a program for each area that already has considerable pollution, The program, directed and approved by the Prime Minister, is formulated by prefectural governors in accordance with Article 19 of the Basic Law for Environmental Pollution Control.
Project undertakers and local public entities are to promote projects and policies for preventing pollution under this program. The promotion is further reinforced by the national government which shares the costs or increases the subsidy for the projects specified in Article 2 of the Law on Special Financing for Public Pollution Control Projects by the government
Regional pollution control programs were established for most of the industrial cities and large urban areas in Japan from December 1970 to January 1977. In 1977, projects initiated after the end of the planning period were reviewed according to the situation of the individual areas. So far, the programs have been established in 39 areas (Fig. 1-2. Fig. 1-3), and comprehensive measures have been taken for proventing pollution.
For six areas including Yokkaichi district of the phase-1 and -4 areas whose program expired at the end of fiscal 1987, new pollution prevention programs have been set up with the aim of primarily dealing with the environmental pollution visibly prevailing in urban and living areas in recent years.
Fig 1-2 Past and Present Pollution Control Programs at a Glance
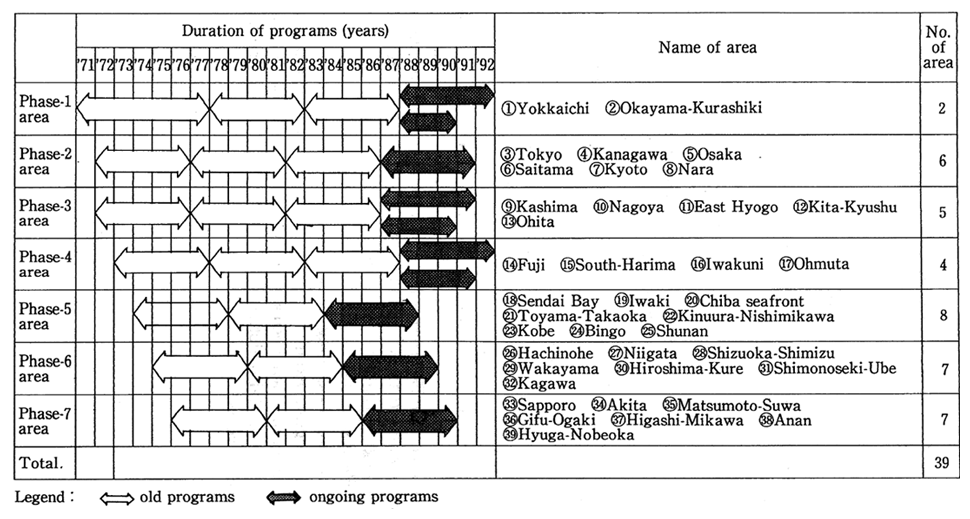
Notes 1. This diagram is designed to put the various ongoing programs in proper perspective.
2. The regional pollution control programs for Yokkaichi and Mizushima were drafted for implementation for five years from 1971 to 1975, but they were revised in 1974 to extend their duration until 1977.
Fig. 1-3 Map of Areas Under Regional Pollution Control Programs
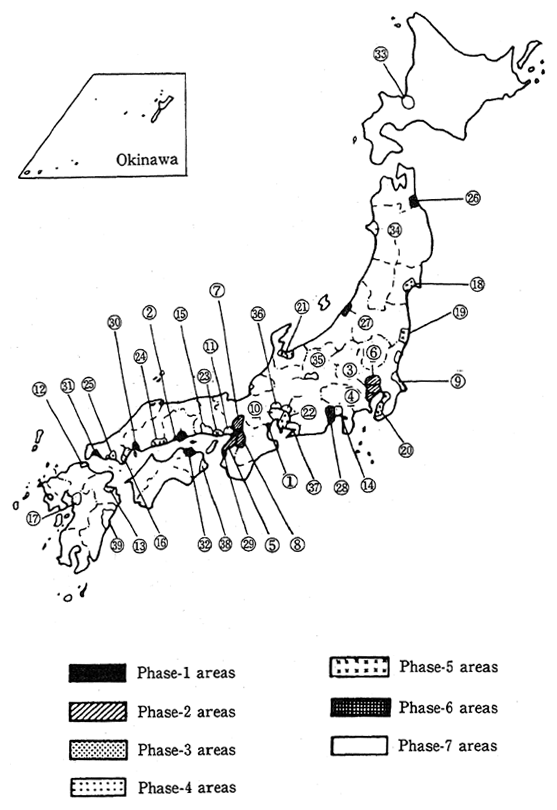
Note: Circled numbers correspond with numbers of areas in Fig. 1-2
(2) Overview of the Areas Covered by Regional Pollution Control Programs
All major industrial areas and cities are covered by the programs. These regions represent approximately 9% of Japan's total land area, 54% of its total population, and 63% of its total shipment of manufactur-ed goods in value.
2. Establishment of Environmental pollution Control Programs for Phase-1 and -4 Areas
Out of the phase-1 and -4 areas whose pollution control programs finished at the end of fiscal 1987, six areas including the Yokkaichi district were recognized as needing to undergo other pollution preven-tion programs. On September 22, 1988, the Prime Minister announced the basic policy for an environmental pollution prevention program to the governors of prefectures concerned and instructed them to set up pollution prevention programs suited for each prefecture.
In respect to the Mizushima area, there existed a lot of problems common to those in the neighboring Okayama area (Phase-6 area) such as water pollution in Kojima Lake. The Prime Minister therefore requested the drawing up of a pollution prevention program for the Okayama/Kurashiki area, putting the two areas together.
With regard to the Ohtake area whose program also finished at the end of fiscal 1987, the environmental quality or condition of the area was improved by the end of the program and there does not seem to be a threat of significant pollution in the future. Therefore, the government did not request the starting of a new anti-pollution program.
Governors of the prefectures concerned prepared the environmen-tal pollution prevention programs based on the basic policies applied for each prefecture. The Prime Minister approved these pollution preven-tion programs for each prefecture on March 9, 1989.
3. Promotion of Regional Pollution Control Programs
(1) Implementation of projects under Regional Pollution Control Programs
Under the regional pollution control programs, local authorities are working out all-around measures for controlling environmental pollution. In 1988, the total funds for these programs amounted to ¥2,360.4 billion. Out of the amount, ¥1,669.9 billion is for environmental pollution control projects and ¥690.5 billion is for related projects.
(2) Special Financial Measures for Regional Pollution Control Projects
To further accelerate pollution control, a set of special financial measures were taken by the government under the Law on Special Financial Arrangement for Environment Pollution Control Projects to finance pollution control projects carried out by local governments under the regional pollution control programs. These measures include an increase in the government share of expenses or in the ratio of its subsidies, expansion of types of projects covered by local government bonds, and appropriation of redemption funds of such bonds for standar-dized public service expenditure.
In connection with an increase in government expenditures and subsidies for environmental pollution prevention projects over the last 5 years, the increase in subsidies in 1988 amounted to ¥23,400 million.
(3) Environmental Qualities of the Areas Covered by Regional Pollution Control Programs
Through the implementation of proper measures under the pro-grams, the following improvements have been achieved in terms of major environmental quality parameters of the areas covered by these programs.
The ratio of monitoring stations which comply with a long-term criteria of environmental quality standard (EQS) for sulfur dioxide (SO2) (the number of monitoring stations which satisified EQS/the total number of valid monitoring stations) reached 99.9% in 1987.
With respect to EQS for nitrogen dioxide (NO2), it is shown in Table 1-5 and for 1987, the number of monitoring stations exceeding the upper standard limit of 0.06 ppm was 9.8% of the total valid monitoring stations.
Table 1-5 State of Compliance with Environmental Quality Standard for Nitrogen Dioxide
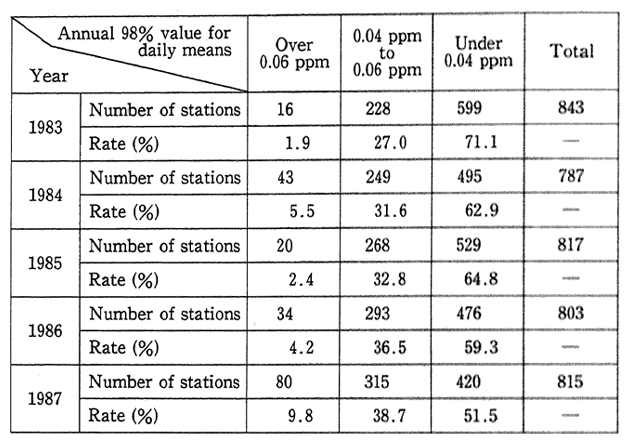
(General air pollution monitoring stations)
Notes: 1. Monitoring stations where the total monitoring period did not exceed the valid measuring hours were excluded.
2. Saltzman coefficient = 0.84
Table 1-6 gives the ratio of monitoring stations showing mea-sured results that satisfy EQS for suspended particulate matter (SPM) based on a long-term criteria. In 1987 the ratio of such monitoring stations reached 42.1%.
Table 1-6 State of Compliance with Environmental Quality Standard for Suspended Particulate Matter (based on long-term assessment) (General air pollution monitoring stations)
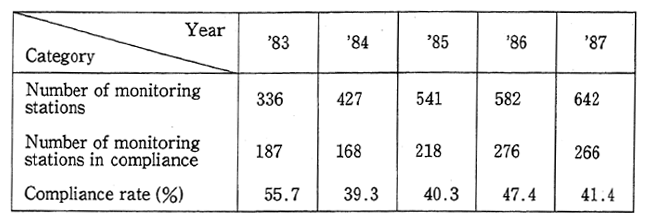
Note: Monitoring stations where the total monitoring period did not exceed the valid measuring hours were excluded.
As for photochemical oxidants, only 4 out of the 685 monitoring stations showed measured results in compliance with EQS (0.06 ppm per hour or less) in 1987 while 334 of 685 stations recorded photochemical oxidants in concentration above the warning level (0.12 ppm per hour).
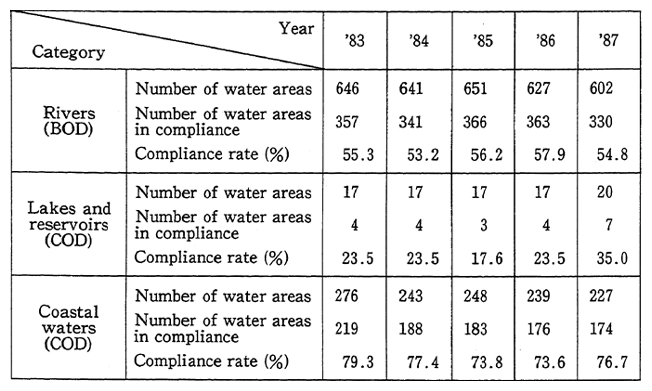
Table 1-7 shows the rate of compliance with EQS for rivers, lakes and reservoirs, and sea areas in terms of biochemical oxygen demand (BOD) and chemical oxygen demand (COD) (the number of water areas meeting the standards/the total number of water areas surveyed). In 1987, the compliance rate of rivers (in BOD) reached 54.8%, that of lakes and reservoirs (in COD) 35.0%, and that of sea areas (in COD) 76.7%.
Table 1-7 State of Compliance with Environmental Quality Standards for Rivers, Lakes and Reservoirs and Coastal Waters under Pollution Control Programs
Section5. Promotion of Measures for Environmental Conservation concerning High Technology
In recent years, advances in technology centering on the fields of so-called high technology such as microelectronics, new-materials, biotechnology are being made at a rapid pace, and accordingly Japanese industrial structures are changing.
In view of the present state of development and applications of such technology, it is pointed out that there is a possibility of the new kinds of environmental pollution in terms of sources, forms of discharge and impact of pollutants.
In light of such changes in the circumstances, it is important that, before making industrial applications of high tecnology, thorough pre-liminary surveys should be made on possible adverse effects of such technology on the environment to ensure that no such negative effects should arise in the future, and also efforts should be made to make full use of the results of development of such technology in order to promote environmental conservation.
For these purposes, the Environment Agency prepared the "Rep-ort on Environmental Technology Conference" in April 1987, on the basic direction in which environmental conservation should be promoted in response to the development of high technology. Among high technol-ogy fields, IC technology is creating much concern as a possible source of environmental pollution. In respect to this problem, the Environment Agency, Ministry of Health and Welfare, Ministry of International Trade and Industry, and Ministry of Labor jointly sponsored a study called "Joint Surveys on Environmental Conservation Related to IC Manufacturing Industries"(1986).
In the field of new materials, the Environment Agency proceeded with the collection and arrangement of technical information. In Decem-ber 1988, the Agency published the "Fine Ceramics Data Relating to Environmental Conservation."
Guidelines were previously established for gene recombination techniques and other fields of biotechnology, to ensure the safety of laboratory experiments. Recent trends toward the industrial application of biotechnology have led to a number of studies conducted in many countries including Japan for safety on the industrial application level. In 1986, relevant administrative office in Japan announced guidelines or draft guidelines for industrial ues of recombinant DNA techniques, and recombinant organisms began to be used in closed systems. Further-more, the use of the recombinant organisms in open systems has began to be studied in open-air experiments in the United States and some other countries. Organizations in Japan are also examining these sys-tems.
In December 1988, the operation of the Recombination DNA Experiment Guideline (the Science and Technology Agency) was revised and the idea of non-closed system experiments with plants was dis-closed. In February 1989, was announced an interim report on the "Discussion Committee on Biotechnology and Environmental Conserva-tion" established within the Planning and Coordination Bureau of the Environment Agency (the theme was environmental conservation in terms of the utilization of recombinant organisms in an open system). It was pointed out in this report that the utilization of recombinant organisms in an open system should be implemented with careful consideration in such areas as the assessment of its impact on eco-systems, and this by means of safety confirmation by stages, outdoor tests, etc. In March 1989, an expert committee was established within the Planning Department of the Central Pollution Measure Council in order to discuss biotechnology and environmental protection.
The Environment Agency made a survey to establish methods to evaluate the safety of microbial preparations to be used in place of agricultural chemicals, in order to consider environmental conservation in response to the utilization of gene recombination microbes in an open system. Since fiscal 1987, the Agency has been conducting basic surveys on microbial observation techniques as well as the application of biote-chnology to environmental conservation. In and after fiscal 1988, studies have been continued with the cooperation of industrial, academic and governmental groups using the budget for science and technology promotion in order to establish a technique to evaluate and control the safety of recombinant DNA techniques in an open system. The National Institute for Environmental Studies has been conducting biotech-nological research on the development of plants having a high sensitiv-ity to photochemical smog and other mixed types of pollution, as an approach to applying biotechnology to environmental conservation. The Institute has also been operating a microbial culture collection facility to preserve microbial genes that are related to the pollution and purifi-cation of the environment and may be useful in the study of environmen-tal conservation.
Section6. Measures for the Safety of Chemicals
1. Promotion of Measures Concerning the Safety of Chemicals
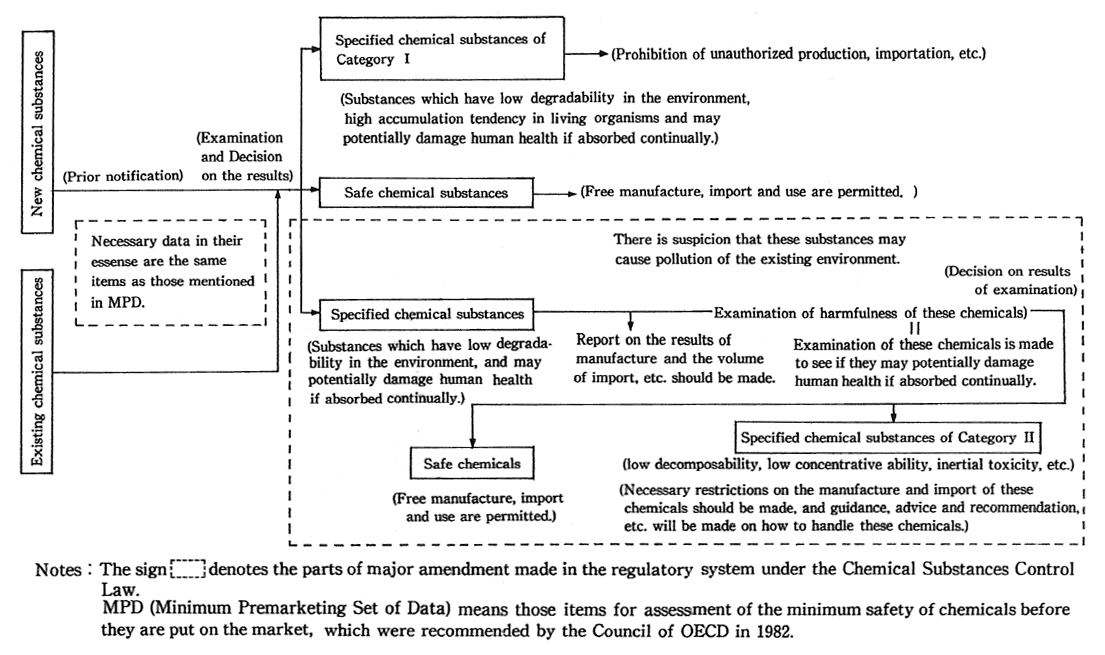
(1) The "Law Concerning the Examination and Regulation of Manu-facture, etc. of Chemical Substances" (hereinafter referred to as "Chem-ical Substances Control Law") was enacted in October 1973. The compe-tent government agencies continued to examine new chemicals before manufacture or importation, as to whether or not they are less decomposable, highly accumulative and chronically toxic (prior exami-nation of new chemical substances). Chemical substances having all of such properties (designated chemical substances) have been restricted for manufacture, importation and use. Moreover, the above-mentioned law was amended in May 1986 to specify the existing designated chemi-cal substances as "designated chemical substances of Category I" The amended law also specifies newly as "specified chemical substances those chemicals which are doubtful to be highly accumulative but less decomposable and chronically toxic, and monitor the manufacture and the volume of importation of such chemicals. It was further provided by this amendment that if such chemicals are suspected to have a possibil-ity to give damage to human health by causing environmental pollution, examination of their toxicity should be made and that if it is found, as a result of such examination, that these chemicals may have chronic toxicity to human health, they should be specified as "designated chemi-cal substances of Category II", and necessary regulations should be applied to the amount of the manufacture, importation, etc. of such chemicals.(Fig. 1-4)
Fig. 1-4 Regulatory System under the Chemical Substances Control Law
Reports on new chemicals have been made to the Ministry of Health and Welfare, and the Ministry of International Trade and Industry, the total number reported by the end of March, 1987 being 3,864. Of them, 3,132 have been publicized as not classified as the designated chemical substances of Category I and are permitted to be manufactured and imported. During fiscal 1988, the Ministries accepted 147 applications of new chemicals, of which 125 were judged neither to fall under the chemical substances of Category I nor under the designat-ed chemical substances, and 14 were classified as the designated chemi-cal substances. Moreover, in order to prove the safety of the existing chemicals, they are being checked for microbic decomposition and accumulation characteristics by the Ministry of International Trade and Industry (MITI), for chronic toxicity by the Ministry of Health and Welfare, and for distribution in the environment by the Environment Agency.
Based on the results of checking the existing chemicals, eight chemical substances-PCB, HCB, PCN, aldrin, dieldrin, endrin, DDT, etc. are specified as designated chemical substances of Category I, and 23 substances--trichloroethylene, tetrachloroethylene, trybuty1 stannate, etc.--as designated chemical substances. Out of these designated chemi-cal substances, three chemical substances including trichloroethylene were specified as designated chemical substances of Category II in April 1989 in consideration of their decomposability and chronic toxicity as well as the state of their environmental pollution.
On the other hand, in order to assure the reliability of test data and step up mutual acceptance of data among nations, the government adopted in March 1984 the principles of good laboratory practice (GLP) decided by the OECD Council. In 1988, Japan concluded GLP agree-ments, with the German Federal Republic (West Germany), Great Britain and the Netherlands (Holland) respectively, to promote mutual exchange of test data with these countries.
(2) To check the safety of the existing chemicals, MITI has been testing the decomposition and accumulation of chemicals. These tests have proved a total of 730 substances by the end of December 1988 as not to fall under the designated chemical substances of Category I. The Ministry is also promoting a number of projects including the develop-ment of new tent methods to facilitate the rapid and effective review of these existing chemicals.
The Ministry of Health and Welfare also tests chronic toxicity of existing chemicals to check the safety of them. Since fiscal 1988, the Environment Agency has also been proceeding with the development of and research on the toxicity test methods so that the efficiency of the test may be increased.
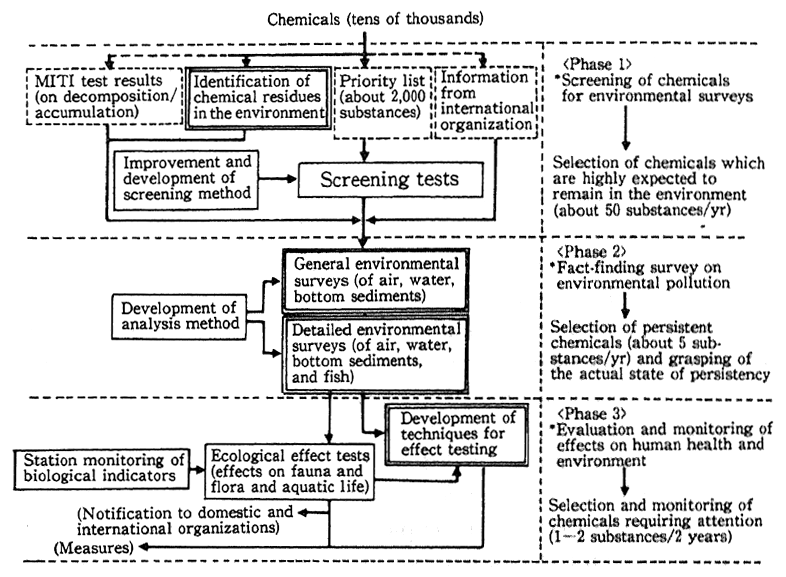
(3) Since 1974, the Environment Agency has surveyed the concentra-tion of chemicals in the environment. To examine tens of thousands of existing chemicals efficiently and systematically and to evaluate their safety in the environment, the Agency started in 1979 the overall check-up program for the environmental, safety of chemicals.
This system consists of three major steps of checking (Fig. 1-5) The first step screens chemicals which are highly expected to remain in the environment. In the second step, persistent chemicals are screened in an environmental survey on these substances, and another elaborate environmental survey is carried out. In the third step, chemicals of the kind which requires a surveillance are selected from persistent chemi-cals, and tests on ecological impact, GC/MS monitoring of water and sediments, and biological monitoring are conducted.
Fig. 1-5 Overall Checkup Program for Environmental Safety of Chemicals
In 1988, the Environmental Agency performed, under this overall checkup program, environmetal surveys on chemical substances, ecolog-ical impact tests, GC/MS monitoring of water and sediments biological monitoring, etc. Also, the Environment Agency proceeded with relevant investigation and research such as the correlation between structure and activity of chemical substances. At the same time, the Agency made examinations on how the general inspection and review to be commen-ced in fiscal 1989 should be to evaluate the safety of the secondary chemical substances for the environment.
Other than the above, the Agency has been continuing comprehen-sive examinations into the measures for chemical substances based upon middle and long-term viewpoints such as the development of the method to synthetically control chemical substances (the cross-media approach) and arrangement of data base.
(4) The government agencies concerned are also actively responding to the OECD's coordination work for the regulation of chemicals. To help ensure the safety of chemicals domestically, extensive research efforts are being made by these agencies. Among them are the project to introduce GLP adopted at the OECD Council into Japan, Japan's own evaluation of available test methods for ecological impacts, studies on comprehensive appraisal techniques for the safety of chemicals, and collection and analysis of information from domestic and overseas sources on the safety of chemicals.
(5) International trends on legislative measures for chemical sub-stances
To cope with environmental pollution arising from chemicals, Western countries have taken legislative measures that require the notification of new chemicals for the purpose of their safety appraisal prior to their production, import, or introduction to the market. The OECD, World Health Organization (WHO), United Nations Environ-ment Program (UNEP) and other international institutions take charge of various energetic activities to promote the measures to ensure the safety of chemicals, and Japan is positively contributing to them.
2. Results of Environmental Survey of Chemical Substances
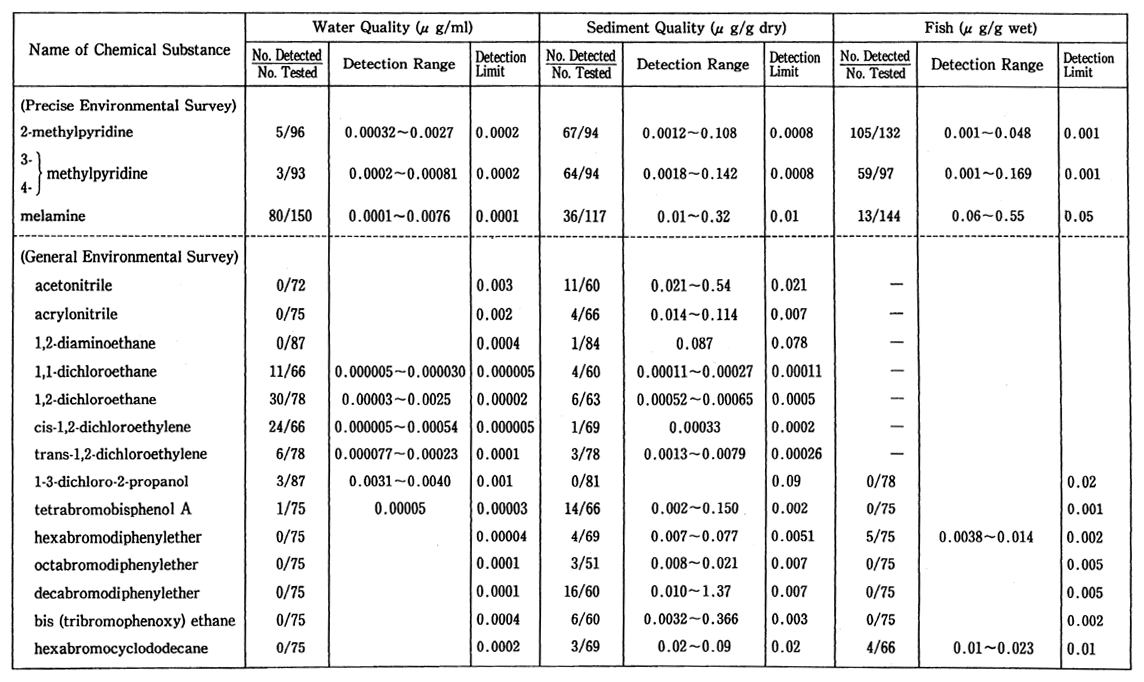
In 1987, the Environment Agency conducted a general environ-mental survey in 25 to 29 areas in Japan. In particular, the Agency performed quality evaluation tests for river and sea water and bottom sediments in order to observe the effects exerted on such environments by 27 chemical substances, the dissemination of which was supposed to be highly restricted. In respect to nine of the above substances, the Agency conducted fish toxicity tests in addition to the water and sediment quality tests. As a result, 14 of the above chemical substances were detected in either of the media (Ref: Table 1-13). From the residual state, the Agency judged that further investigation in detail (precise environmental survey) would be needed to be made in fiscal 1988 in connection with the six chemical substances (1,1-dichloroethane, 1,2-dichloroethane, tetrabromobisphenol A, hexabromodiphenylether, octa-bromodiphenylether and decabromodiphenylether).
Separately from the above, the Environment Agency carried out a precise environmental survey in about 50 areas in Japan with respect to three chemical substances that had been considered needing more detailed tests as the result of a general environmental survey conducted in the previous fiscal year. The precise environmental survey made of these three substances consisted of evaluation tests for water and bottom sediment qualities as well as for fish toxicity. The result of this survey revealed that the concentrations of the chemical substances detected in general environments were all below the level taken up as the problem for environmental pollution. Regarding melamine, the concentration detected in fish living in lakes and ponds was compara-tively high though it is generally supposed to be highly soluble in water and of a low concentration in living things. The Agency is going to continue its survey of the concentration of this substance in fish (Ref: Table 1-8).
Table 1-8 Results of Environmental Survey on Chemical Substances (Fiscal 1987)
3. Results of Environmental Monitoring on Chemical Substances
(1) Summary of GC/MS Monitoring of Water and Sediments
The monitoring of water and bottom sediment using gas chromatography and mass spectrometry (GC/MS) began in 1986 as a part of the environmental survey of chemical substances.
This survey utilizes the ability of GC/MS to an analyze many different chemicals simultaneously with high sensitivity. Chemical sub-stances which have accumulated in water and sediments as shown in environmental surveys are monitored in this program to determine the effects of longterm accumulation. The monitoring also detects unknown substances occurring in the environment.
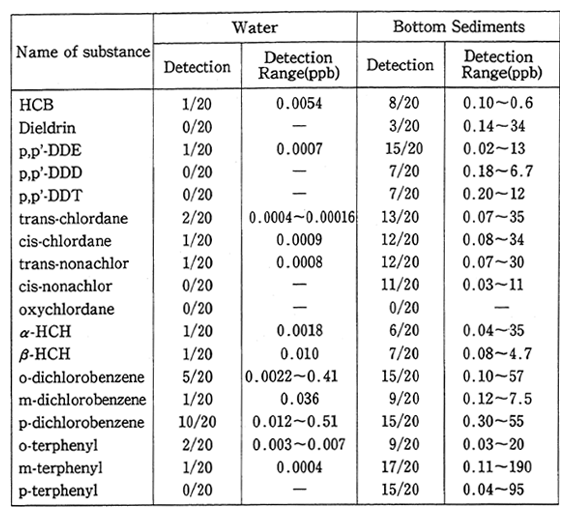
Eighteen substances were monitored in 20 areas all over Japan in fiscal 1987. 12 substances (p-dichlorobenzene) were detected in water and 17 substances (all but oxychlordane) in sediments (Table 1-9), The GC/MS monitoring of water and sediments indicates the changes in pollution level in each area over a long period of time. However, since the monitoring survey was started only in 1986 and the data collected so far is still insufficient, the Environment Agency has not yet made an evaluation of pollution levels in 1987.
Table 1-9 Findings of GC/MC Monitoring Survey of Water and Sediments (1987)
(2) Biological Monitoring Surveys-Environmental Pollution Surveys Using Biological Indices
In the biological monitoring surveys, year-round environmental pollution surveillance is carried out on living things, such as fish, shellfish and birds, in 17 areas across the nation focusing on the designated chemical substances of Category I under the Chemical Substances Control Law and also those which, according to the findings of detailed environmental surveys, were deemed necessary to carry out an elaborate check to assess the aggravation of environmental pollution by those substances.
In 1987, the residual concentration of a total of 25 chemical substances in the living things were surveyed. The maximum concentra-tion of chlordanes (five substances) detected in this survey were compa-rable to the values found in the previous year in both fish and shellfish. The maximum concentration of tributyl-tin compound was higher than that in the previous fiscal year but the frequency of the detection was less when compared with that in the previous fiscal year. Dieldrin was still detected in ten areas. Based on these survey results, it was conclud-ed that there was a need to continue prudent surveillance over the residue of those chemicals in the environment in the future.
4. Summary of Environmental Surveys of Unintentionally Produced Chemical Substances
These surveys were commenced in 1985 for the purpose of grasp-ing the actual state of environmental pollution by toxic chemical sub-stances such as dioxine, etc that are unintentionally produced in the artificial process such as the manufacture or incineration of some materials or in the natural reactions occuring in the environment. The surveys of fiscal 1985, 1986 and 1987, the results of which announced in fiscal 1988, were conducted in 17 to 28 areas in Japan as to sediments and living things (a water quality test was added in the 1986 survey) with dioxines as objective compounds for pollution. (What is meant by "dioxines" are "dioxine and polychlorodibenzofuran." Surveys made in 1985 and 1986 were related mainly to dioxine and that made in 1987, mainly to polychlorodibenzofuran.)
The results of these surveys are evaluated as such that (1) the pollution condition of general environment by dioxines observed is not considered serious enough to affect human health but (2) anyhow diox-ines were detected in ordinary environments though they were in a low concentration and therefore (3) it will be necessary to carefully follow up and watch the changes in the pollution level in the future.
Section7. Environmental Conservation Measures in Land Use
1. Rationalization of Land Utilization
The National Land Use Plan was established for the purpose of maintaining the stabilized and well balanced land use for a long period attaching primary importance to the public welfare as well as attain-ing the conservation of the natural environment. This plan is a guideline for the administration of national land use.
The National Land Use Plan (national plan) was revised in December 1985. In response to this revision, the National Land Use Plan for each prefecture (prefectural plan) is now being revised by the local governments (as of the end of 1988). On the formulation of the national land use plan at municipal level (municipal program), guidance has been given through the prefectures, and in regard to projects for the manage-ment and control of the national land use plan, the prefectures are subsidized in an attempt to establish a system of the national land use plan.
The basic land use plan is the one which is prepared by prefec-tural governor on the basis of the National Land Use Plan, encompass-ing the designation of five areas, namely urban area, agricultural area, forest area, natural parks area, and nature conservation area as well as regulation of land utilization and other matters. This program plays a comprehensive coordinating function as a program superior to various programs based on other specific laws including the City Planning Law and Natural Park Law. It also plays a role of regulatory standard directly for land transactions and indirectly for development projects through individual laws. By doing so, it adds to the promotion of proper and rational land utilization.
2. Rationalization of Industrial Siting
In order to fully resolve industrial pollution problems, it is neces-sary to realize proper industrial location. The Law Concerning the Restriction of Industry and Other Similar Functions in Existing Urban Areas of the National Capital Region and other related laws have been strictly observed to restrict the new location of factories in large cities.
In order to expedite the movement of factories from restricted areas to new industrial areas and promote the construction of new factories and the expansion of the existing ones in these new industrial areas in accordance with the Industrial Relocation Promotion Law, the systems for provision of subsidies to the expenditures for the promotion of industrial relocation were actively made use of, and the projects for the development of core industrial parks were promoted by the Public Corporation for the Promotion of Advancement and Improvement of Local Areas, and loans were provided by the Japan Development Bank.
In carrying out industrial relocation measures, guidance was given so that full consideration should be taken to prevent environmen-tal pollution by newly constructed plants. In regard to the utilization of the sites from which industrial plants have been removed, consideration has been given to contribute to an improvement of the urban environ-ment.
Section8. Public Relations and Environmental Education
1. Public Relations
(1) Genelal Information Activities
To make the people better aware of the environment, extensive information activities have been made on the importance of environmental conservation through such media as television, radio, newspapers, and magazines, distribution of the Environment Agency bulletin "Kankyo (Environment)," and lending of PR films produced by the agency. Also information has been given to mass media through press conferences and the circulation of related data.
(2) Observation of Environment Week
Japan holds Environment Week beginning on June 5, when World Environment Day is observed in commemoration of the 1972 United Nations Conference on the Human Environment in Stockholm. During the last Environment Week, a wide variety of events were carried out, including Environment Week gatherings featuring symposiums by women of learning and experience and exhibitions under the theme of the conservation of the environment. At the same time, local govern-ments were also called on to carry out various projects with a view to further enhancing the people's awareness on environmental problems. With the cooperation of local governments, 22,000 trees were planted at 159 welfare facilities in 43 prefectures in an attempt to diffuse the thought of afforestation.
(3) Establishment of Environmental Beautification Day
To spread and upgrade the ongoing local movements for environ-mental beautification into a nationwide campaign, the interested parties led by the Environment Agency and the Ministry of Health and Welfare called on local governments to set an "Environmental Beautification Day."
2. Promotion of Education on the Environment
(1) General Education on the Environment
In recent years, environmental pollution related to urban areas and livelihood and global-scale pollution problems have become bigger. Along with this trend, the need for easy contact with nature and for preservation and creation of a pleasant environment has also been expanding among the Japanese people.
In order to cope with such complicated and diversified environ-mental issues each individual must deepen his or her understanding and cognizance of the relation between man and the environment and to live and behave paying careful attention to the environment. The promotion of education on the environment has become more important.
A comprehensive and continuous approach is essential to widely spread and establish education on the environment. To realize this, there are several tasks such as the establishment of information supply networks, enrichment of information, establishment of centers and support of private enterprise activities.
The Environment Agency established a "Committee for Study of Livelihood and Environment" in order to examine the relation between everyday life and the environment, consideration and contrivance to the environment in everyday life.
In order to promote education on the environment in each dis-trict, the Environment Agency, since fiscal 1988, has been giving finan-cial aid to those prefectures and cities designated by the government ordinance where projects for promoting education on the environment have been put into effect, including the establishment of basic policies for local environmental education.
The Japan Environmental Association, a juridical foundation, implemented such events as TV broadcasting, production of film, and the holding of environmental education seminars in order to enhance the consciousness of the nation to take part in the settlement of environmen-tal problems. The Association also conducted wide activities relating to the spreading and development of knowledge on preservation of the environment by holding such symposiums as on the vision of environmental conservation and on the pleasant environment under joint sponsorship with the Environment Agency. In fiscal 1988, the Association newly held a symposium on education of the environment under co-sponsorship with the Environment Agency.
On the other hand, the Environmental investigation Center, a juridical foundation, granted "Awards for Good Environmental Protec-tion" to the enterprises which contributed t environmental causes as well as published its bulletins, "Environmental Studies".
In addition, the Clean Japan Center carries on extensive activities to spread the idea of waste recycling widely among the people at large and obtain their understanding and cooperation.
(2) School Education on Environmental Conservation
Because of its importance, education in environmental protection has been given in schools, primarily in such curricula as social studies and science.
The curriculum of social studies in junior high schools, for exam-ple, in designed for students to understand the need for environmental protection for the purpose of improving people's lives and promoting welfare. The curriculum of science aims to lead students to learn the importance of protecting the environment because development and exploitation of nature will change or destroy the balance of the nature.
Chapter2. Air Pollution, Noise, Vibration, and Offenslve Odors
Section1. Present State of Air Pollution
(1) Sulfur Dioxide
a. Changes in Annual Average Concentration
In 1987 sulfur dioxide (SO2) concentration in ambient air was recorded at 1,603 valid monitoring stations (stations at which monitor-ing was conducted for more than 6,000 hours a year) in 648 municipal-
Flg. 2-1 shows the changes in the annual average concentration of SO2 which has been measured at 15 air pollution monitoring stations since 1965, The level of SO2 has consistently decreased from the peak value of 0.059 ppm in 1967 to 0.010 ppm in 1986.
Fig 2-1 Changes in Annual Average Concentration of SO2 (Average of 15 air pollution monitoring stations)
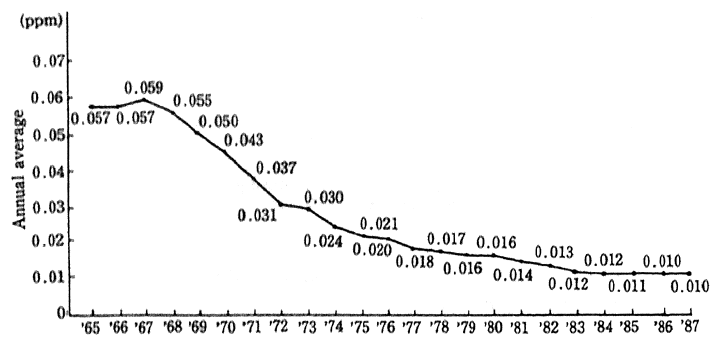
Note : Annual average in the quotient of the sum of all one-hour values per year divided by the total measured hours.
b. Trend and Current State of Compliance with Sulfur Dioxide Environmental Quality Standards
(a) Compliance with the Environmental Quality Standard Based on the Long-term Criteria
The long-term criteria of environmental quality standard (EQS) means the case when the daily average readings at certain air pollution monitoring station over a year, excluding 2% of days with the highest readings (e. g., in the case that data is available for 365 days, 7 days with the highest readings are excluded, then the 8th highest daily average reading is evaluated), shall not exceed 0.04 ppm and readings of any two consecutive days over the year shall not exceed 0.04 ppm.
Table 2-1 resents the state of compliance with EQS based on this long-term criteria for SO2.
Table 2-1 Compliance with Environmental Quality Standard for SO2 (based on long-term criteria) (Air pollution monitoring station)
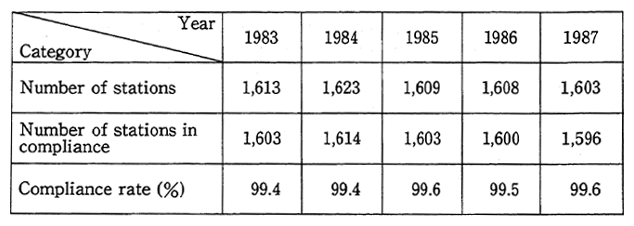
Note: Monitoring stations where the total monitoring hours did not exceed the effective measuring hours are excluded.
(b) Compliance with the Environmental Quality Standard Based on the Short-term Criteria
The number of monitoring stations at which the daily average readings on all effective monitoring days were 0.04 ppm or lower, was 98.8% of the number of effective monitoring stations in fiscal 1987. This rate in number of monitoring stations is equivalent to the level in fiscal 1986.
The number of monitoring stations at which the hourly readings on all monitoring times were 0.1 ppm or lower, was 94.9% of the number of effective monitoring stations in fiscal 1987, a slight decrease below the 95.6% of 1986.
(2) Nitrogen Dioxide
a. Changes is Annual Averages
(a) Air Pollution Monitoring Station
The data on nitrogen dioxide (NO2) concentration in ambient air in 1987 were collected at 1,324 valid monitoring stations in 604 munici-palities.
Fig. 2-2 indicates changes by year of the arithmetic averages of annual average figures for NO2 at 15 monitoring stations which have been in operation since 1970. The amount of NO2 detected was decreas-ing after 1979, yet has once again been on the increase since 1986. The NO2 detected in fiscal 1987 was 0.028 ppm, an increase over the 0.026 ppm in 1987.
Fig. 2-2 Changes in Annual Average Concentration of NO2
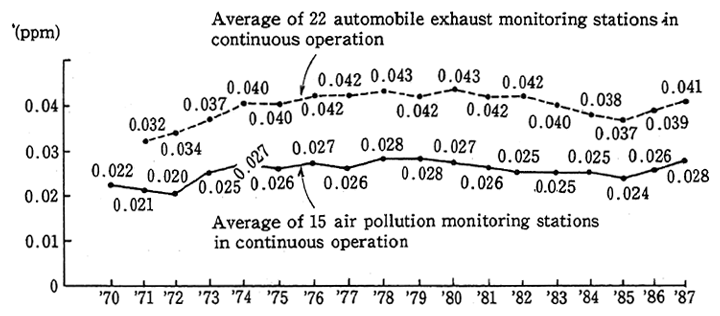
Note: Saltzman coefficient = 0.84 (same hereinafter)
(b) Automobile Exhaust Monitoring Station
The data on NO2 in 1987 were collected by 295 valid monitoring stations in 164 municipalities Annual changes in arithmetical average of annual averages at 22 automobile exhaust monitoring stations which have been in continuous operation since 1971. are shown in Fig. 2-2.
The 1987 value of NO2 was 0.041 ppm which is an increase above the 0.039 ppm of 1986.
b. Compliance with the Environmental Quality Standards
Environmental Quality Standards for NO2
The environmental quality standard for NO2 was revised in July 1978 by Notification No.38 of Environment Agency (called the Notifica-tion in this Subsection). It requested that "daily average of hourly values shall be no more than 0.04 ppm". It also requested that "if the daily average exceeds 0.06 ppm, efforts should be made to achieve the level of 0.06 ppm within 7 years" (Notification 2-1) and that "in an area where the daily average is between 0.04 ppm and 0.06 ppm, efforts should be made so that the ambient concentration is maintained around the present level or does not significantly exceed the present level" (Notifi-cation 2-2).
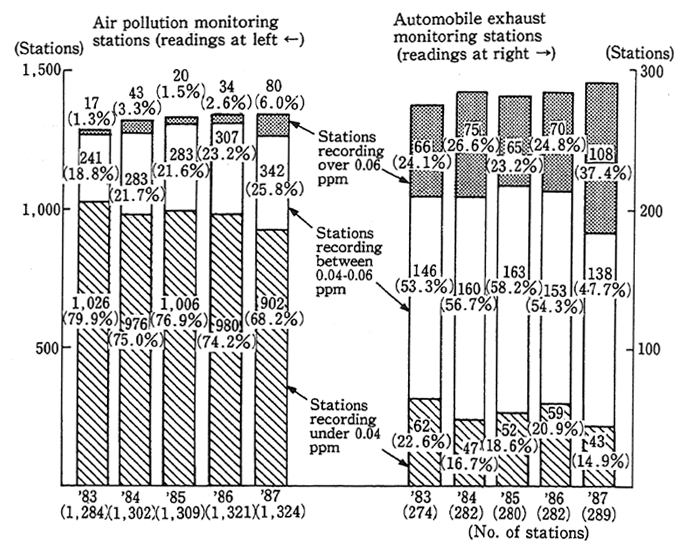
Of the readings recorded by 1,324 valid air pollution monitoring stations as well as 289 valid automobile exhaust monitoring stations (stations with sampling inlets placed at the outside of vehicle lanes) in 1987, the daily average values corresponding to 98% from the lowest (hereinafter referred to as "annual 98% value of daily average") are evaluated to represent the compliance status with EQS for NO2. (Fig. 2-3)
The number of air pollution monitoring stations recording the annual 98th percentile of daily averages exceeding 0.06 ppm, the upper limit of the EQS zone, decreased from year to year since 1978. Recently, it was stayed almost constant without significant annual fluctuation. In fiscal 1987, however, the figure was 6.0%, largely exceeding the 2.6% in 1986.
Annual 98% value of daily average exceeded 0.06 ppm at 108 automobile exhaust monitoring stations (37.4%), which were concen-trated in large metropolitan areas such as Tokyo, Osaka and Kanagawa prefectures.
Fig. 2-3 Compliance Rate with Environmental Quality Standards for NO2
Note: 1. The automobile exhaust monitoring stations do not include those where the sampling inlets are located in the driveway.
2. The figures in parentheses indicate the ratio of number of the given monitoring stations to number of all pollution monitoring stations.
3. The concentration level is annual 98% value of daily average.
c. Trends in Air Quality of Areas within a Zone Specified by the Environmental Quality Standard for Nitrogen Dioxide
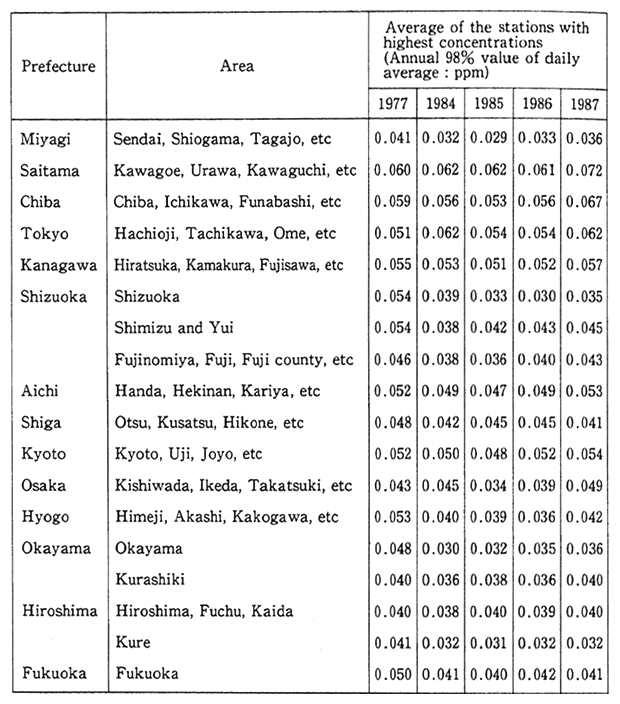
The trends of NO2 in areas with daily averages falling within the EQS zone (0.04-0.06 ppm) are shown in Table 2-2, which has been compiled from the data obtained in 1977 and 1984-1987 that are consid-ered to have been "maintained around the present level" according to Notification 2-2.
Table 2-2 Trends of NO2 Concentrations in Areas where Daily Averages are in a Range between 0.04 ppm and 0.06 ppm
(Air Pollution Monitoring Stations)
Note: Area with increased concentration: 4
Area with the same level of concentration :14
Area with increase of concentration by more than 0.006 ppm is classified as the area with increased concentration.
d. Nitrogen Monoxide
(a) Air Pollution Monitoring Stations
Data on nitrogen monoxide (NO) concentration in 1987 were obtained at 1,323 valid monitoring stations in 604 municipalities.
Fig. 2-4 shows the annual changes in the arithmetic mean of the annual averages recorded at 29 stations which have been operating continuously since 1971. Although there has been a slight decreasing tendency since 1971, the concentrations have increased from 1986 to 1987.
Fig. 2-4 Changes in Annual Average Concetration of NO
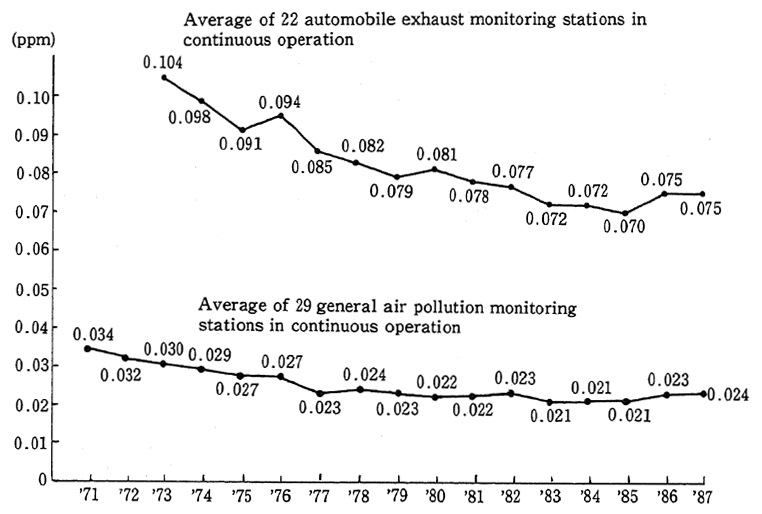
Note: Oxidization rate 70% (Same hereinafter)
(b) Automobile Exhaust Monitoring Stations
Data on NO concentration in 1987 were collected at 295 monitor-ing stations in 164 municipalities.
Annual changes in arithmetical average of the annual average at 22 monitoring stations (the same as in the monitoring of NO2 are given in Fig. 2-4. The value in 1987 was 0.075 ppm, the same as that in 1986.
(3) Carbon Monoxide
a. Automobile Exhaust Monitoring Station
Automobiles are the main sources of carbon monoxide (CO) air pollution. Consequently, to understand the state of pollution, monitoring must be undertaken at points near heavily used roadway and crossings.
Measurement on CO level for 1987 was obtained at 304 valid monitoring stations in 178 municipalities.
(a) Trend of Annual Average Concentration
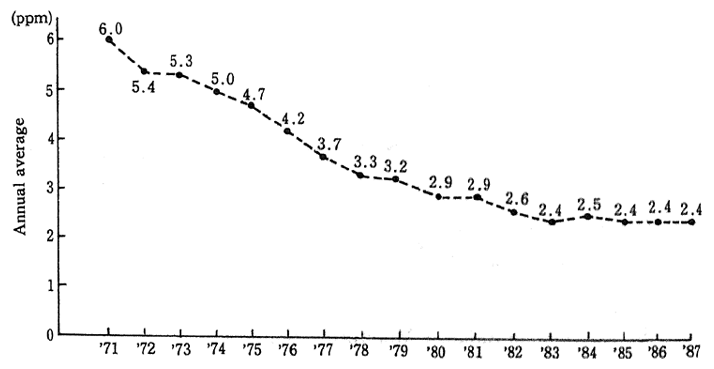
The annual average concentrations of CO at 15 monitoring sta-tions which have been measuring since 1971 are, as shown in Fig. 2-5. There were signs of a drop but in the last several years, it has been leveled off to the new value, 2.4 ppm, in 1987.
Fig. 2-5 Changes in Annual Average Concentration of CO(Average of 15 automobile exhaust monitoring stations in continuous operation)
(b) Compliance with Environmental Quality Standards
The environmental quality standards (EQS) have been satisfied at all long-term 297 automobile exhaust gas monitoring stations as well as the valid monitoring stations (with sampling inlets located outside of the automobile lanes). With respect to the short-term evaluation, exhaust gas monitored satisfied EQS based on daily average figures at all monitoring stations except one station. At all monitoring stations, exhaust gas monitored cleared EQS in terms of 8-hour values.
b. Air Pollution Monitoring Station
In 1987, concentration of CO was measured for over the effective operational period by 187 valid monitoring stations in 161 municipal-ities. All records met EQS for CO in term of an eight-hour value, as well as for the daily average value.
(4) Photocheimical Oxidants
In 1987, 1,025 monitoring stations in 539 municipalities took records for photochemical oxidants.
The concentration of oxidants are heavily influenced by meteoro-logical conditions. It increased in 1988 as compared with 1987 level.
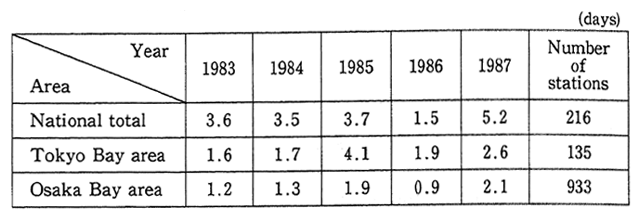
Based on the records collected at 956 air pollution monitoring stations being operated continuously since 1982, Table 2-3 indicates the average number of days per year when the hourly oxidant concentra-tion level exceeded 0.12 ppm, the concentration threshold for issuing an oxidant warning.
(5) Non-methane Hydrocarbons
In August 1976, the Central Council for Environmental Pollution Control provide guidelines for "ambient hydrocarbon levels for prevent-ing formation of photochemical oxidants", which provided that non-methane hydrocarbons shall be measured instead of all hydrocarbons. It was determined that the conventional standard for photochemical oxidants, 0.06 ppm hourly, corresponds to a range 0.20 to 0.31 ppmC of the concentration of non-methane hydrocarbons averaged for three hours from 6:00 a.m. to 9:00 a.m.
Table 2-3 Annual Changes in Average Number of Days of Oxidant Concentrations Exceeding the Concentration Threshold for Issuing Oxidant Warnings
(Air pollution monitoring stations)
Notes: 1. "Tokyo Bay area" includes Tokyo, Kanagawa, Chiba, Saitama, Ibaragi, Tochigi and Gunma prefectures.
2. "Osaka Bay area" includes Kyoto, Osaka, Hyogo and Nara prefectures.
3. The figures were obtained by dividing the total of days recording the concentrations over 0.12 ppm by the number of monitoring stations.
a. Air Pollution Monitoring Station
In 1987, concentration of non-methane hydrocarbons was measur-ed at 332 air pollution monitoring stations in 230 municipalities. Table 2-4 shows the distribution of annual average of 6:00-9:00 average concen-tration between 6:00 a.m. and 9:00 a.m.
Table 2-4 Distribution of Annual Average of Non-methane Hydrocarbon (6:00-9:00 Average Concentrations)

(Air pollution monitoring stations,)
b. Automobile Exhaust Monitoring Station
Data on non-methane hydrocarbon concentration in 1987 were collected at 146 stations in 94 municipalities.
Annual changes in arithmetical average of the annual average measured at 12 stations which have been operated since 1977 are shown in Table 2-5.
Table 2-5 Changes in Annual Average Concentration of Non-methane Hydrocarbon (Average of 12 automobile exhaust monitoring stations)

(6) Suspended Particulate Matter
Data on concentration of suspended particulate matter in 1987 were obtained at 958 valid monitoring stations in 460 municipalities.
Although the rate of clearing EQS based on the long-term criteria has stayed at about the similar level in recent years, the rate of 56.8% in 1986 decreased to 52.6% in 1987. (Figure 2-6).
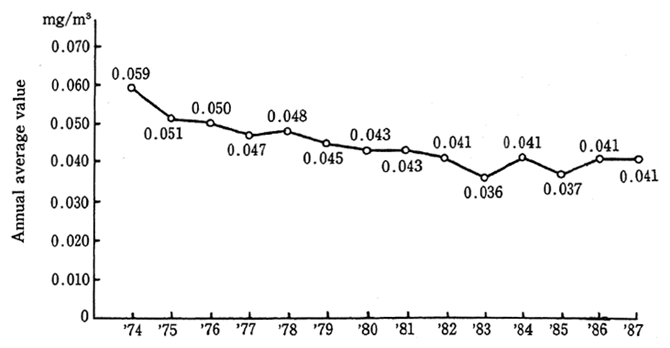
Annual changes in arithmetical average of the annual average at 40 stations which have been operated since 1974 are shown in Fig. 2-7.
The general decreasing tendency has leveled off in recent years.
(7) Dust Fall
Dust fall in the air is defined as particulate matter which settles to the ground either by gravity or by rain.
Data on dust fall at 1,378 monitoring locations where monitoring was made for longer than the valid operational hours, out of 1,449 monitoring spots in 1987, shows that dust fall between 20 tons/km2/ month and 30 tons/km2/month was recorded at three locations (three locations in 1986) and 7 locations recorded more than 30 tons/km2/ month (24 locations in 1986).
Fig. 2-6 State of Compliance with Environmental Air Quality Standards for Suspended Particulate Matter (Based on long-term criteria) (Air pollution monitoring stations)
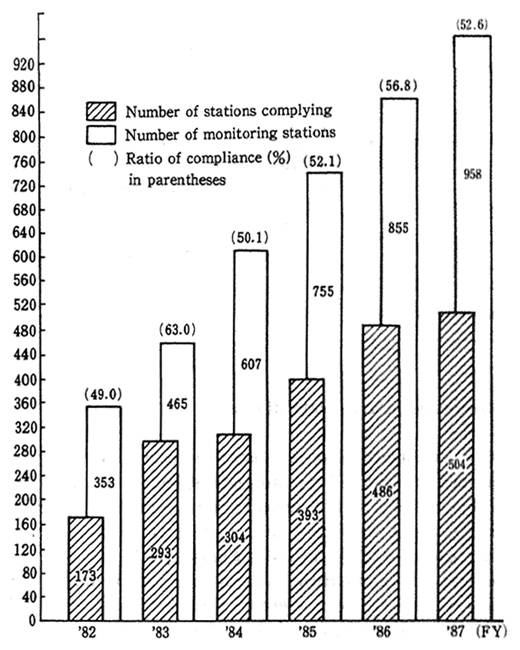
Fig. 2-7 Annual changes in Arithmetical Average of the Annual Average Value of Suspended Particulates measured continually at 40 monitoring stations
(Air pollution monitoring stations)
(8) Other Substances
In addition to quantitative measurements, recently attention has been paid to the qualitative nature including the chemical compositions of particulate matters. At national air pollution monitoring stations located in key areas throughout the country, besides the continuous monitoring of the substances mentioned above, the components in the suspended dust collected by high-volume air samplers (benzene solubles, sulfates, nitrates, heavy metals such as vanadium, benzo (a) pyrene, etc.) and those of the suspended particulate matter collected by low-volume air samplers (31 elements including aluminum and barium) are monitor-ed. Monitoring of mercury was started in 1982.
Continual biannual monitoring of asbestos, formaldehyde, and dioxins has been phased in from 1986. According to the results obtained so far, the levels are not liable to cause imminent problems (Table 2-6).
Table 2-6 Results of the Monitoring of Uncontrolled Pollutant in Air
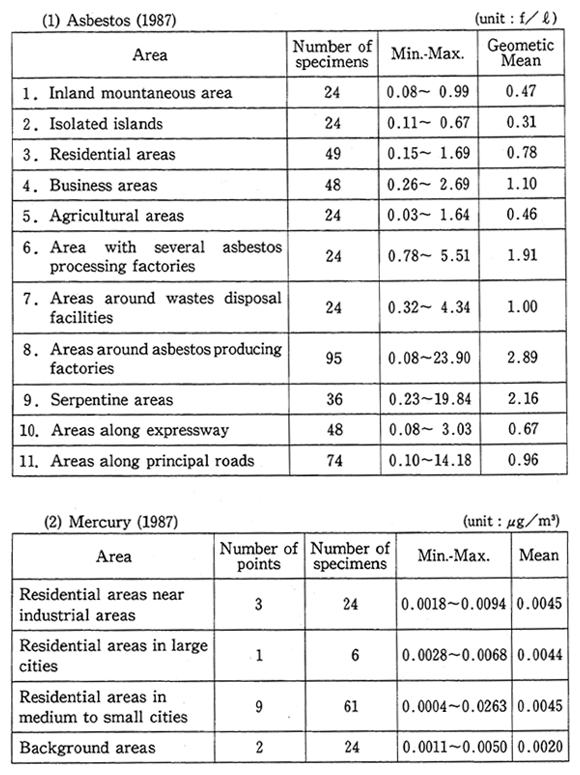
Remarks: 1. The above figures have been investigated by the Environment Agency.
2. "f/ l" implies the number of asbestos fibers contained in one liter of air.
(9) Measurements at National Environmental Background Air Monitoring Stations
National environmental background air monitoring stations have been situated near the periphery of major plains throughout the country and constantly monitor environmental air quality. The measurements obtained there provide data for estimating background levels of pollut-ants in unpolluted areas (Table 2-7).
Table 2-7 Data Obtained at National Environmental Background Air Monitoring Stations in 1987 (Annual average)
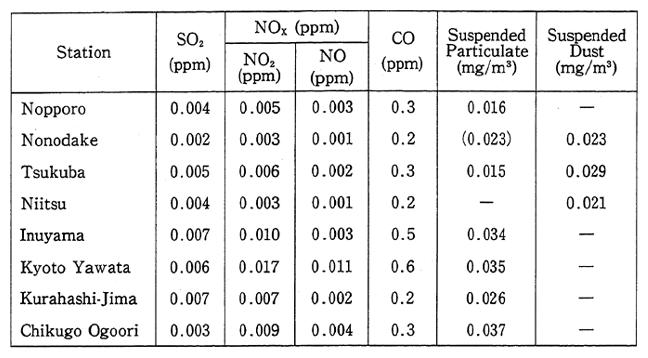
Notes: 1. The figure in bracket is the annual average of the densities of suspended particulate matter, the total measuring hours of which did not exceed 6,000 hours.
2. See Fig. 2-5 for locations of monitoring stations.
Especially, the values observed at monitoring stations located in the remote areas may be considered to show levels very close to the background levels.
Section2. Countermeasures for Air Pollution
1. Sulfur Oxides
(1) Emission Control
As regard regulation on sulfur oxides emission, the emission standards specified for each facility and the areawide total pollutant load control standards for each factory located in highly polluted areas are in force. The former is called "K-value regulation," and the emission levels are determined according to the "K" constant (in 16 ranks ranging from 3.0 to 17.5 ; the smaller the K-value, the stricter the restriction). Since December 1968, the K-values have been revised and made more stringent eight times. In respect of the latter, the areas in which factories and other business establishments are concentrated and it is deemed difficult to maintain EQS only with emission control over individual facilities are designated by the State as the areawide total pollutant load control regions. Regulations are imposed under areawide total pollutant load control plans formulated by the prefectural governors. At present, 24 areas are designated as such. The list of emission control items was expanded to cover small boilers in June 1985 and gas turbines and diesel engines in October 1987. Regulations on newly installed facilities were made effective in February 1988.
In addition, fuel use standards are determined for soot and smoke emitting facilities in areas where seasonal heavy pollution is caused by heating equipment and other medium-and small-emission sources as well as for small-scale factories and other business establishments which are located in the areawide total pollutant load control areas but are not subject to the areawide total pollutant load control regulation.
(2) Sulfur Oxides Emission Source Control
The measures for SOX emission control include (a)importation of low sulfur content fuel, (b)desulfurization of heavy oil and (c)flue gas desulfurization.
(a) Ever since 1967, both direct and indirect desulfurization plants have been built to reduce the sulfur content of heavy oil. As of the end of March 1987, 13 direct desulfurization units (capacity: 71 thousand kl/ day) and 30 indirect desulfurization units (capacity: 143 thousand kl/ day) were processing heavy oil.
As an outcome of the assorted measures for the import of low sulfur crude oil and heavy oil desulfurization, the average sulfur content of heavy oil for domestic consumption dropped to 1.09% in 1987.
(b) Research and development efforts have been made on flue gas desulfurization as one of the large-scale industrial technology develop-ment projects by the Ministry of International Trade and Industry since 1966. Practical desulfurization plants were put in operation in 1970. The number and capacities of desulfurization plants have steadily increased (Fig. 2-8).
Fig. 2-8 Changes in the Number and Total Capacities of Flue Gas Desulfurization Units
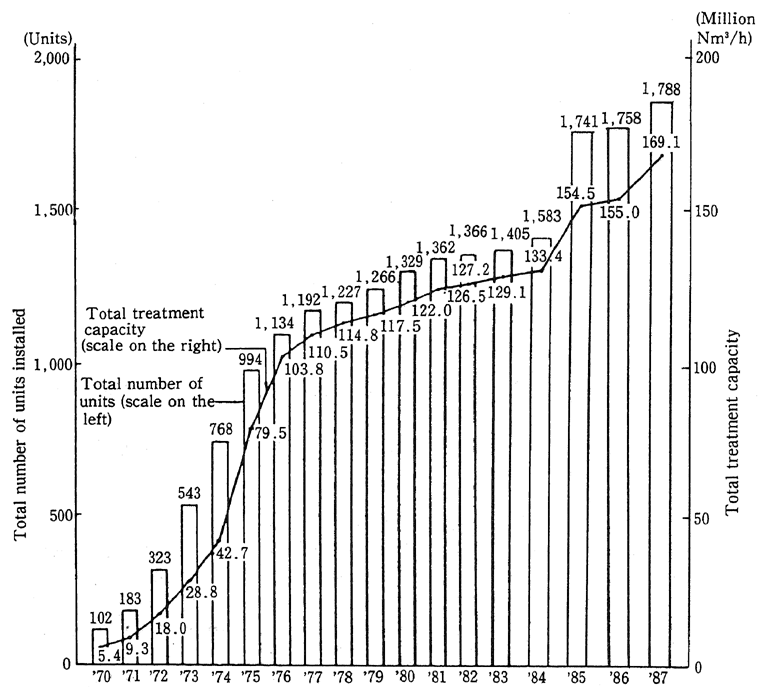
Note: Figures are as of January 1 for each year until 1982, and the ones after 1983 are as of March 31 of each year.
Due to the above various measures, the condition of air pollution by sulfur dioxide has been improved remarkably as compared with the condition in the 1965-69 period however, there still remain some areas where environmental quality standards have not been cleared as yet. As for each of these areas, examinations are being made by applying the existing measures to see if they are effective as well as to find the reason why these places have not achieved the environmental criteria.
2. Nitrogen Oxides
(1) Measures for Stationary Sources
a. Nationwide Emission Control
National emission standards for NOX from stationary sources were established in August 1973 and since then they have been strength-ened and the types of facilities to be subject to the regulation have been increased four times. In September 1983, the emission standards for solid fuel combustion boilers were strengthened and other measures taken in order to cope with changes in energy situation, such as a shift to coal and other solid fuels which feature high generation rates of NOX. The list of emission control items was expanded to cover small boilers in June 1985, and gas turbines and diesel engines in October 1987. Regulations on newly installed facilities were made effective in Febru-ary 1988.
b. Implementation of Areawide Total Pollutant Load Control
(a) Introduction of Areawide Total Pollutant Load Control System
When factories and other business establishments are so concen-trated in a region that it is deemed to be difficult to attain EQS solely with the emission control for individual soot and smoke emitting facil-ities, the areawide total pollutant load control on NOX was introduced by the revision of the Cabinet Order for Implementation of Air Pollution Control Law in June 1981. Tokyo (23 wards), Yokohama and Osaka were designated as areas for areawide total pollutant load control where necessary measures should be taken to reduce and achieve EQS for NOX.
As regards Nagoya which suspended the adoption of areawide total pollutant load control and Kita-Kyushu and Kobe which were under consideration of adopting areawide total pollutant load control, each local government carried out measures for NOX by its own operat-ing procedure.
(b) Implementation of Areawide Total Pollutant Load Control
In three areas which were designated as areawide total pollutant load control areas In June 1981, regulation has been in force since 1982. At the end of March 1985, the areawide total pollutant load control standards were applied to existing factories and other business estab-lishments.
C. Status of Nitrogen Oxides Reduction Technology
Surveys have been continued since 1975 on the development of techniques for the reduction of NOX generated at stationary sources, which include flue gas denitrification and low-NOX combustion.
Recently, Low-NOX combustion technology is making remarkable progress producing considerable effects of reducing the emission of NOX by the application of two-stage combustion method, low-NOX burners, etc.
Number and capacities of flue gas denitrification units have been steadily increasing as shown in Fig. 2-9. The majority of these units employ the dry selective catalytic reduction process, while there are other processes, such as non-catalytic reduction process, wet-type direct absorption and wet-type oxidation absorption. Practical denitrification units for clean or semi-dirty gas have been operating satisfactorily. The reliability of techniques for dirty exhaust, such as those of exhaust from coal combustion, is also improved as demonstrated by successful opera-tion of the high-dust denitrification as well as the low-dust denitrifica-tion combined with conventional dust collector. Thus, it is now possible to choose an appropriate method for a particular facility according to the type of coal combusted, feature of the dust collector, cost perfor-mance and conditions of the site.
(2) Measures Against Automobile Exhaust and Other Projects
The restriction on nitrogen oxides emitted from automobiles has been strengthened incrementally. The emission, however, must be fur-ther reduced in large cities and other areas having heavy automobile traffic. Traffic control, improvement of road structure, and other measures should be further promoted to achieve this, in addition to the source control of individual automobiles (see Section 4 for detailed discussion).
Fig. 2-9 Annual Trend and State of Establishment of Flue Gas Denitrification Units
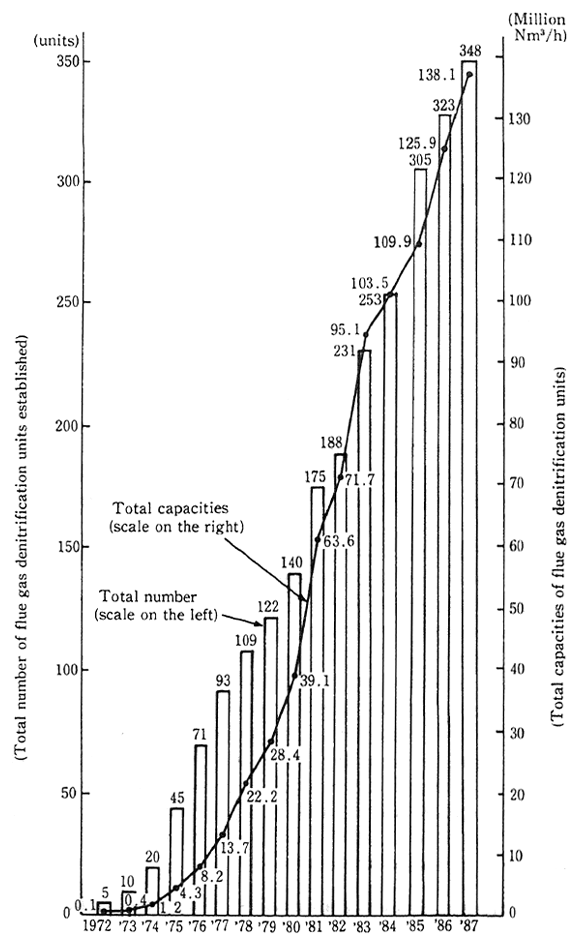
Notes: 1. Figures for and after 1984 are based on the projects performed for preparation of the data reported about the facilities that emit flue gas.
2. Figures are as of January 1 and each year until 1982, and the ones after 1983 are as of March 31 of each year.
A number of other projects have been introduced as a new approach to controlling air pollution consisting of nitrogen oxides and other pollutants. The Pollution-Related Health Damage Compensation Law was amended to establish a new fund in the Pollution-Related Health Damage Compensation and Prevention Association (Chapter 5). The fund will finance projects contributing to the improvement of the local air environment. These will include the popularization of electric automobiles and other low-pollution vehicles promoted by local author-ities, acceleration of the shift to automobiles emitting less exhaust and complying with the newest regulations, increased planting of trees and vegetation that can purify the air, and other projects.
(3) Promotion of Measures Against Nitrogen Oxides in Large Cities
In December 1985, the Environment Agency published the "Middle-Term Outlook on Measures for Nitrogen Oxides in Large Cities" (hereinafter called simply the "Middle-Term Outlook"). In this publication, the Agency clarified the cause for the inability of achieving the environmental criteria related to nitrogen dioxides in large cities as well as forecast the future changes in the environment from the view-point of middle-term forecast. Based upon such ideas, the Agency orientated its policy and has promoted systematic and comprehensive measures. Notwithstanding such efforts, the state of pollution remained still serious mainly in the three areas in which the restriction on the total amount of nitrogen oxides has been applied.
Since it is for fiscal 1988 that the Agency made forecasts in the report on pollution conditions as well as in its middle-term outlook, the Agency will continue also in and after 1989 to actively proceed with the same systematic and comprehensive approach based upon the future forecast. From this intention, the Agency issued in December 1988, the "New Middle-Term Outlook on Measures for Nitrogen Oxides in Large Cities" (hereinafter called simply the "New Middle-Term Outlook") forecasting to fiscal 1993.
According to the New Middle-Term Outlook, the air pollution by nitrogen dioxide in three areas for which total amount restriction is to be applied is expected to be further improved as the result of intensified measures taken up to now, at the general air pollution monitoring stations. The same outlook, however, forecasts the anxiety that, the achievement of the environmental quality standards at the automobile exhaust monitoring stations, would be difficult in general except for some monitoring stations and therefore the measures set up so far would still be insufficient to resolve this problem.
In spite of the above, it is supposed that if the measure to reduce the exhaust of nitrogen oxides should be promoted more strongly during the period of the New Middle-Term Outlook the pollution problem would possibly be improved further.
For the above purpose, it is of course necessary to first intensify the restrictions on automobile exhaust gas as well as to draw up and promote other measures already set up along with the direction of various measures set forth in the New Middle-Term Outlook. It will also be necessary to examine such matters as the feasibility of establish-ing the restriction of automobile exhaust gas by total amount as well as to investigate the problems to be caused by actually restricting the driving of cars into the center of Tokyo. In short, it is essential to examine such measures as are drawn from entirely new ideas and gradually put them into practice.
As an enforcement measure to be taken for the time being ,the Environment Agency prepared in August 1988 the "Seasonal Anti-Air-Pollution Measures" in which the proper adjustment of air-conditioning temperatures and the restriction of cars to go in and out of garages, in order to cope with the problem of air pollution which is extremely conspicuous in winter. In addition to the above, the Agency designated the month of December 1989 as the "Air Pollution Prevention Month" and conducted an advertisement and promotion campaign for the general public in Japan in order to enhance the prevention of air pollution.
3. Measures for Suspended Particulate Matter
Particulate matter in ambient air is divided into two classes; dust fall and suspended particulate matter. Furthermore, suspended particu-lates fall into two categories; the suspended particulate matter whose size is less than 10 fハm in diameter for which EQS is established and the other suspended particulates. The sources of particulate matter is found in various areas including places of industrial activities, such as fac-tories or other business establishments, as well as motor vehicle traffic and natural phenomena such as soil whirled-up by the wind. Particulate matter emitted from industrial activities in factories or other business establishments is restricted under the Air Pollution Control Law. The particulate matter is classified into two categories under the law; one is "soot and dust" generated as a result of combustion of fuel and the like or of the use of electricity as a heat source, the other is "particulates" any substances discharged or scattered as a result of mechanical treat-ments such as crushing and classifying or piling of materials. The law regulates those generated by running motor vehicles as "particulate matter (diesel smoke)."
(1) Measures for Suspended Particulate Matter
The environmental standards for suspended particulate matter were established in January 1972. The rate of achievement of these standards is low though it has been more or less improved, and therefore it is an urgent task to establish the measures to improve it. For this reason, the Environment Agency has been carrying out a comprehensive investigation and analysis of suspended particulate matter. Up to the present, the Agency has conducted investigations on the source of soot and dust generation, the generation of secondarily produced particles (particles that are grown as the result of gassy materials such as sulfur oxides, etc. being affected physically and chemically in the atmosphere) as well as the general analysis of the concentration of suspended particulate matter in the environment. In December 1986, the procedures for analysis and estimation of the pollution state of suspended particu-late matter were Completed. In order to further improve the preciseness of the analysis and estimation, the Agency has been conducting an analytical survey of the pollution by suspended particulate matter in model areas since fiscal 1986.
(2) Countermeasures for Soot and Dust
Emission standards for soot and dust are specified for each type and scale of dust emitting facilities, and more stringent standards are stipulated for newly installed and expanded facilities in areas where facilities are clustered and are suffering from severe air pollution. These emission standards were strengthened in May 1982 to cope with changes in the energy situation, such as the growing use of coal, and significant advances in technology to prevent the emission of soot and dust.
The list of emission control items was expanded to cover small boilers in June 1985 and gas turbines and diesel engines in October 1987. The regulation on newly installed facilities become effective in Febru-ary 1988.
In connection with dust, standards were established in 1971, for the structure, handling method and control of the dust generating facilities such as the dust storing places and conveyors.
(3) Countermeasures for Dusts Generated by Studded Tires
Number of vehicles running with studded tires on in winter has increased in snowy regions. In addition to the damages to road surfaces, dust generated by studded tires is raising serious environmental prob-lems. The Environment Agency has conducted surveys on the environ-mental impact of dust generated by use of studded tires since 1982, and has been monitoring the use of vehicles with studless tires since 1986.
Governors of related prefectures were requested by the Environ-ment Agency in September 1983 to take tentative measures for maintaining living environment in the regions with an emphasis placed on the use of studded tire in a limited period (instructions for spontane-ous restraint). In response to this call, the National Police Agency and the Ministry of Transport called on related institutions in cooperating in the restrained use of studded tires. In November 1984, the Ministry of Construction notified related road authorities of the immediate mea-sures, including the rational use of studded tires, from a viewpoint of preventing damage to roads. The Ministry of International Trade and Industry has been instructing tire makers to promote studless tires. The number of studded tires sold in 1988 decreased from that in 1987 by 15% as the result of these efforts. At present, in 14 prefectures including Hokkaido, concrete measures, such as the formulation of an operating procedure including restrictions on the period in which studded tires could be used, are being taken, and measures have also been under study in other prefectures.
In Miyagi Prefecture, the Ordinance on Studded Tire Counter-measures which incorporated restrictions on the use of studded tires has been in force since April 1986 and similar ordinance has been in force in Sapporo City since April 1987. Thus, further countermeasures appropri-ate to each district will be taken.
In August 1985, the Japan Automobile Tire Manufacturers Asso-ciation, acting under the guidance of related ministries and agencies, published new standards for studded tires which were designed to reduce 30% or so the generation of dust from that of the studded tires which satisfy the existing first standards, and, the tire makers started the production of studded tires complying with the new standards for buses and trucks in May 1986 and for passenger cars in May 1987.
Since fiscal 1983, the Environment Agency has carried out animal tests on the effect of dust from studded tires on human beings. The results have revealed that there were sediments of foreign substances in lungs and lymph nodes, and fibers were formed in the lungs of some animals. For this reason, the Agency announced the report of the result in August 1988, stating that it is necessary to further continue efforts to control the generation of dust in the future. On the basis of the results of various investigations on how to standardize the structure of studded tires, the Ministry of Transport set up a standard for studded tires in June 1988, and sent notices to those concerned.
A meeting of the Environment Disputes Coordination Committee was held in June 1988. In this meeting, seven leading tire manufacturers in Japan agreed to discontinue the manufacture of studded tires as of the end of December 1990, and also that their sale of such tires should be stopped as of the end of March 1991. In future, it will be necessary to further promote various measures such as the advertisement and spread of studless tires in order to realize the above agreement.
4. Photochemical Air Pollution
There still are situations where the concentration of photochemi-cal oxidants exceeds EQS almost in every district of the nation and there often are cases in which a warning has to be issued, depending on the meteorological conditions. So, there is a need to accurately grasp the conditions of pollution and take appropriate countermeasures.
(1) Present State of Photochemical Air Pollution
a. Warnings and Alarms
In 1988, warnings for photochemical oxidants were issued in 16 prefectures and on 86 days in total (this warning is issued when the one-hour average of photochemical oxidant concentration is 0.12 ppm or higher and that the pollution state is considered to continue further in view of the weather condition at the time). This frequency and range of warning issuance decreased to about half of that in 1987. The reason for the decrease is that in 1987 it rained very little in the rainy season while in the summer of 1988, the rainy season finished later than usual and the weather in Pacific areas that summer had a lower mean temperature with more rain. The number of days on which the warning was issued in 1988 was almost the same as that in 1986 (Ref: Table 2-8)
Table 2-8 Number of Days with Warnings Issued and Reported Victims (1984-1988)

Fig. 2-10 Changes in Total Number of Days Photochemical Oxidant warnings Issued and in Number of Reported Sufferers
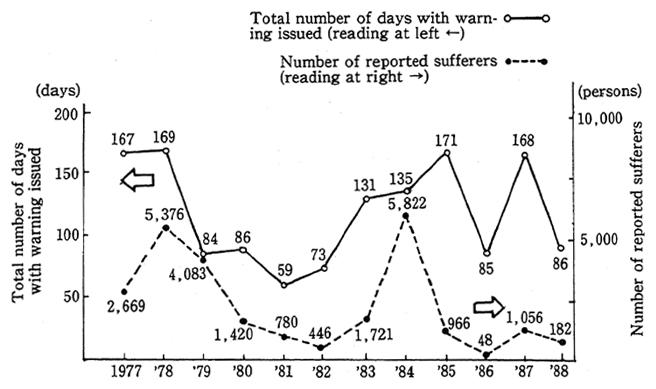
The monthly breakdown of the total number of days with warn-ings was: 3 days in April, 16 days in May, 27 days in June, 16 days in July, 22 days in August, and 2 days in September. The frequency in June was remarkable.
The highest concentration of photochemical oxidants on the days when a warning was issued in 1988 was 0.235 ppm, and a photochemical oxidants alarm (which is issued when the hourly values of photochemi-cal oxidants concentration exceed 0.24 ppm and the condition is likely to continue from a meteorological point of view, although different criteria are applied by prefectures) was not issued (Fig. 2-10).
b. Regions Where Warnings Issued
Total number of days when a warning was issued was 45 in the Tokyo Bay region comprising Ibaraki, Tochigi, Gunma, Tokyo, Chiba, Saitama and Kanagawa prefectures, and 14 in the Osaka Bay region comprising Osaka, Kyoto, Nara and Hyogo prefectures, or accounted about 70% of national total by these two regions.
c. Number of Sufferers
The number of reported sufferers who were suspected of having suffered from photochemical air pollution (reported on a voluntary basis by subjective symptoms) in 1988 was 132, which was a considerable from the year before and compared to the value in 1986.
(2) Emergency Measures against Photochemical Air Pollution
To obtain meteorological data necessary for the judgement of issuing emergency reports (warnings and alarms), the Environment Agency has been conducting weather observations every summer in 4 locations of two regions, Tokyo Bay and Osaka Bay where the photo-chemical air pollution is likely to take place in summer. The meteoro-logical information obtained is sent to local governments. The Meteoro-logical Agency has been conducting at its 19 metorological centers the analysis and forecast of those weather conditions that are apt to create photochemical air pollution,and reporting information based thereon to local public entities. The local governments issue warnings or alarms based on this information together with data from monitoring stations in accordance with their own guidelines for emergency measures against photochemical oxidants. They also request voluntary efforts to reduce the emission of air pollutants from soot and smoke emitting facilities and voluntary restraint of unnecessary or not urgently needed use of cars, and conduct public relations activities and health care for residents.
(3) Hydrocarbons Emission Control
a. Emission Control on Stationary Sources
The Environment Agency decided in July 1982 on the Promotion of Measures against Hydrocarbon (HC) for the Prevention of Photochemical Air Pollution in order to tighten and promote control measures on HC emission from stationary sources based on the findings of the actual emission situation and assessment of emission control technology by a study group on measures against HC from stationary sources. In accordance with this policy, the Environment Agency called on local governments and other related institutions to promote counter-measures for HC in July 1982 and to update data on emission sources in March 1983. In 1988, the Agency also worked for a further promotion of the updating of data on emission sources by local governments.
b. Measures to Reduce Hydrocarbons Emission from Automobiles
In regard to HC emitted from automobiles, regulation was start-ed in 1970, and the quantity of HC emitted per vehicle for gasoline and LPG-fueled vehicles reduced by 92% due to the 1975 regulation from the years in which the regulation had not been in force.
(4) Promotion of Research on Photochemical Air Pollution
Photochemical air pollution is a very complicated and extensive phenomenon and surveys there of cover a wide range of fields including mechanisms of photochemical reactions, meteorological effects such as transport and diffusion emission of causal, pollutants, prediction models for photochemical air pollution incorporating these factors as well as effects of photochemical oxidants on vegetation.
Efforts are being made to upgrade the precision of prediction model of photochemical air pollution. On the basis of such achieve-ments, operational tests of an areawide prediction model for photochem-ical air pollution in Tokyo Bay area (Tokyo and six prefectures) were made from June to August in 1988, due to the efforts in 1987, under cooperation by the Meteorological Agency and the local public entities concerned.
5. Measures for Ozone Layer Preservation
In order to prevent the ozone layer from being destroyed the "Vienna Treaty for Preservation of Ozone Layer (implemented on September 22, 1985) and the "Montreal Protocol Concerning Ozone Layer Disruptive Substances" (implemented on January 1, 1989) were adopted (both have already been implemented by Japan). Also in Japan, the "Law Concerning Preservation of the Ozone Layer by Restricting Designated Substances" (hereinafter called simply "the law" in this paragraph) was published in May 1988, as an institution to implement the above matter surely and smoothly. (Fig. 2-11)
In the future, Japan is going to positively cope with air pollution problems on a global scale complying mainly with this law.
(1) Public Notice of Basic Matters
On January, 4, 1989, the Environment Agency announced as a basic matter the principal concept of the measures for preservation of the ozone layer in Japan under the above-stated law. This announce-ment includes the policy of measures to advise the Japanese people of the necessity for preservation of the ozone layer and also to indicate the criteria for the production and consumption of designated frons, which our country has to observe under the Montreal Protocol (Ref: Figure 2-12).
(2) Law Concerning Manufacture of Designated Frons
In accordance with the law, the production and consumption of five kinds of frons prescribed in the Montreal protocol (Fron 11, Fron 12, Fron 113, Fron 114 and fron 115{hereinafter called "designated frons"}) and three kinds of halons (Halon 1211, Halon 1301 and Halon 2402) are expected to be reduced in stages. The restrictions on produc-tion of designated frons were put into effect in July 1989.
(3) Restrictions on the Discharge of Designated Frons and Rationalization of Their Use
Enterprises using designated frons are obligated to endeavor to control discharge of designated frons as well as to rationalize their use in accordance with the law after December 1988.
Fig. 2-11 Particulars contained in the "Law Concerning Preservation of Ozone Layer by Restricting Designated Substances"
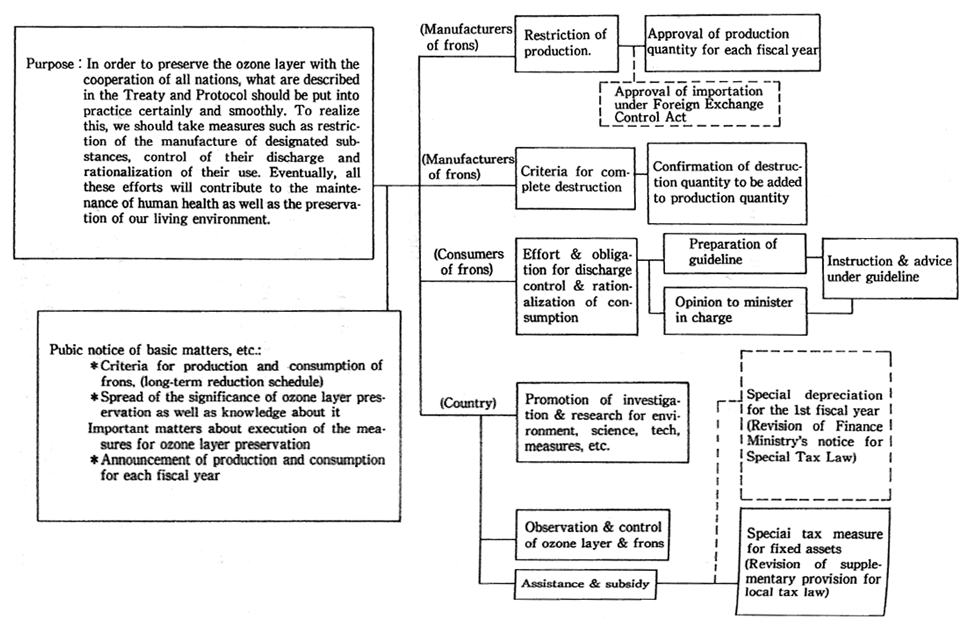
Fig. 2-12 Criteria (Upper Limit) for Production and Consumption of Designated Frons to Be Observed by Japan under the Montreal Protocol Concerning Substances Which May Destray ozone Layer
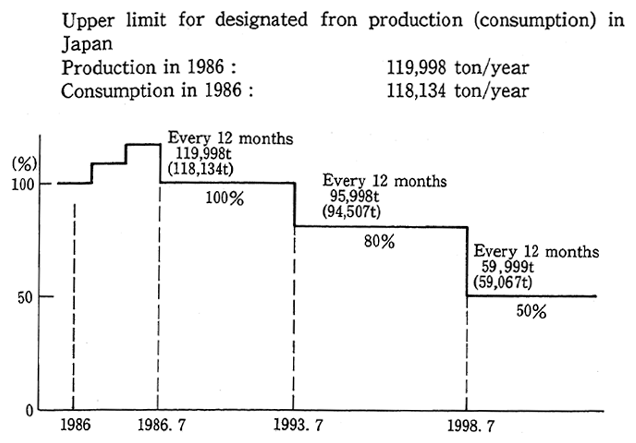
Ramarks: Figures in parentheses repersent the quantity of consumption. Discrepancies between production and consumption have been caused because the volume of export was deducted from the production each year.
On January 4, 1989, the Environment Agency announced the matters required to fulfill the above obligation in the "Guideline for Restriction of Discharge and Rationalization of Use of Designated Frons". According to the guideline, it is obligated that the facilities using the designated frons for washing purposes should be equipped with a device to control discharge of the frons as well as to recover them; and to promote this policy, favorable consideration is to be given on taxa-tion to the enterprisers who adopt the above device, namely, special depreciation is allowed for corporation and income taxes and the in-creased deductible amount is applied for calculation of the fixed asset tax.
(4) Promotion of Investigation and Research Related to Destruction of the Ozone Layer
For the purpose of contribution to global level re-evaluation of the restriction contents, the Environment Agency has been proceeding with investigation and research on the destruction of the ozone layer by designated frons. The Agency has been conducting the observation and survery of the concentration of designated frons in the air as well as the ozone layer. At the same time, the Agency has been performing detailed and fundamental studies on the development and improvement of some models through which the vicissitude of the ozone layer may be forecast, the mechanism of the ozone layer destruction by designated frons, the effects from destruction of the ozone layer, and others.
6. Other Air Pollutants
(1) Measures against Toxic Substances
In addition to NOX the Air Pollution Control Law designates the following four groups of chemical substances as toxic substances gener-ated from soot and smoke emitting facilities and stipulater control of their emission levels; 1) cadmium and its compounds, 2) chlorine and hydrogen chloride, 3) fluorine,, hydrogen fluoride and silicon fluoride, and 4) lead and its compounds.
The emission standards for the four toxic substances other than NOX are established in regard to an extremely limited number of soot and smoke emitting facilities, according to each toxic substance. This is because the emission of such toxic substances is related with the use of specific materials. Aside from these substances, particulate matter emitted in small amounts is classified under the regulation as "soot and dust," irrespective of the chemical composition.
(2) Control of Substances Not Under Control
a. Aimed to prevent possible air pollution from unregulated sub-stances, the emission concentration, environmental impact, etc. of sub-stances suspected to be harmful are being surveyed. Based on the results obtained so far, some substances have been found to have a long-term impact on the environment, although the present levels in the air are not liable to cause imminent problems. Continual biannual monitoring
an in 1985 for a asbestos, in 1986 for formaldehyde and dioxins, and in 1987 for mercury.
b. Measures Against Asbestos
Asbestos in work environment have been controlled under the Industrial Safety and health Law, since it is well known that it causes health damage and cancers by inhalation in high concentration. Con-cerns have been internationally raised on the air pollution by asbestos.
For the above reason, the Environment Agency conducted vari-ous investigations according to the three-year plan starting in fiscal 1981. As a result, it was concluded that the concentration of asbestos in the air was regarded as small in risk to the general public, but it is actually a substance with high accumulativity in the environment. In spite of this fact, since asbestos is widely used, the Environment Agency decided to perform monitoring tests every two years after 1985 in order to continuously observe and grasp the changes in the environment. The Agency made a precise survey in and around the places of their generation in fiscal 1987. According to the result of this survey, asbestos of high concentration was found in the grounds of some manufacturing plants of asbestos products. It was thus doubted that asbestos discharge was not being controlled sufficiently. Based upon these results, the Environment Agency requested local public entities and ministries concerned to further promote control measures..
In consideration of the above matters and also in view of the need to prevent environmental pollution by asbestos, the Central Anti-Pollution Measure Council submitted in March 1989 a report on the steps to restrict asbestos discharge from the manufacturing plants of asbestos. In consideration of such circumstances, a "Draft of the Law Concerning the Amendment of Part of the Air Pollution Control Act" was submitted to the Diet in March 1989.
Furthermore, the Environment Agency and the Ministry of Health and Welfare forwarded in October 1987, and February 1988, notices on how to handle asbestos used in school buildings which has
been attracting the attention of the general public.
(3) Studies on Acid Rain
Serious adverse effects of acid rain on the ecosystems of lakes and forests in North America and Europe became an international issue. Although no such effect has been reported in Japan, necessary investiga-tions including study on acid rain formation mechanism will be made and measures will be taken according to the results since highly acidic rainfall was observed and some cases of eye irritation were reported in the past and it would be too late to take actions when its effects on ecosystems became obvious.
In order to attain the above purpose, the Environment Agency has continued analysis of the components of rain as well as its effect on lakes, ponds and soil, receiving expert advice from the Acid Rain Deliberation Council, in its 5-Year Plan commencing in fiscal 1983. After fiscal 1988, the Agency has been proceeding with the comprehensive pilot monitoring of air, land water and soil which had continued from the past observation, as well as the analytical evaluation of rain water components and the systematic investigation and research on the devel-opment of acid rain-producing model as well as its ecological impact.
Since fiscal 1988, the Agency has been carrying out observation of acid rain at national atmospheric observatories located in 23 places all over Japan.
Studies have also been under way by the Ministry of International Trade and Industry and the Meteorological Agency.
(4) Activities for Information and Education
The rapid growth of the roles to be played by the inhabitants themselves in conserving the local environment calls for the implemen-tation of measures that will provide more opportunities for the inhabit-ants to experience and think about the environment in their own society. After fiscal 1988, the Agency established the national star watching network. In particular, the Agency succeeded in having the local public entities participate in this project and through observation of the starry sky they deepened their consciousness of the need to preserve a clean atmosphere. In June 1989, the Agency held the "Summit in the City under the Starry Heavens and Blue Sky" (in Kita-Kyushu City) for the purpose of discussing various matters such as our approach for preser-vation of the air in each location as well as the promotion of various approaches to utilize the environment of our home towns and villages.
In addition, booklets were published to increase citizens' knowl-edge about the need for conserving the stratospheric ozone layers.
Section 3. Improvement of Monitoring Network
The constant surveillance of air pollution is indispensable for the grasping of th compliance with EQS and for formulation of counter-measures for air pollution, and it forms the basis of air pollution control administration.
(1) National Air Monitoring Network
National air pollution monitoring stations and national environ-mental background air monitoring stations have been established with the combined aim of clarifying the state of air pollution from a nation-wide perspective and with the view to gathering the raw data needed for establishment of EQS and formulation of regional pollution control programes.
National air pollution monitoring stations are located in 15 major region throughout the country (Fig. 2-13). Each station is equipped with various instruments for monitoring SO2 NOX and other air pollutants, and data analyzed for understanding the mechanism of air pollution.
National environmental background air monitoring stations are located at eight places with the aim of understanding ambient air conditions in unpolluted areas on the major plains in Japan. These stations are equipped with instruments for measuring hydrogen sulfide and ozone as well as with similar equipments as in national air pollution monitorirg stations.
Besides these, three national automobile exhaust monitoring stations have been established in Tokyo. And another national automo-bile exhaust monitoring station has been established in Maebashi City, Gunma Prefecture.
As part of the Background Air-Pollution Monitoring Network (BAPMoN) of World Meteorological Organization (WMO), the mea-surement of the atmospheric concentration of carbon dioxide (CO2), the chemical analysis of precipitation and dust, and the year-round observa-tion of air pollution such as air turbidity, have been carried out by the Meteorological Rocket Observatory at Sanriku-cho in Iwate Prefecture.
As far as the preservation of the ozone layer is concerned, the Environment Agency has been observing the concentration of fronts in the air and also the Meterological Agency has been observing the concentration of ozone as well as its distribution in a vertical circle at four places in Japan (Sapporo, Tsukuba, Kagoshima and Naha) and at Showa Base of the South Pole as part of the World Meteorological Organization's (WMO) ozone observations.
Fig. 2-13 National Air Monitoring Network
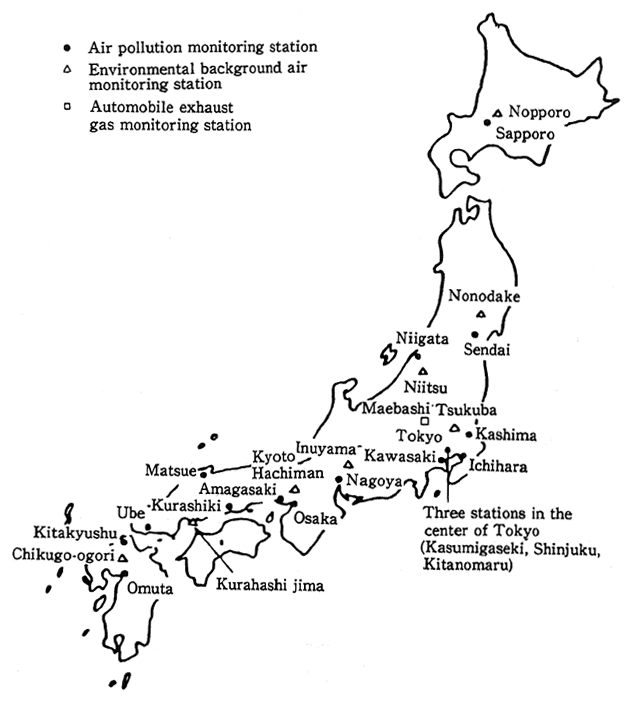
(2) Local Air Pollution Monitoring Network
Prefectural governors and the mayors of designated cities are responsible for the year-round monitoring of air pollution in accordance with the Air Pollution Control Law. In addition, monitoring are also conducted by other local authorities.
Moreorver, continuous monitoring of SO2 concentration at sources, quantity of fuels used, and telemetry system to send data to the central monitoring center is being stepped up by some local govern-ments.
The State subsidizes the improvement of monitoring network by prefectural and designated municipal governments for the systematic development of monitoring systems on a preferential basis in response to the sophistication and increasing efficiency of monitoring technology and to modernize local pollution research institutes to monitor the actual state of toxic chemicals pollution.