Quality of the Environment in Japan 1989
Part One Renewal of Urban Ecosystem's Circulation
Renewal of Urban Ecosystem's Circulation
In the 20th century, urbanization has made progress in each country of the world as if competing with the increase of population and its speed. According to the United Nations' projections, cities around the world were inhabited by 360 million people in 1920 but by as many as 1,983 million in 1985.
As the population of developing countries increases and their urbanization goes on at a remarkable pace, it is projected that the world's population will exceed 6,100 million by the year 2000, and 47% of this population, or 2,900 million people, will inhabit cities.
In Japan, the urban share of the national population which stood at a mere 18% in 1920 has consistently continued to increase, except during World War II, to go up to 76.7% in 1985. In terms of the densely inhabited district (DID) [a district consisting of mutually adjoining National Census, areas, each of which has a population density of upwards of 4,000 inhabitants per square kilometer, and having a com-bined population of more than 5,000], the DID share of the population which stood at 43.7% in 1960 rose to 60.6%. The area of DIDs has also consistently increased.
Toward the advent of the 21st century, it is projected that the population and area of DIDs will continue to go up, albeit at a progres-sively slow pace, and that the population of densely populated areas will increase to 12 million by 2000. When it is taken into consideration that the urban lifestyle and facilities will be all the more disseminated in the countryside, it follows that the majority of the people will live their lives in cities or a city-like environment
Amid this tendency of urbanization, the flow of population into major urban spheres, which remained stagnant in the second half of the 1970s, once again began to take an upswing, primarily in the Tokyo sphere, whereas in the local spheres, the population of sparsely populat-ed areas is decreasing but that of core and other cities is increasing. In conjunction with the betterment of living standards, the increase of free time and the progress of aging, among others, there are increasingly strong calls among the people for a more affluent living environment and greater contact with nature.
In order to work for a well-balanced development of the national land while there is further progress in the restructuring of industry, the internationalization of the economic community, technological revolu-tion, informatization, among others, with the approach of the 21st century, there is a need to rectify the mono-polar concentration of various functions in the Tokyo sphere and promote the desentralization of population and industry with a vitalization of the countryside.
It was with this in mind that the Fourth Comprehensive National Land Development Program which was decided by the Government in June 1987 had been formulated with "formation of a multipolar type of national land" as its basic target. In the program, it is taken up as one of the basic tasks to work for a safe and highly qualitative national-land environment, and it is declared that efforts will be made to "form a stable and lustrous kind of national land by coming out with measures for the maintenance of a serene environment where rich forests and water as well as clean air are available, the natural and historic environ-ment which will bring about a wide variety of blessings and the conser-vation of good roads, and also by coping with environmental issues which are getting increasingly complicated."
Thus, effective measures are needed on a wide variety of environ mental problems which arise in conjunction with the progress of urbani-zation, not only in major cities but in medium and small local cities as well, and to create in a positive manner a favorable environment which has its own characteristic traits and provides rest and lust with the conservation and utilization of local environmental resources.
By so doing, it will be possible to attract people and industries to the countryside, thus contributing to its vitalization, and it is expected that those endeavors will lead to town building of the sort which could well be called furusato, or hometown, as a place of living for urbanites as well as a place for cultural and personal interchanges.
This year, many cities in Japan celebrate the centenary of their founding. As this year marks the beginning of a chapter which will lead to the advent of the 21st century, it may be considered quite significant to review in a long-term perspective the way environmental policy for cities ought to be in the future.
With relations between human activities in cities and the environ-ment grasped as an organic system of urbanites versus the environment in Part 1, attempts will be made to discuss the significance of analyzing the environmental issues posed for cities from this perspective in Chapter 1 and to analyze the present state and tendency of the environ-ment of cities in Japan and from this perspective in Chapter 2.
Chapter 3 will be devoted to an introduction of the trend of various moves and policy measures for bringing this system close to the ecosystem which is independent, stable and circulatory. In Chapter 4, an attempt will be made to dwell on the direction in which environmental policy for cities ought to be stepped up.
Chapter 1. Perspective for Analysis of Urban Environment Man-Versus-Environment System in Cities
(1) Environmental-Policy Tasks in Cities
Japan's environmental policy with the prevention of environmen-tal disruption and the conservation of the natural environment regarded as its pillars has been implemented with priority given to the placing of strict restrictions on the discharge of principal pollutants with attention paid to such phenomena of environmental disruption as air and water pollution, and to the protection of the irreplaceable natural landscape and the natural environment, including precious wild fauna and flora, from actions for development.
As a result, steady achievements have been made, depending on the district and the pollutant. As is discernible from traffic pollution, domestic waste and neighborhood noise, however, it is a fact that not as many achievements have been made an expected in respect of the issues of environmental deterioration caused by the concentration of popula-tion in cities and their excessively stupendous activities.
As measures for the prevention of pollution at its major sources, such as industrial plants, have increasingly proved effective, there has been a rise in the weight of environmental issues which are directly caused by activities in cities themselves, as is the case with other smaller sources of pollution, individual families' everyday lives, the traffic of automobiles and garbage disposal. That is a rise in the occurrence of the "urban and livelihood type of pollution."
Particularly in major cities which serve as the cores of political, economic, social and cultural activities and in which industrial, finan-cial, transport, communication and other functions are concentrated, environmental issues are getting increasingly complicated, such as the overpopulation of city centers, urban sprawls and the increased demand of energy and means of transit, to say the least of the rapid disappear-ance of invaluable nature in cities.
Pollution of an urban and livelihood type is more or less observed already in medium and small cities in the local spheres and eventually in rural hamlets. As urbanization makes further progress in the local spheres and the dispersion of population and industry to the countryside is stepped up to a further extent, there is a danger that their environ-mental issues may take on a more complicated character, as is already the case with the spheres of major cities.
(2) Grasping of Urban Environment as System
In order to cope with a wide variety of environmental issues which arise in conjunction with urbanization, the essential thing is to work for a reasonable utilization of land in cities and a streamlining of their urban infrastructure as well as to avoid an excessive concentration of population and industry. Nonetheless, there is a need to take another close look at issues in terms of the system as a whole by going as far as to check into the economic and social setups which sustain cities' structure and activities as well as the present lifestyle of their inhabit-ants and its future prospects.
Responses to the individual sources of pollutants and each of the environmental media which include water, air and soil are not adequate so that it is important to systematically formulate all-round and far-sighted plans at the most effective time and stage, after coming to grips with the balance of energy and the whole picture of material circulation in cities.
In other words, it is necessary to take up cities as organic systems ; to clarify the structure of energy metabolism and material circulation in the cities, the changes brought about in nature in conjunction with the evolution of urbanization and the process of changes in man's behavior and consciousness in association with the environment; and to bring a wide variety of urban activity and structure to the independent, stable and circulatory mechanism of the ecosystem.
(3) Metabolism in Cities
Essentially, the environment is the whole of a framework which man and other living things are hemmed in, and pollutants move around in the environment with their configuration and property undergoing changes.
Acid rain, which is now a matter of grave concern not only to Western nations but the rest of the world as well, damages forests and acidifies lakes, lagoons and soils, among others, but it is essentially triggered by air pollution as a result of the use of fossil and other fuels. The inappropriate utilization and discharge of a wide variety of chemi-cals are responsible for air and soil pollution, beside that of underground and public water areas.
Moreover, attention must be paid to the existence of a sort of compound relations among urban environmental issues. For example, the production and consumption of energy with the massive consump-tion of fossil and other fuels in the cities not only give rise to air pollution but produce waste heat as well, thereby adversely affecting temperature and climate in the whole of each city. In conjunction with the evolution of urbanization and motorization, on the other hand, the ground surface is increasingly paved and the number of man-made structures rises in the cities, on the one hand, and natural ponds and other waters disappear from them.
In this conjunction, plants on the ground surface and gas evapor-ating and dispersing from the water surface will reduce, so will rain-water penetrating underground, with the result that urban temperature will go up and there will be changes in desiccation and the balance of underground water. In the city center where the ground surface is almost entirely covered by roads, buildings and other artificial struc-tures, the use of cooling and other machines to avoid the urban tempera-ture which has thus risen will encourage in a vicious cycle rises both in energy consumption and temperature.
Needless to say, water pollution is caused by pollutants which are discharged into the environment in conjunction with corporate perfor-mance and individuals' everyday lives, whereas the ecosystem of nature, including rivers, lakes and lagoons, is more or less equipped with a self-purification capability. The pollution of urban rivers and other bodies of water goes on because their self-purification capability is impaired for some reason or the other or because waste is concentrated-ly discharged in excess of their self-purification capability.
Presumably, there are situations where because of an inadequate flow of river water, hopes may not be pinned on its effective dilution and proliferation of pollutants. Moreover, in built-up urban areas where roads are paved and many artificialities exist, the large volumes of water for which adequate outlets are not available are channeled into a river by cataracts of rain in a spell, thereby increasing the danger of flooding and the burden of sewer disposal plants of a combined type and other facilities.
Having said that, the question of water pollution in the cities is not only associated with controls on discharge from factories, ordinary families and other sources and the streamlining of sewer systems and other urban facilities but also with the progress of urbanization, the loss of favorable waterside and natural ponds, soil pollution and the illegal discharge of waste, among others.
The pollution of underground water, lakes and marshes, bays and inland seas is inseparably tied in with material and water circulation in the cities.
(4) Nature and Environmental Resources in the Cities
In regard to nature in the cities, on the other hand, there have been attempts to look for nature of the sort which makes it possible to have access to something like primeval nature in are far from the cities and to peace of mind and charm. As is stated in the Fouth Comprehensive National Land Development Program, the important thing is that "in order to conserve the natural environment as a living environment, efforts will be made to work for the preservation of existing trees in the cities and forests and other plants in their suburbs and at the same for the creation of a nature-like environment, such as with afforestation."
"In this instance, efforts will be made to work for the coexistance of nature and man while improving the quality of the natural environ-ment with a recovery in the cities of something like primeval nature which could be inhabited by birds, insects, riparian and latchstring fish and other small animals."
Those moves are not only designed to conserve nature which remains in the cities but, while regarding it as an invaluable environmen-tal resource, to build an affluent, comfortable urban environment with its utilization or positive creation. They provide a convincing clue to town building and regional activation in the future.
(5) Man in the Cities--Environmental Policy from
Perspective of Environmental System
A wide variety of urban activities have evolved in Japan with a view to coming out with safe, convenient and modern cities. In those moves, nonetheless, efforts have sometimes been so much made for a better economic efficiency that the health of urbanites and the comfort of the living environment are marred or that the diversified functions which are inherent to nature and man's spiritual values are abstracted.
By grasping relations between man's activities in the cities and the environment as a system, the independency, stability and circulation which are possessed by the ecosystem may be restored and the direction in which a favorable urban environment is to be formed may be sought.
Having said that, the essential thing is that there is a need, more than anything else, to comprehensively and cross-sectionally analyze and assess the process of urbanization and the changes brought about by urban activities in the environment and to come to grips with the structure and mechanism of the environmental issues posed for the cities in order that the evolution of urbanization and the deterioration of the environment may be prevented to build a more favorable urban environment.
For this, it is methodologically effective to consider relations between man's activities in the cities and the environment as a system and make clear the flow of water and the structure and function of water and the material environment in the cities.
By so doing, it is expected that it will be possible to make up for the deficiencies in the policy measures implemented for each environ-mental medium with attention riveted on each specific phenomenon of pollution--which have sometimes turned out to be ex post facto or symptomatic responses--and to formulate genuinely all-round and fore-sighted urban environmental measures from the perspective of the prevention of environmental disruption in the cities in a narrow sense of the word and the conservation of nature, the health of residents and the creation of an environment comfortable to live in, among others.
chapter 2. Man in the Cities-Environment with Attention Focused on Environmental System
When cities are viewed as a system, the independency, stability, circulation and other properties possessed by the ecosystem are marred by contemporary urban functions. In Chapter 2 attempts will be made to analyze water, energy, transportation, waste, greenery and living things in terms of a system of man versus the environment in regard to the environmental issues posed for cities.
1. Water Circulation and Pollution in the Cities
In the cities, the circulation of water in the ecosystem of nature is impaired and the water of rivers and other bodies of water is markedly polluted by the concentration and progressively high density of a wide variety of activities, among others. Just as water is a basic element which sustains a wide variety of activities in the cities, its existence per se serves to stabilize the urban environment, including its climate.
(1) Changes in Water Circulation and Impacts
a. Increase of Impermeable Land, Etc.
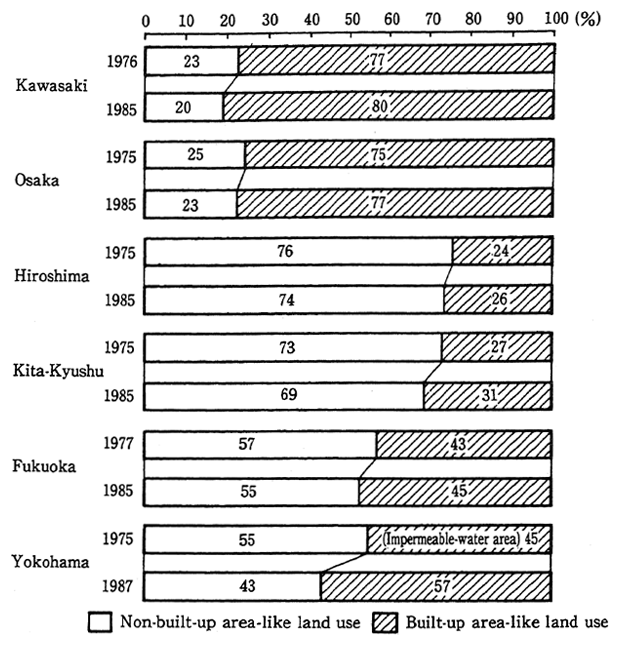
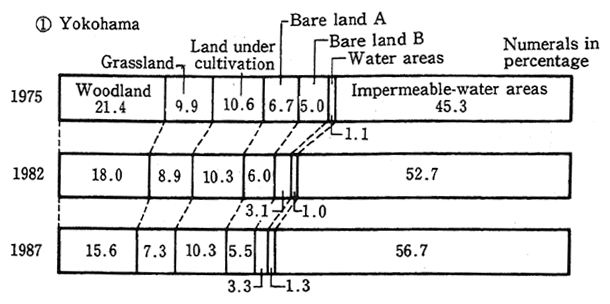
One of the major changes brought about by ongoing urbanization is that built-up urban areas have sprawled to a point where farmland, forests, grassland and other lands are turned into sites for ferroconcrete buildings and houses, asphalt-paved roads and other facilities. Fig.1, a tabulation of changes in the utilization of land in the major cities, shows forests, farmland and other lands have been on the downswing in the last decade. In Yokohama City, a check of changes in the utilization of land particularly from the standpoint of water permeability reveals that afforested and other water-permeable lands have been on the downturn in the last 12 years with the rate of water-impermeable land significant-ly rising from 45.3% to 56.7%.
In addition to such an increase of water-impermeable land, the development of sewer systems has been stepped up in the cities as a measure to prevent inundation, thus making it possible to drain rain-water from the cities at a quick pace.
Fig. 1 Changes in Use of Land in the Cities
Remarks:1. Prepared from each city's date.
2. Breakdown of non-built-up area-like land use.
Kawasaki :Upland fields, paddy fields, mountain forests.
Hiroshima :Land for agriculture, forests, wasteland, rivers, water surface, water channels.
Fukuoka :Land for agriculture, forests, rivers, water surface, water channels.
Osaka :Public parks, open space, farmland, vacant lots, rivers, water surface, etc.
Kita-Kyushu:Upland fields, paddy fields, forests, closed-water sur-face, public parks, open space, vacant lots.
Yokohama :Woodland, grassland, land under cultivation, bare land, waters.
b. Changes in Balance of Underground Water
In a number of cities, on the other hand, there is progress in the use of underground space with the construction of tap water and sewer systems, subways and other facilities, which produces a significant impact on the balance of underground water.
The results of a survey announced by the Tokyo Metropolitan Government in 1981 indicated, for example, that 250,000 cubic meters of water a day seeped into underground pipes through their joints and other parts is 1977, and it was projected that this volume would rise to 390,000 cubic meters a day by 1987 due to the construction of pipe ducts and other facilities. Besides, an additional 20,000 cubic meters of under-ground water a day seeped into subway and passage tunnels and other facilities and discharged into sewer systems, among others.
Moreover, as drilling work is conducted for the development of underground shopping centers and the construction of subway lines, there have been cases in which it is reported that underground water flowed out or was discharged in such enormous quantities that the ground subsides more that 26 centimeters a year. Conversely, it was projected by the Tokyo Metropolitan Government that as large quan-tities of water escaped from tap-water pipes into the underground, the quantity would rise to 560,000 cubic meters of water per day by 1987.
Having said that, the urban water environment is changing due to a wide variety of man's activities, and it was estimated by the Tokyo Metropolitan Government that the quantity of rainwater discharged into the sea by way of the ground surface and drainage pipes would rise by about 6% in 1977-87 but that that of water which was to strike into the underground would decrease by a little less than 6% and the quantity of evaporation from the ground surface and plants by 4% or so.
c. Impacts on Urban Climate
Such changes in water circulation in the cities brings, about impacts on their climate. In plain language, water, which is slower to warm or cool, plays a significant role in stabilizing temperature. The evaporation of water also contributes not a little to the discharge of heat from the ground surface, thus preventing a rise in the urban temparature.
Nonetheless, the decrease of green tracts of land, the covering of the ground surface with asphalt and other materials, and the decrease in the supply of underground water to the underground have become a factor for a quantitative drop in the evaporation of water from the ground surface, trees and other plants and for a rise in the temperature of the city center in midsummer. (On the heat island phenomenon of cities, see "2. Energy Metabolism in the Cities.")
d. Drying-Up of Spring Water and Decrease in Riparian Water Outflow
The decrease in the underground permeation of rainwater gives impetus to the drying-up of spring water in the cities and the drop in the normal outflow of riparian water. For example, according to a survey of the Tokyo Metropolitan Government, there used to be many sources for spring water, such as the Inogashira Pond, along the Kanda River, the outflow of which was as much as 20,000-30,000 cubic meters a day, but there only remain only two coherent sources of spring water whose contribution is small to the outflow. Along the Meguro River, there used to be upwards of 30 sources of spring water but now there is half of that.
Also, there used to be a number of sources of spring water for the Shin-Kagishi River, but as the spring water of the Nanushi Fall has dried up, there remain few sources of spring water. As is the case with those examples, it has been reported that the sources of spring water for many medium and small rivers in the cities are decreasing due to the progress of urbanization, thereby dropping their inherent outflow.
e. Increases in Water Demand
As the underground permeation and reserve of rainwater in the cities are on the downturn, underground water is used for industry and buildings as a favorable, constant-temperature and low-cost source of water, with the result that it is drawn up in enormous quantities in conjunction with the sophistication of welling techniques and other factors. Given this situation, the ground subsides primarily in the cities, inflicting damage on buildings and acting as a factor responsible for greater damage from floods. In light of this fact, Tokyo, Osaka, Nagoya and other urban areas place restrictions on the drawing-up of under-ground water and, at present, the drawing-up of underground water for industrial and other purposes are on the downfall.
In order to cope with an increase in water demand which arises from urbanization, the development of upriver dams and other measures are under way.
(2) Urbanization and Ongoing Water Pollution
a. Urbanization and Water Quality of Urban Rivers and Other Bodies of Water at Present
In conjunction with rapid increase of urban population and the remarkably fast development of industry, inadequately treated waste water is discharged in such enormous quantities that the inhalation of offensive odors and other serious types of water pollution made their presence felt Later, as restrictions on drainage and other measures were implemented, the situation was improved to a considerable extent, but an appalling state of pollution remains intact.
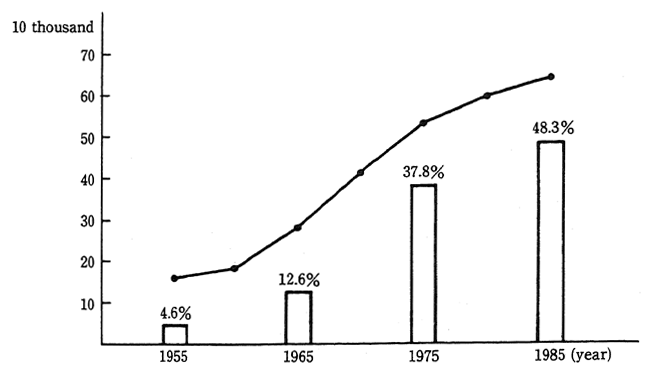
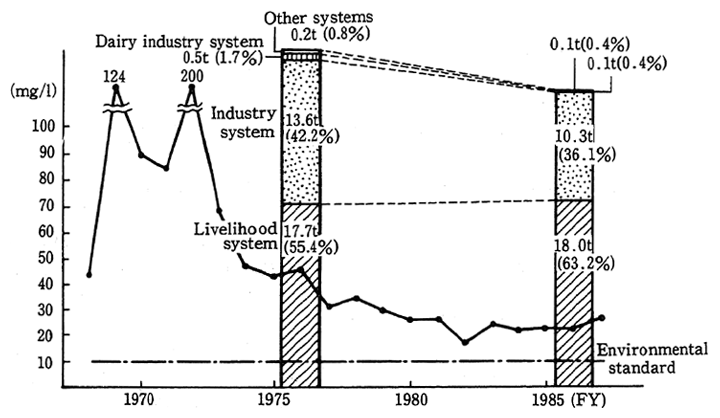
A check of the conditions in the case of the Ayase River, the worst of all rivers in eight consecutive years according to water quality survey of Type 1 rivers (Fig.2), reveals that the water quality has deteriorated due to the progress of urbanization, such as a rapid increase in population, to a point where the habitation of living things is made impossible, and that efforts have been made to improve the water quality with restrictions on drainage and other measures since the first half of the 1970s.
Later, however, the restrictions were tightened and made thoroughgoing, and a system of area-wide water pollutant load control standards was put into effect for the Bay of Tokyo in 1978 under which standards were set forth, sewer systems developed, and small-scale drainage and other measures were taken. Despite those measures, no substantial improvements have been made as a whole and the situation is far from accomplishing the environmental quality standards.
For Teganuma, Inbanuma and other lakes and marshes in whose basins urbanization is in progress, the development of sewer systems and other measures have fallen behind, and marked degrees of pollution are still observed.
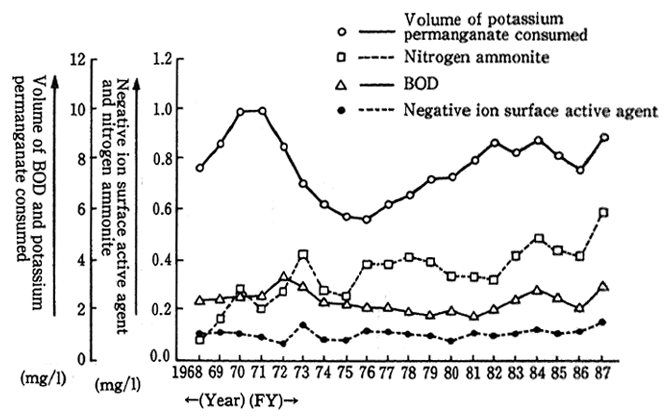
Some water sources for tap water systems are also affected by water pollution. Fig.3 shows the conditions of raw water in the Kanamachi Water Purification Plant, which accounts for nearly one-fourth of the total quantity of water distributed to Tokyo. In recent years, there have been signs of a deterioration, which is responsible for the unpleasant odor of service water.
Fig.2 (1)Urbanization Rate and Changes in Population in Ayase River Basin (Only Saitama Prefecture Covered)
Remarks: Prepared from data of the Edo River Construction Work Office, construction Ministry.
(2)Changes in Water Quality and Generation Load of Ayase River
Remarks: 1. Prepared from a survey of Saitama Prefecture.
2. The water-quality monitoring point is on the border between Tokyo and Saitama Prefecture.
3. The generation load represents only Saitama Prefecture.
Fig.3 Changes in Kanamachi Water Purification Plants' Raw Water Use as Tap Water
Remarks : Surveyed by the Water Service Bureau, Tokyo Metropolitan Government.
b. Massive Inflow of Household Effluent
The primary cause of water pollution in cities is the concentra-tion of population in the basins and the resultant massive inflow of household effluent.
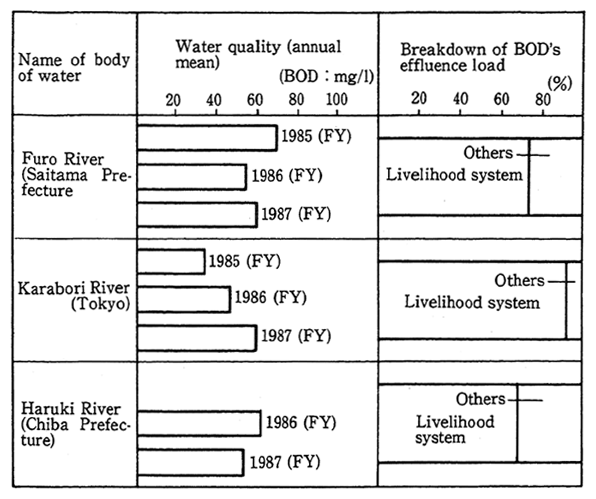
Of all representative urban rivers in the National Capital Region, the Furo River (Saitama Prefecture), the Karabori River (Tokyo) and the Haruki River (Chiba Prefecture) are markedly polluted, and their loads are indicated in Fig.4 by water quality and also by source of origin. It is evident that the rate of household effluents is high for the three rivers. A check of strikingly polluted lakes, marshes and seas reveals that the share of household effluents in the total pollution load is 77% for Teganuma, 63% for Inbanuma and 70% for the Bay of Tokyo, proving that the household system of pollutants is the primary cause to pollution.
A check of the Ayase River, to which reference has just been made, show that the load of the househole system of pollutants --miscellaneous household effluent--has a great weight, along with that of the industrial system of effluent which still accounts for 36% of the total load, though the pollutant load has decreased by about one-fourth in the last decade.
Fig.4 Water Quality of Major Polluted River in National Capital Region and Effluence Load
Remarks : Surveyed by the related prefectures.
Particularly in the case of the Ayase River, the pollutant load of the household system of effluent is still higher than 10 years ago and its share in the total pollutant load has climbed from 55% to 63% because of the fact, among others, that the development of sewer systems has failed to catch up with the ongoing increase in the pollution of the basin (a check of the sewer system dissemination rate in Saitama Prefecture' s major cities along the river shows that it is exceedingly low at 10% or so).
c. Changes in Lifestyle
Against the background of the rise in the load of the household system, changes in lifestyle may be pointed out, such as the facts that families with bathtubs in their houses have increased, that families with electric washing machines have increased, and that there has been a rise in the use of detergents and edible oil, beside the ongoing concentration of population in conjunction with the evolution of urbanization. More-over, there has been a rise in the number of restaurants and other food catering services, primarily in the cities, due to the proliferation of the eat-out practice.
d. Urban Rivers withoat Self-Purification Capacity
The water pollution of urban rivers is also affected to a signifi-cant degree by the drying-up and decrease of spring water which assures a coherent discharge for those rivers, as we have seen in (1).
In Tokyo alone, the Shirako, Yase, Sen and other rivers which used to be known for their clean water have turned into ditch-water ones, so to speak, into which household effluent is discharged as it is. For rivers the pollution of which has proved striking in surveyes on the water quality, the reduced volume of flowing may be cited as a common factor, along with the delay in measures to cope with household effluent.
When the organic matter of household and other effluent is discharged into rivers and the flowing volume is small, the habitat of large living creatures will be made difficult, encouraging the propaga-tion of microorganisms alone and resulting in less predation.
Besides, the remodling of rivers into ferroconcrete water chan-nels has reduced the self-purification capacity of microorganisms, among others. In other words, in a situation where waste water flows into rivers and other bodies of water, the water quality will deteriorate, albeit temporarily. But as water goes down the rivers and other bodies of water, it will return, thanks to the self-purification capacity of bacteria, protozoans and microfauna, to what it used to be before the inflow of waste water. Water purification will be performed by contact and oxidation on the beds of the shallows and, on the pools, by the sedimentation of suspended matter and the digestion and dissolution of organic matter in the sediments. But it is pointed out that such purifica-tion hardly takes place in the ferroconcrete-coated water channels.
(3) Pollution of Underground Water
Constant in temperature and good in quality, underground water is used not only as household water, including drinking water, but also as industrial and agricultural water. Besides, it is also used for build-ings. In the total use of water across the nation, underground water accounts for roughly one-seventh and in terms of water used In the cities (industrial and household water), it stands at 30% or so.
In the first half of the 1980s, however, it came to light that underground water was polluted with trichloroethylene and other or-ganochroline solvents.
In a fact-finding survey performed by the Environment Agency on the pollution of underground water in 15 cities across nation in 1982, it was found that trichloroethylene and tetrachloroethylene were detected in nearly 30% of the sampled wells. The density values of trichloroeth-ylene and tetrachloroethylene which exceeded the WHO-specified provi-sional water quality guideline values were measured in about 3% and 4%, respectively, of the sampled wells. It was also ascertained in subsequent surveys that underground water was polluted at various places.
Of the pollutants, tricholoroethylene is used primarily as fat-removing detergents for metallic parts, whereas tetrachloroethylene is used not only as dry-cleaning detergents but as fat-removing detergents for metals as a material and for the production of the fluoric system of solvents as well. Both of them are nonflammable, their fat-removing capacity in great and they are easy to recover, so that they are used at many business establishments.
(4) Changes in Water Circulation and Waterside
Of the rivers in the urban areas, there are some whose water volume decreases, from which rainwater flows into the sea as fast as possible when it rains and which, having lost its inherent volume of flowing, merely serves to let sewage sun out in normal circumstances, ruining the habitat of fish.
Due to urbanization and the propagation of the urban lifestyle, few scenes are visible today in which people do their laundry in nearby rivers, and the bodies of water located in the cities have turned out to be useless in terms of space and places dangerous to children and undesirable in terms of hygiene.
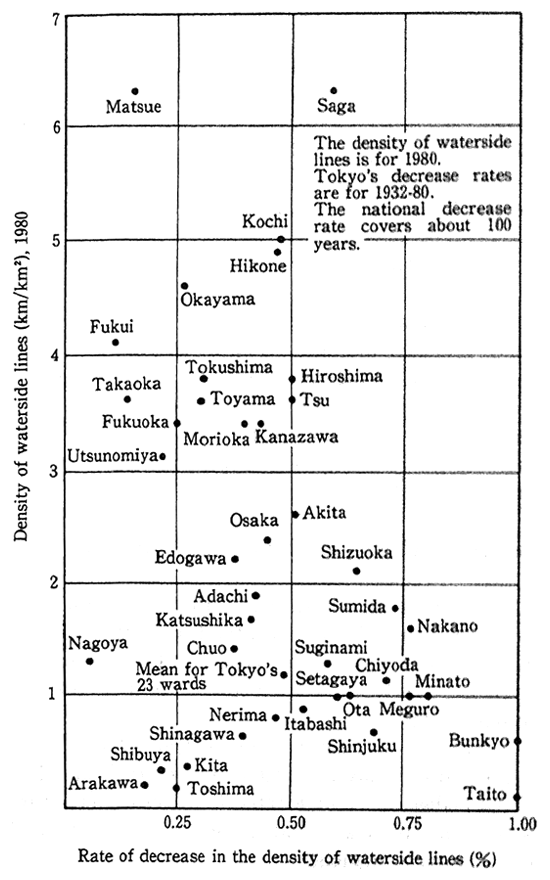
Given those factors, some of the medium and small rivers which are conspicuously polluted have been reclaimed or made into under-drains and other facilities. In the case of Osaka, for example, the area of rivers and other bodies of water has decreased by about 20% in the last 20 years. Fig.5 indicates that the decrease of bodies of water in Tokyo's 23 wards is conspicuous.
Fig.5 Density of Waterside Lines and Decrease Rate in 1980
Remarks: Prepared from "Thinking about Rainwater in the Cities" edited by the Resources Survey Council, Agency of Science and Technology (a partially amended version of Nobuyuki Takahashi's discourse for doctoring "A Study on Urban Water Environment").
The transformation of rivers in this fashion has driven people to lose close contact with the waterways. A questionnaire given to resi-dents (household masters) living along the Nikaryo Irrigation Channel and Hirase River which run through Kawasaki City indicates that nearly 90% of the residents who have lived from before 1944 used to have a dip in their nearby river in their childhood but that only one out of every six residents who have lived since 1965 has had such an experience before, suggesting that children have lost a chance directly to enjoy themselves in rivers.
A survey on the Shakujii River, one of Tokyo's medium and small rivers, reveals that the water surface in not visible from 46% of the riverbanks as its view is obstructed by mural ferroconcrete walls and fences.
Given those factors, there is a need to implement thorough measures to curb discharge at the pollution sources, including individual households, and to regenerate the circulation of water in the urban areas by giving impetus to the underground permeation of rainwater, working for the conservation of precious water sources and areas remaining in the cities, such as spring water, and stepping up the effective use of sewage disposal water and other types of water.
2. Urban Energy Metabolism
A high density of energy, produced primarily in other areas, is consumed by cities. Generally, heat and pollutants are discharged when primary energy, such as crude oil and coal, is converted into secondary energy, including electric power and gasoline, and secondary energy is consumed in the final phase of consumption. The discharge of pollutants gives rise to a wide variety of environmental-pollution issues and that of heat brings about changes in the microclimate.
(1) Urban Energy Consumption and Urban Environment
The consumption of energy per square meter in the whole of Tokyo was 263.1 kcal/day in 1987, 13 times as much as the national average.
Due to the consumption of such a high density of energy, changes in the ground surface and other factors, a number of features have been observed in the urban climate.
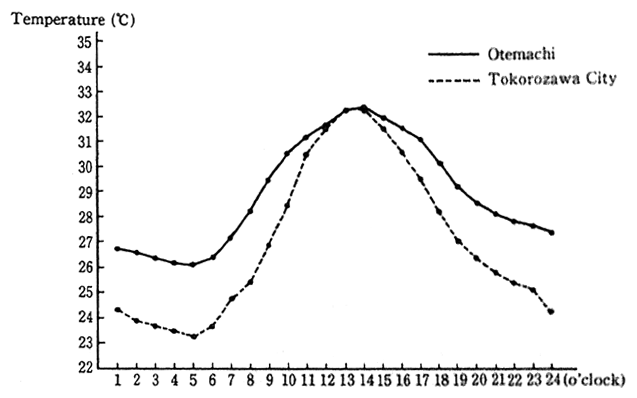
There is a difference in temperature between the city heart and the suburbs, This is known as heat island phenomenon For example, a check of daily fluctuations In temperature between Otemachi in Tokyo and Tokorozawa City, Saitama Prefecture with typical summer days sampled from 1982 and 1987 (Fig.6),showed there was almost to difference in the maximum temperature but the temperture was lower in Tokorozawa at other hours. There was a difference of about 3? in the minimum temperature.
Fig.6 Fluctuations in Temperature at Otemach Tokorozawa City on Typical Summer Day
Remarks : Environment Agency's data.
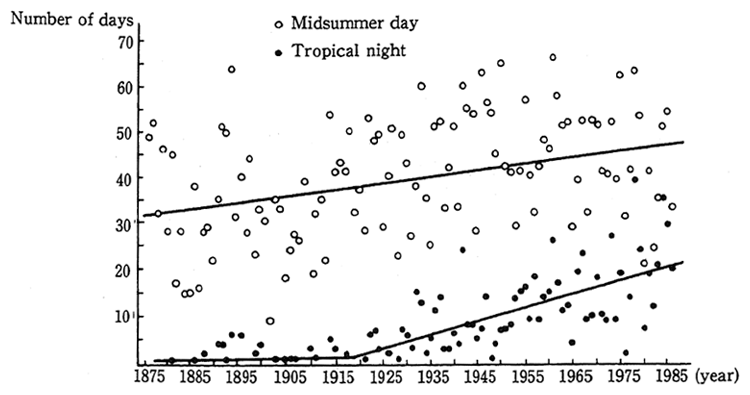
A check of annual changes in the numbers of midsummer days (the days when the maximum temperature exceeded 30?) and tropical nights (the days when the minimum temperature exceeded 30?)(Fig.7) indicates that the number of midsummer days moderately increased and that of tropical nights took a sharp upswing in the last years of the 1910s.
Moreover, a check of the average humidity in Tokyo in January reveals that it had leveled off at 60% in or until 1950 but later took a sharp downturn and there were many years in which it was below 50% (Fig.8).
Fig.7 Secular Changes in Frequency of Tropical Nights in Tokyo
Remarks: Meteorological Agency's
Fig. 8 Secular Changes in Tokyo's Humidity
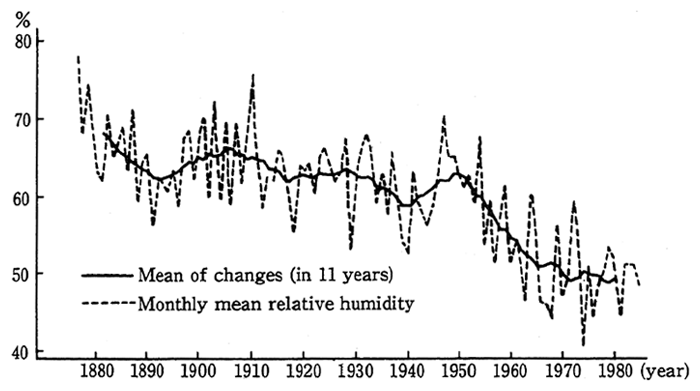
Remarks: Meteorological Agency's data,
Here, let us see the influences brought about by the open-space ratio, the volume of artificial heat caused by energy consumption and the conditions of the paved surface on the temperature of cities.
A. Influences of Open-Space Ratio
The rate of open space (paddy and upland fields, grassland and afforested flatland) in Tokyo's 23 wards stood at 5.6% in 1987. In situations where this ratio is raised (the cases of 30% and 50% where it is hypothesized that the space of roofs decreases in proportion to the increase in the area of open space), an estimate of the temperature at the heart of Tokyo suggests that the maximum temoerature is down 0.7? and 2?0, respectively, from midday to nigth (Fig. 9).
Fig. 9 Hourly Changes in Temperature in Cases with ncreases in Urban open Space
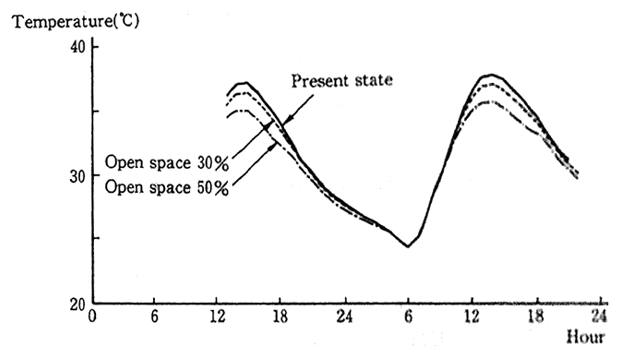
Remarks: computed by the Environment Agency on a trial basis.
B. Influences of Artificial Heat
In situations where artificial heat is lowered (the cases of 1/2 and zero), the maximum temperature from midnight to dawn is down 1? and 2? (Fig. 10). It is evident that the artificial heat caused by energy consumption serves to raise the temperature, coming out as major factor for tropical nights.
C. Inaluences of Paved Surface
In situations where the rate of water evaporation from the paved surface is raised (the cases of 10% and 30%), the maximum daytime temperature is down O.5? and 1? (Fig. 11).
The use of energy is accompanied by a load on the environment.
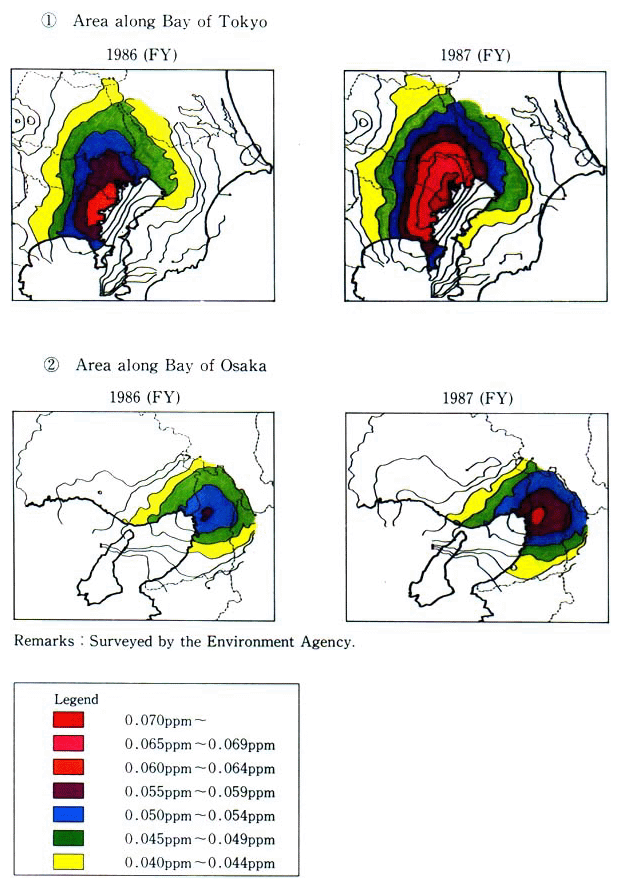
The exhaust of carbon dioxide caused by the consumption of fossil energy in Tokyo was about 28,780,000 tons/year in 1987, and that of sitrogen oxide in Tokyo's special wards and other neighborhoods was 52,700 tons/year. As we have seen in Chapter 1, environmental pollution by nitrogen dioxide leveled off from 1975 to 1984 but aggravated in 1986 and further in 1987. In particular, there were conspicuous signs of an aggravation in major cities and their peripheries (Fig. 12).
Fig. 10 Hourly Changes in Temperature by Differences in Artificial Heat
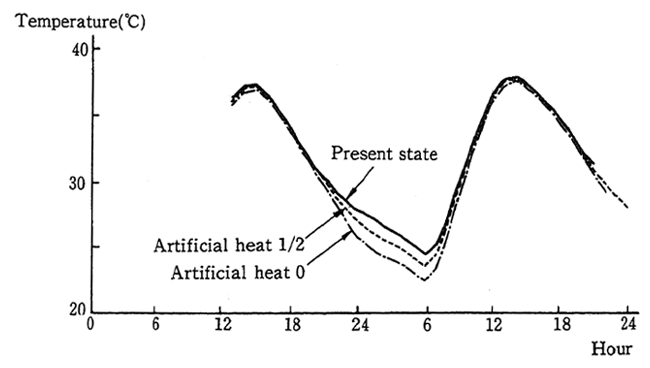
Remarks: Computed by the Environment Agency on a trial basis.
Fig. 11 Hourly Changes in Temperature with Differences in Pavement of Road Surface
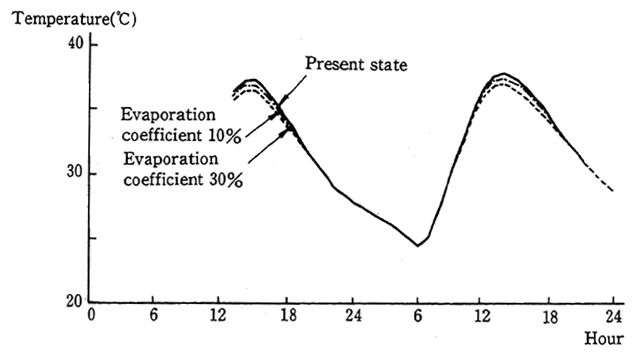
Remarks: Computed by the Environment Agency on a trial basis.
(2) Consumption of Urban Energy Consumption at Present
In Japan, 308 million kiloliters of commercial energy were con-sumed in 1987.
A check of the flow of energy in Japan indicates that the volume of consumption in the final consumption phase accounted for 7.4% of the total supply of primary energy in 1987. This was because there was a loss in the energy conversion and othe sectors.
The coefficient of energy in the final consumption phase for automobiles, for example, stood at 20-30%, and the rate of the volume of energy used for primary purposes to that of primary energy was further lower.
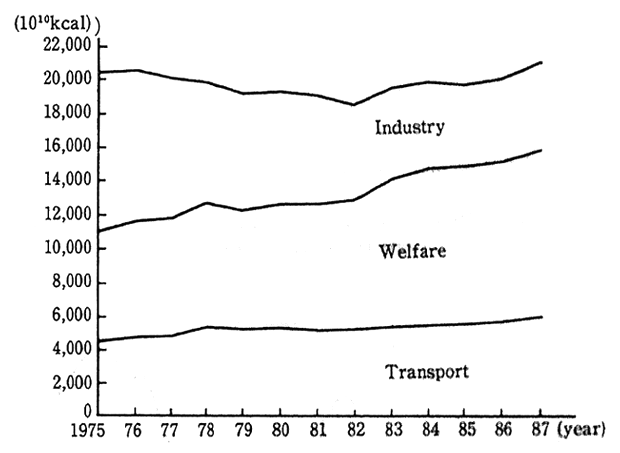
In the example of Tokyo, the consumption of energy is shown in Fig. 13, and the following may be pointed out in regard to the urban consumption of energy.
Fig. 13 Consumption of Energy by Tokyo
Remarks: Estimated by the Environment Agency.
A. The total consumption of energy in 1987 increased at an annual rate of 0.2%, as compared to 1975 and has risen at an annual rate of 2. 4% in the last five years.
Fig. 12 Status of Annual Nitrogen Dioxide Density Value in Aress along Bay of Tokyo and Bay of Osaka
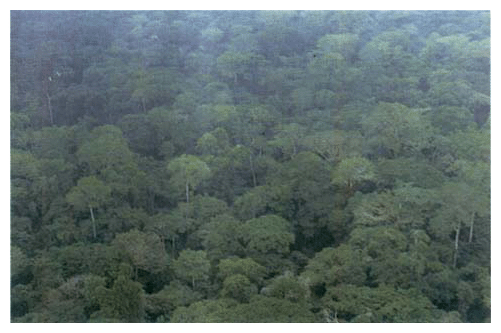
Tropical rain forest (Northeastern Zaire)
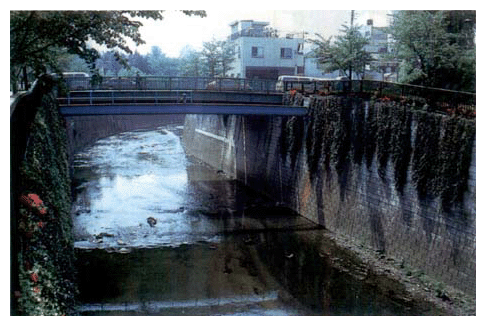
Small urban river (Shakuiji River)
B. A check of energy consumption by type of use (in 1987) reveals that industry had a large share of 50.2% across the nation but that the rate for Tokyo was low with 24.3%. Transportation had a high share of 28.8%, followed by businesses with 23.7% and households with 23.3%.
The rate of increase in the consumption of energy by type of use was 57.0% for oil, 21.9% for electric power, 13.7% for city gas and 7.4% for LPG. The rate of rise since 1975 was -1.8% for oil. By type of oil, the share was 5.2% for light oil and 2.0% for gasoline. This indicates that there has been a considerable rise in the number of trips by automobiles--diesel-engine automobiles, in particular.
The energy coefficient of automobiles is lower than that of other means of transportation (Fig. 14). Speaking of all types of automobiles, the energy coefficient of automobiles for business purposes is higher than that of owner-driven automobiles.
Fig. 14 Original Unit of Energy Consumption by Major Means of Transport (1987 FY)
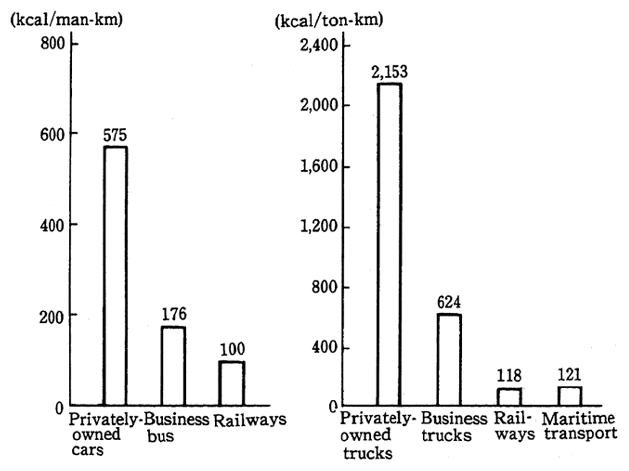
Remarks:1. Sources: Statistical Annual Report on Land Transport, Statistical Annual Report on Private Railways, Statistical Annual Report on Coastal Ship Transport.
2. Original unit of energy consumption= Energy consumption by means of transport (kcal)
Transport volume by means of transport (in man-kilometers, ton-kilometers)
(3) Urban Energy Sources
Cities feature a high-density use of energy. In some cities there exists energy of the sort which released in conjunction with a wide variety of urban activities, such as the exhaust heat which comes out as a result of the use of energy in the finnal consumption phase.
The National Institute for Research Advancement(NIRA) esti-mated that 19 million kiloliters of heat in terms of crude oil a year was exhausted by sewer treatment plants, garbage incineration plants subways, underground power-transmission cables and other facilities in Tokyo's 23 wards, and this volume corresponds to 83% of the demand of heat for the heating of apartments and ordinary house in Tokyo 's 23 wards and hot-water supply to them. Of this volume, the amount of heat which could be locally supplied was roughly 50% of heat demand.
In the cities, too, solar heat and other type of natural heat exit. For example, 2,950 kcal/m2キday of solar energy available over Tokyo, and this volume is about 10 times as much as the present consumption of commercial energy in term of density.
In the cities, the rise in the consumption of energy by transporta-tion, business and households is high, and it is important to further raise the coefficient at which energy is put to use in those sectors, Besides, it is necessary to reduce the loss of energy, such as by working for a more highly efficient use of energy in the energy converision sector, to work for a more efficient use of energy as a whole with the utillzation of unused exhaust heat and other sources, and to establish a system of urban energy metabolism with little load on the environment.
3. Movement of People and Goods and Automobile Traffic in the Cities
Tranportation sustains a wide variety of urban activities and person-to-person interchanges and physical distribution between cities It not only makes possible the division of production, living and other urban functions but regionally sprawls urban activities and raises the degree to which cities depend on other areas for the supply of commod-ities and other things as well.
In the ecosystem of nature, the movement of commodities and other things governs the flow of water and air and helps to form independent, stable and circulatory systems.
In regard to environmental pollution of the sort which is caused by urban traffic, restrictions have been gradually imposed on the exhaust gas of automobiles since 1965, but urban traffic has turned out to be one of the major causes to the question of air pollution, among others, as there has been a failure to from urban structure and transport system of the kind which may respond to an ever-increasing traffic volume in conjunction with rises in the scale and density of urban activities, the sophistication of the industrial structure and other fac-tors.
In particular, the density of nitrogen dioxide has worsened in recent years. If measures are left as they are, it is difficult to achieve environmental standards, and there are calls for a replenishment and reinforcement of the measures.
(1) Automobile Traffic and Nitrogen Oxides
As measures to cope with nitrogen oxides, controls on effluent from factories have been strengthened, facilities subject to controls expanded, and total area-wide pollutant load controls and controls on exhaust gas from automobiles strengthened. Other measures to cope with automobile traffic include physical-distribution measures to curb truck movements with an upgrading of the coefficient of goods trans-port; measures to cope with the flow of people, such as by increasing the convenience of public means of transit ; and measures to smooth the flow of traffic, such as by developing traffic control systems and im-proving the structure of intersections. The propagation of electric and other low-pollution automobiles and shift to automobiles satisfying the latest restrictions have also been stepped up.
Particularly in 1985 which coincided with the deadline of achiev-ing the environmental-quality standards of nitrogen dioxides, the Envi-ronment Agency came out with the Medium-Term Prospect on Mea-sures to Cope with Nitrogen Oxides and has stepped up those measures in an all-round manner with the cooperation of related ministries, agencies, local governments and other organizations. As we have seen in Chapter 1, the environmental density worsened primarily in major urban areas both in 1986 and 1987, thereby increasing the number of monitor-ing stations which were unable to achieve the environmental-quality standards.
On the other hand, according to the New Medium-Term prospect on Measures to Cope with Nitrogen Oxides prepared by the Environ-ment Agency in December, improvements in the density may be more or less expected, judging at least from the result projected on the exhaust of nitrogen oxides in three areas subject to total area-wide pollutant load controls till 1993. Only with conventional measures, it is estimated, in particular, that it would be difficult to achieve the environmental-quality standards at all automobile exhaust gas monitoring stations as a whole with the exception of some of them
Cited as the reasons in the Medium-Term Prosoect are, among others, (1) As the trips of automobiles--ordinary diesel-engine trucks, in particular--have increased, it is difficult to reduce the exhaust gas volume of automobiles as a whole even if the volume of exhaust gas from each automobile may be decreased with controls on it, and (2) as those districts are among the world's most congested are the trips made by automoliles are inevitably concentrated.
When the exhaust of nitrogen oxide is estimated by source of origin for Tokyo's special wards and other area Yokohama City and other areas, and Osaka City and other areas, where total area-wide
Fig. 15 Effluence In Areas with Total Area-wide Pollutant Load Controls on Nitrogen Dioxides by Source of Origin
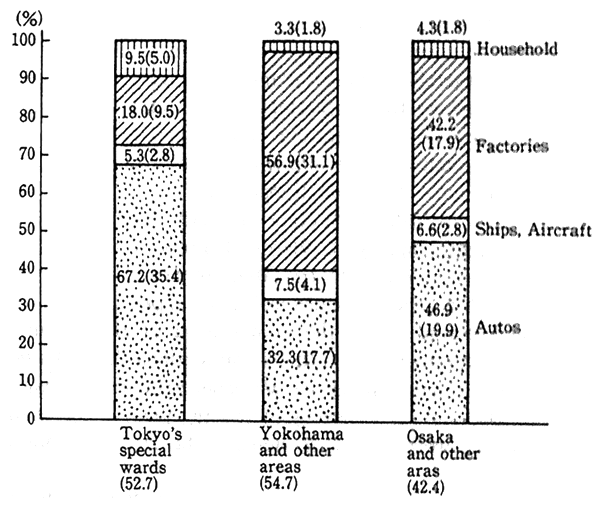
Remarks:1. Estimated by the Environment Agency.
2. Figures in brackets represent the volume of NOXemission (in thousand tons/year). pollution load controls are exercised over nitrogen oxides, the rate of exhaust from automobiles stood at 67%, 32% and 47%, respectively, in 1985, indicating that those areas have big shares (Fig. 15).
(2) Actual State of Urban Traffic
a. Increasing Use of Automobiles
Means of transport are used for the movement of people and goods in the cities. There are signs of a rise in the number of means of transport. As indicated in Fig. 16, person-trip surveys conducted in major cities show that the rate of automobiles used for trips by persons is on the rise in each city sphere.
As regards the movement of goods, the latest Survey on the Flow of Goods in Urban Spheres (the 2nd Survey on the Flow of Goods in the Chukyo Urban Sphere [1986]) indicated that the share of automobiles was higher than 10 years ago (Fig. 17).
Fig. 16 Comparison Between 1st and 2nd Person Trip Surveys in Each Urban Sphere
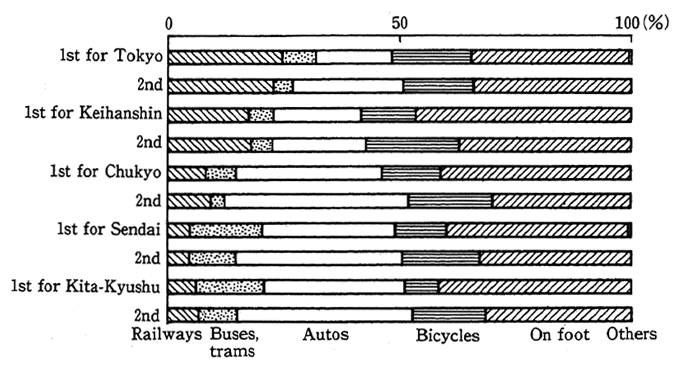
Remarks: Surveyed by the Ministry of Construction
Figs 17 Changes in Composition of Means of Transport
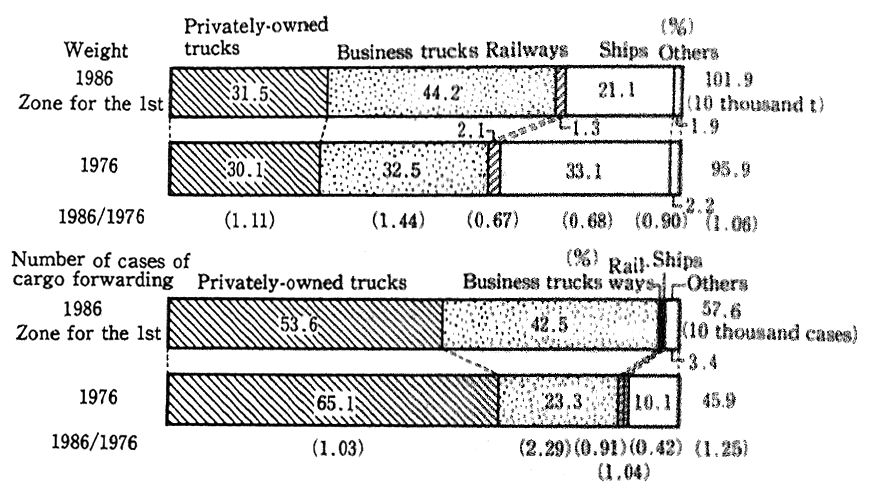
Remarks: Based on "the 2nd Survey Report on Flows of Commoditles in Chukyo Urban Sphere" by the Comprehensive City Traffic Planning Council for the Chukyo Urban Sphere
b. Small-Volume and high-Frequency Transport of Cargoes by Automobiles
Though the share of automobiles In the transport of goods is on the upturn, the tonnage of goods transported by automobiles has not increased so much year by year.
The average annual rise in the tonnage of transport from 1976 to 1986 was 1.3%.
In terms of ton-kilometers, on the other hand, the average annual rise stood at 5.0% in the same period, suggesting that there was a significant increase in the transport distance. This is presumably tied in with the fact that there has been progress in the small-volunme and high-frequency transport of cargoes and in the lengthening of transport distances.
According to the aforementioned Survey on the Flow of Goods in the Chukyo Urban Sphere, for example, the number of trucks in use increased 1.37 times and that of trucks dispatched for trips rose by 1.20 times than 10 years ago, whereas the average weight of cargoes loaded per trip decreased to 0.95 times and that of cargoee in wholesale droppeds to 0.87 times, suggesting the tendency in which cargoes were transport-ed in small quantities but at frequent times. The average transport kilometers per ton of cargo in automobile transport significantly rose from 22.1 km in 1965 to 29.5 km in 1975 and further to 43.5 km in 1986.
(3) Background for Rise in Automobile Transport
a. Growing Service Industry, Changes in Lifestyle and Truck Transport
Against the background of small-volume and high-frequency cargo transport and longer-distance cargo transport, are the sophistica-tion of the industrial structure, the growing service industry and changes in lifestyle.
As regards trucked items, the trucking of iron and steel, cement, lumber, volatile oil and materials for industrial activities has decreased in terms of transport tonnage, whereas that of vegetables, fruits, marine products, daily necessities and other consumer-related livelihood goods has increased. The number of goods transported in an express home-delivery service system has risen by nearly six times in the last five years. In 1987, it exceeded 760 million pieces (Fig. 18).
Classified by item for trucking, the items for which the trucking distance in kilometers was long in 1986 (the figures in brackets repre-sent the year 1976) were assorted goods with 272 km (217 km), marine products with 90 km (72 km) and daily necessaries with 89 km (65 km), suggesting the tendency in which livelihood goods are generally trucked at long distances, longer than 10 years ago.
Thus, it is evident that the trucking of livelihood goods has significantly increased and that they are supplied to cities from increas-ing distant places.
In the cities, on the hand, improvements in services to consumers and changes in lifestyle have resulted in increasing automobile traffic at unexpected places.
For example, the trucking of goods in an express homedelivery service system has rapidly increased, and in this conjunction, the inter-city trips made by large trucks and the inner-city trips made by delivery vans are on the upturn. Besides, there seems to be a rise in the number of cases in which delivery goods are taken back or redelivered due to an increase in the number of families where nobody stays at home during the daytime with an increasing number of women having jobs.
In conjunction with a rise in the number of families in which only one individual lives without his or her other family members and with increasing nighttime activities, the number of around-the-clock conve-nience stores is on the upswing. Those stores do not have space for storage and goods are sent in by delivery van when their stock has dwindled. In recent years, the business hours of department stores and supermarkets have become longer.
Fig. 18 Changes in Number of Small-Quantity Goods Handled
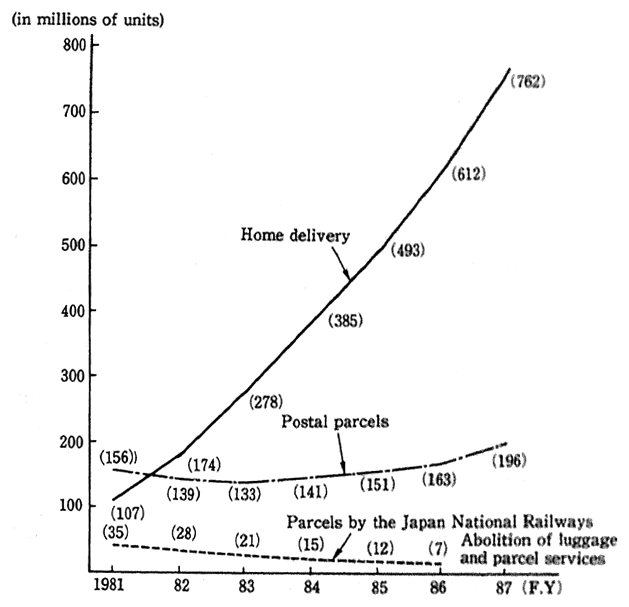
Remarks: Prepared on the basis of the Statistical Annual Report on Mail Statisti-cal Annual Report on Railways and data of the Cargo Distribution Bureau.
Another factor is a rise in the consumer demand of perishables. For example, those items which are good to eat over a period of half a year are sent back because they are not sellable one month after their production.
This is yet another reason why there is a rise in the frequency of trips made by automobiles. In the future, this tendency will rise to a further extent.
b. Development of Business-Purpose Buildings and Automobile Traffic
In the cities, business-purpose buildings and housing, cultural and other facilities are means an inevitable concentration of automobile traffic as people have access to them and goods are moved in and out For construction projects, there is a need to truck discarded materials, building materials and earth, among ,others
The Institute for Research Advancement projected (in The Tendency of Demand for Office Space in Tokyo's City Center) the demand for office space in the three wards of Tokyo's city center in 2000 would be up 1.3 or 1.6 times from 1985. In response to such a rise in space demand, it is expected that automobile traffic will all the more increase in the future
(4) Density of Urban Automobile Traffic
An attempt has been made to look into the background of a rise in the trips made by automobile from the standpoint of the growing service industry and lifestyle changes and the development of business spurpose buildings. Next, let us see the density of automobile traffic in major citie. where tho activities are conspicuous.
A check of car-kilometrs per square kilometer for 12 hours from the car-kilometers per square kilometer in Tokyo's special wards and 10 cities found in the Road Traffic Census in 1985 reveals that the kilometerage was extremely large in Osaka and Tokyo's special wards which were follow by Nagoya Yokohama and kawasaki. In Osaka and Tokyo's special wards, the figures were 25-30 times as big as the national mean and roughly 10 times as big as the density of Hiroshima and Sapporo (Fig. 19).
In a comparison with the 1980 Road Traffic Census,the density was high both for the national average and rise in Yokohama, Hiroshima, Fukuoka and Sapporo were high (Fig. 19).
The highly dense use of automobiles serves to reduce the trip speeds of automobiles in the cities, and a check of peak-hour trip speeds on expressways, general national highways and prefectural roads in the 1985 Road Traffic Census indicates that the speed was 17.7 km/hour in Tokyo's special wards and Kawasaki and 19.8 km/hour in Osaka, about half of the national mean (35.9 km/hour).
As we have thus far seen, it is expected that there will be a rise in the number of factors which give rise to trips by automobiles, such as the growing service industry, lifestyle changes and the development of business purpose buildings.
Fig.19 Twelve-Hour Trip Kilometers per Square Kilometer in Major Cities
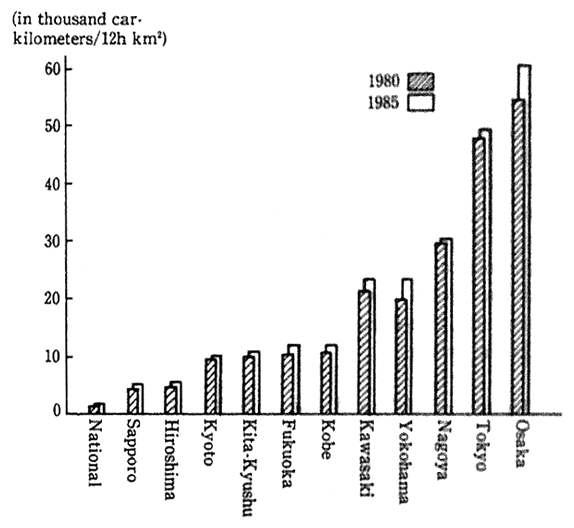
Remarks Prepared from the Road Traffic Census, 1980,1985
Given this situation, it is necessary to rectify the mono-polar concentration of urban functions, to disperse traffic flow and make it smooth, and at the same time to energetically step up measures to cope with automobile traffic with an adjustment of measures on physical distribution and person-trips, besides the strengthening of controls on exhaust gas per automobile, in order that the total discharge of nitrogen oxides may be reduced in the major urban areas
The time has come for a feasibility study on measures to curb the total discharge of exhaust gas from automobiles a study on the implementation and effects of various measures associated with restric-tions over the trips of automobiles into Tokyo's heart, and a study on economic policy measures to lead to curbs on the use of diesel-engine automobiles.
4.Circulation of Matter and Refuse in the Cities
(1) Human Activities and Refuse in the Cities
Due to the technological revolution, the activation and sophistica-tion of the economic performance and other factors, refuse in Japan has quantitatively increased and qualitatively diversified in the postwar years. A check of the discharge of garbage by scale of city suggests that the larger the scale of the city, the greater the discharge per person partly because of contributions from general refuse among business establishments (Fig. 20). Besides, refuse has qualitatively diversified, and it is now an important task to cope with it.
Here, let us see correlations between refuse and the diversifica-tion of consumption, informatization and increasingly brisk construc-tion activities, among others.
Fig. 20 Trash Emission Rate and Incineration Rate by Scale of City
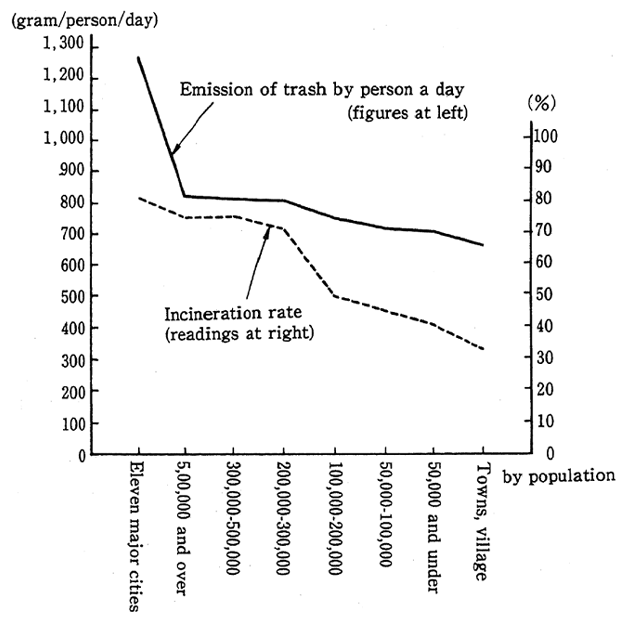
Remarks: Based on "the Statistical Data from Fact-Finding Survey on Waste Disposal" by the National Urban Cleaning Congress.
a. Diversification of Consumption and Refuse
Reflecting the expansion and diversification of the consumer performance, the technological revolution and other factors, refuse has diversified and some of it is difficult to dispose of in a reasonable manner.
A survey on local government and administrative-work associa-tions across the nation suggests that the kinds of refuse which are difficult to dispose of in a reasonahle manner--though they vary, depending on the local government--are as follows: tires,pesticides automobiles, electric refrigerators, syringes blood transfusion bags and televisions, among others, to say nothing of dry batteries which are most difficult to dispose of. As causative factors, the difficulty of crushing and the generation of harmful matter among others, may be cited. Besides, electric refrigerators, electric washing machines, tele visions and other machines may be cited as those kinds of refuse which are difficult to dispose of or recycle, though their has increased to a marked degree in recent years.
The distribution of dry batteries in Japan has incr eased and as many as about 2 billion pieces were used in 1987.On the other hand, the use of mercury in dry batteries as a whole has decreased in the last several years partly because the average content of mercury dry battery has been reduced. The use of mercury in 1987 stood at about 44 tons.
The dissemination of electric refrigerators television and other household electric appliances has increased year by year in terms of percentage and some of them have become larger in size, and discarded. appliances in this category have enlarged in terms of quantity, capacity and weight.
In Japan, there in a growing need for physical distribution small in volume and high in frequency and there has been rise in the use of plastic containers and packing paper in selling products. And this increases the mixing of plastics and paper in the refuse (Fig. 21) This move is also stimulated by consumer services as is discernible from the rapid growth of takeout food stores and fast-food shops.
Furthermore, synthetic-resin bottles have increasingly taken the place of glass and metallic bottles in recent years. Above all, the rise in the use of containers for drinks is conspicuous (Fig. 22).
Fig. 21 Composition of Plastics Paper in Household Trash
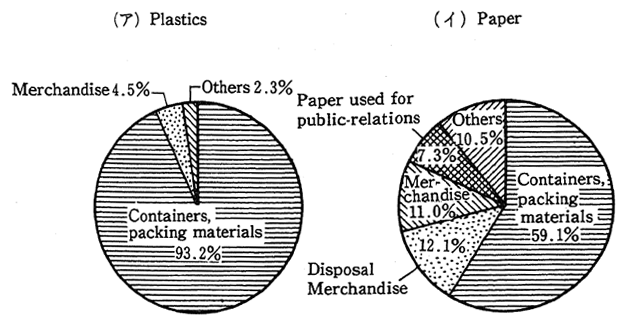
(Kyoto, 1986 FY)
Remarks: Based on the Survey Report on "Composition of Household Trash by Kyoto", 1987
Fig. 22 Changes in Demand of PET Resins for Bottles
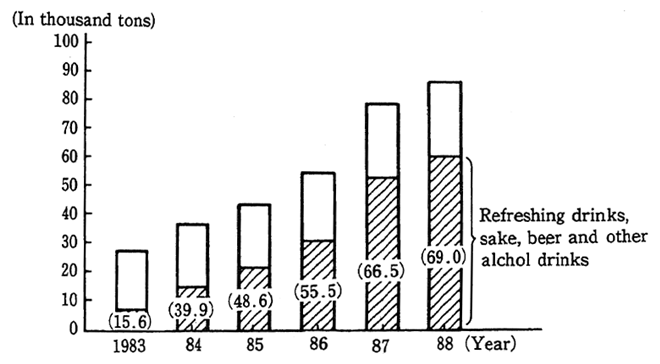
Remarks: 1. Based on data of the PET Bottle Council.
2. Figures in brackets represent percentage.
b. Growing Office Automation (OA) and Refuse
Sustained by technological innovations, there is rapid progress in informatization in Japan. This development comes in the form of a growing evolution of office automation (OA) as a result of the dissemi-nation and sophistication of information equipment.
For example, the number of computers and terminal equipment has significantly increased, by about two times, in the last five years. And the sales of Japanese-language word processors began to increase at a rapid pace in 1985. The growing evolution of office automation (OA) is expected to lead to a decrease in the discharge of refuse with paper put to increasingly less use in the offices, but recently, the use of paper has conversely increased.
Fig. 23 shows that the volume of OA-related paper, such as paper used for printing by computers, which is shipped around in Japan has significantly increased in the last several years. From the results of a survey on the discharge of refuse from principal office buildings in the major cities, the monthly discharge has risen to about 1 kilogram per square meter of floor space.
Fig. 23 Changes in Sales of OA Equipment and Paper
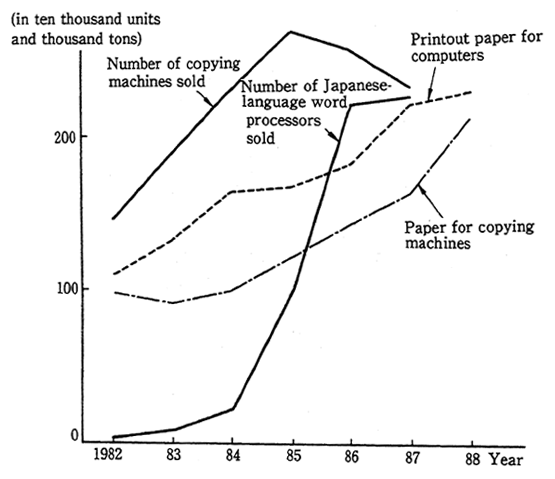
Remarks; Based on the Ministry of International Trade and Industry's "Statistical Annual Report on Machinery Industry" and others
c. Construction Activities and Refuse
Against the background of increased demand for houses and office buildings in the cities, civil-engineering and construction projects have been brisk in recent years. In this conjunction, there has been a rise in the generation of scrap wood in the construction work.
The share of the constuction industry in the discharge of indus-trial waste aross the nation significantly increased from 10.4% in 1980 to 18.4% in 1985. A comparison of the generation of scrap wood as-sociated with the construction work in Tokyo between 1982 and 1986 suggests that scrap asphalt rose by 10%, scrap concrete by 60%, sludge by 30% and mud remnants by 30% (Fig. 24).
Fig. 24 Generation of Disused Wood, Etc. in Tokyo
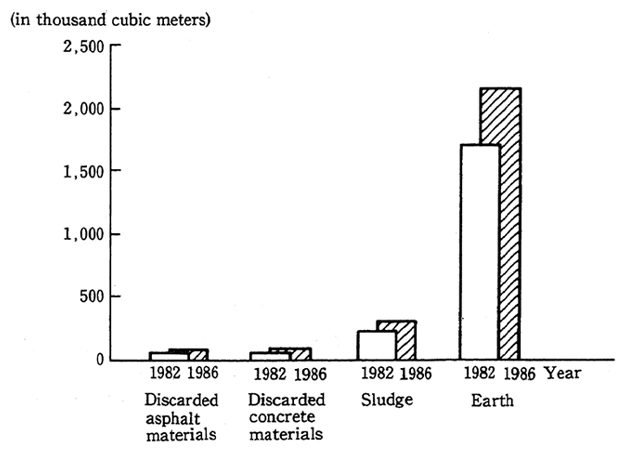
Remarks: Based on "the Fact-finding Survey on Mud Remnants in Construction Projects in 1987" by the City Planning Bureau, Tokyo Metropolitan Government
(2) Waste Disposal and Environmental Issues
Waste is tied to the environment in the wide variety of processes that range from generation to disposal by way of discharge, collection and transportation. Particularly in recent years, waste has quantitatively increased and qualitatively diversified and various ques-tions have arisen.
a. Problems Arising from Waste Disposal
In 1986, 71.8% of all waste was incinerated, and the larger the scale of the city, the higher the incineration rate (Fig. 20). As there has in recent years been apprehension about environmental pollution of the sort in which dioxin generates and trash containing hazardous matter is mixed, the Environment Agency and other government institutions performed a survey on dioxin and mercury both at trash incineration and disposal plants and at final disposal plants in 1984. The results demonstrate that no problematical levels of pollution were observed as things stood, and there is a need to continue paying full heed to the tendency in the future. Besides, there is a danger that the mixing of plastics will raise the amount of heat at the time of incineration, thereby leading to a deterioration of some of the incinerators.
There will presumably be a rise in the demolition of buildings and other structures, and there already arise issues about disposal of scrap materials, both in qualitative and quantitative terms, which come from the demolition sites.
About 70% of asbestos consumed in Japan has been used as the materials of buildings and other structures, and the demolition of buildings and other structures for which asbestos-containing materials are massively used and the disposition of their scrap materials may turn out to be sources for the generation of asbestos. In surveys conducted by the Environment Agency in 1981-83, it was found that the density of asbestos at scrap material disposal plants and their peripheries was higher than in other areas.
Refuse from hospitals and other medical-care centers has also quantitatively increased and qualitatively diversified due to changes in the pattern of medical care, such as the increase in the delivery of medical services, the advancement of medical technology and the propagation of disposal syringes. Apprehension is expressed about infections and other disorders which may arise from such refuse, and their disposal is an issue.
b. Problems on Securing Final Disposal Plants
Moreover, in conjunction with the increase in the volume of waste, the securing of disposal plants necessary for final disposal is an issue. Particularly in major urban areas and their peripheries, it has become extremely difficult to secure final disposal plants. Though the rate of sea reclamation in the Tokyo and Osaka spheres is on the rise, there is a need to pay heed to environmental conservation, especially the water.
Incidentally, Tokyo is reliant on other areas for the disposal of 80% of its industrial waste, and the situation is such that it is not an easy task to secure final disposal plants in the National Capital Sphere.
c. Problems on Management of Sites of Former Disposal Plants
It has become an important problem to manage the sites of former final disposal plants which are expected to increase in the future.
In a questionnaire conducted by the Environment Agency on all prefectures and the administrative-ordinance cities specified under the Water Pollution Control Law indicates that "the reclamation of waste or their elation from reclaimed tracts of land" accounts for 14, or a little more than 20%, of 63 reported cases of soil pollution in built-up urban areas, and this cause constitutes the second largest of all causes, follow-ing damage to facilities and leakage in the disposal process.
The soil pollution of the sites from which industrial plants have been moved is also at issue. At the level of local governments, Yoko-hama City, Tokyo and other governments have enacted a procedure or some other regulation which obligates businesses to check and see if there is soil pollution. Incidentally, the Environmental Pollution Control Service Corporation advances low-interest loans for the implementation of measures, such as the removal of polluted soils.
(3) Recycling of Waste
In order to cope with waste in the cities, there is a need to reduce the weight of waste, such as with a drop in the generation of waste and its recycling, and to strengthen disposal functions with the development of waste disposal facilities. In particular, the recycling of waste is of importance in the sense that circulation of sound matter may be regenerated. Here, let us see how waste is recycled in Japan what problems are posed by it.
a. Present State of Recycling
Waste includes recyclable wastepaper, glass and metals, among others, in large quantities, and waste paper, metals and other goods have been recovered and turned into resources by private resource collectors or in a group collection system. Municipalities are also working for the recovery of resources, such as by sorting and recoverring recyclable trash (Fig. 25).
Fig. 25 Chauges in Recycling (Recovery) Rate
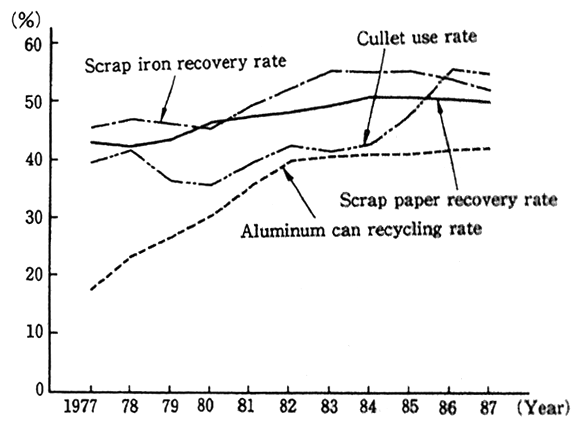
Remarks: Based on data of the Japan Glass Bottles
A survey performed by the Clean Japan Center, a foundation, on local governments shows that the rate of local governments working for some sort of recycling or the other in about 73% for cities and about 48% for towns and villages. The rate of local governments which adopt a group recovery system is about 90% for cities and 74% for towns and villages. In a survey conducted by the health and welfare Ministry, it has been found that the larger the scale of the city, the smaller the recycling rate.
b. Problems on Promotion of Recycling
The problems that crop up in efforts to step up the recycling of waste include changes in the quality of products, the instability of products in terms of quality and quantity, inadequate sorting at the time of discharge, a rise in collection and transportation costs and the insta-bility of markets for recycled resources.
Refrigerators, televisions, washing machines and other household electric appliances have thus far been recovered, discarded and recycled by retailers, local governments and resource collectors. The recycling rate is high for refrigerators, washing machines and other appliances (upwards of 80%) but remains low for some items like televisions (6-9%)
It has now become increasingly difficult to recycle products due to changes in them, such as plastics and glass in lieu of metals, which have been less used as materials in recent years.
On the other hand, there has been a rise in the selling and consumption of disposable bottles and PET bottles, reflecting a diversi-fication of consumer needs and other factors, and this tendency now serves to block the recycling of waste.
Besides, the prices of recycled resources are affected by exchange rates, depending on the item and the marketing tone. For example, the rise in the imports of cheap raw materials due to the strong yen in the recent time is responsible for the fact that the prices of scrap paper hover low, eventually contributing to a mixing of paper in refuse. Now that recycling technology and distribution markets have yet to be established, it is difficult to raise the demand of recycled products even if waste is recovered for use as resources.
5.Open Space in the Cities and Enviroment for Living Things
In the cities and their peripheries, nature has transformed in conjunction with the evolution of industrialization and urbanization. Let us see its transformation.
(1) Conditions of Nature in the Cities
a. Transformation of Nature in City Peripheries
In Japan where agriculture was once the base of the economic society, cities spread primarily in estuaries and littoral plains or basins hemmed in by mountains, and a stable kind of circulation structure is formed between peripheral rural areas and country mountains,among others.
Nonetheless, the rapid evolution of industrialization and the concentration of population in the cities have led to a significant trans-formation of nature not only in the cities but their peripheries. Against the background of the changes brought about in lifestyles by the evolu-tion of the energy revolution and other developments, the utilization of nature, such as the practice of collecting firewood and cogongrass that traditionally continued for so many years has ebbed, and thickets of assorted trees and fields are now used for other purposes.
b. Land Transformation and Decrease of Open Space
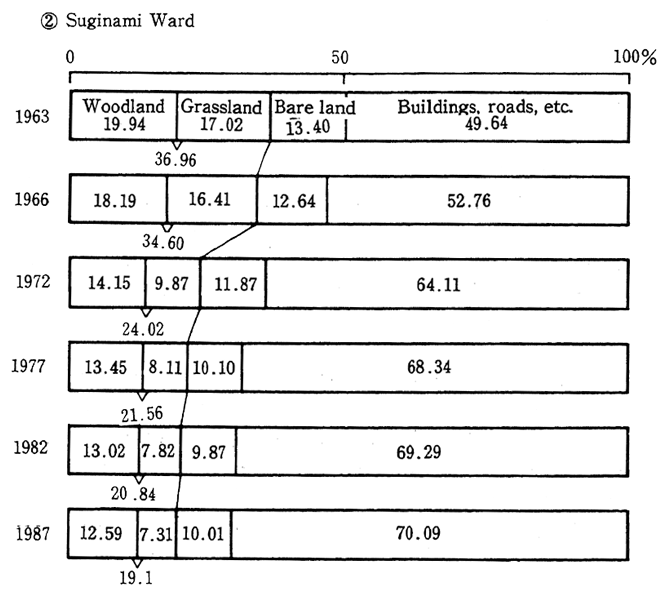
A check of land transformation with a number of cities taken up as examples suggests that forests, grassland and other types of open space have decreased. Instead, there has been an increase in the number of concrete-or asphalt-covered artificial water-impermeable ponds (Fig. 26). There has also been a significant drop in the permeable surface (unpaved land), such as bare land.
The increase in the number of impermeable ponds serves to raise the temperature of cities in a heat island phenomenon and adversely affects their water environment as we have already seen. It also brings about unfavorable results in terms of the habitation of living things, such as soil organisms.
Next, when the decrease of open space is checked, forests for tutelary shrines, windbreaks and thickets of assorted trees on the compounds of countryseats, among others, are maintained in a relative-ly good condition. Then there are rural neighborhoods where huge trees and forests of huge trees are reserved as their symbols, historic legacies and landmarks. Nonetheless, there is a danger that those precious forests, woods and trees will be lost by the disorderly development of housing sites and the construction of golfing grounds, among others, in conjunction with the evolution of urbanization.
Particularly in major urban areas, there is rapid progress in the development of thickets of assorted trees and other afforested areas on the hillocks and slopes which have barely been immune to development.
Among citizens' organizations and local governments, there are some which release land for use by the public, such as Saitama Prefecture which purchases it under the project of the Trust Fund for Open Space and Yokohama City which borrows tracts of land from their landowners for use as the Citizens' Woods. But many of those institu-tions are confronted with the difficulty of acquiring land due to skyrock-eting prices and the burden of the inheritance tax, among others.
Fig. 26 Changes in Land in Yokohama and Suginami ward
Remarks:1. Yokohama's Open-Space Administration Bureau "Fourth Report on Diagnosis of Open-Space Environment"
2. Bare land A: Perpetually bare land
Bare land B: Temporarily bare land
Remarks: Based on "the Survey Report on Natural Environment in Suginami Ward"
Not only the quantity of open space but its type, quality and distribution are also of importance in thinking about nature in the cities.
A check of vegetation in and around Tokyo shows, for example, that there is virtually no space of nature in its heart other than open space for public parks, graveyards and the like. Though it is surrounded by thickets of assorted tress (secondary forests), afforested areas, land under cultivation and other types of land, they are dispersed on the plains and hillocks due to urbanization and other factors. It is also evident that natural forests of certain dimensions exist only in mountain areas far from cities (Fig. 27).
The rate of naturalized plants (foreign plants), which serves as an indicator of the effects of human deeds on nature, for Tokyo is indicated in Fig. 28, and the closer the area is to the urbanized city heart, the higher the rate of naturalization.
c. Farmland in the Cities
Farmland, which is strictly controlled and simplified by man, cannot be described as part of nature in the genuine sense of the word. It forms part of the little green open space which remains in the cities during the time when crops are under cultivation, and fosters underground water. At the same time, paddy fields, among others, contribute to the maintenance of water circulation in the cities as kinds of pools.
Farmland in the built-up urban areas decreased from 202,530 hectares in 1982 by about 13% to 177,058 hectares in 1987. Such tracts of farmland in the built-up urban areas which meet certain conditions are systematically conserved as they are designated as "open-space areas for production" under the Law for Open Space for Production. The areas designated as such measured about 702 hectares across the nation as of the end of 1987.
There are many major cities where the local governments borrow tracts from farming and other families for release to the public as farms for citizens or as squares for children and public parks. The Opinion Poll on Food, Agriculture and Rural Villages conducted by the Prime Minister's Office in 1985 showed that about 60% of the people who were not engaged in farm production were interested in "family farms" (including leased farms), and the Value of farmland in the cities is rising as places for recreation and children's education.
Fig. 27 Vegetation in and around Tokyo
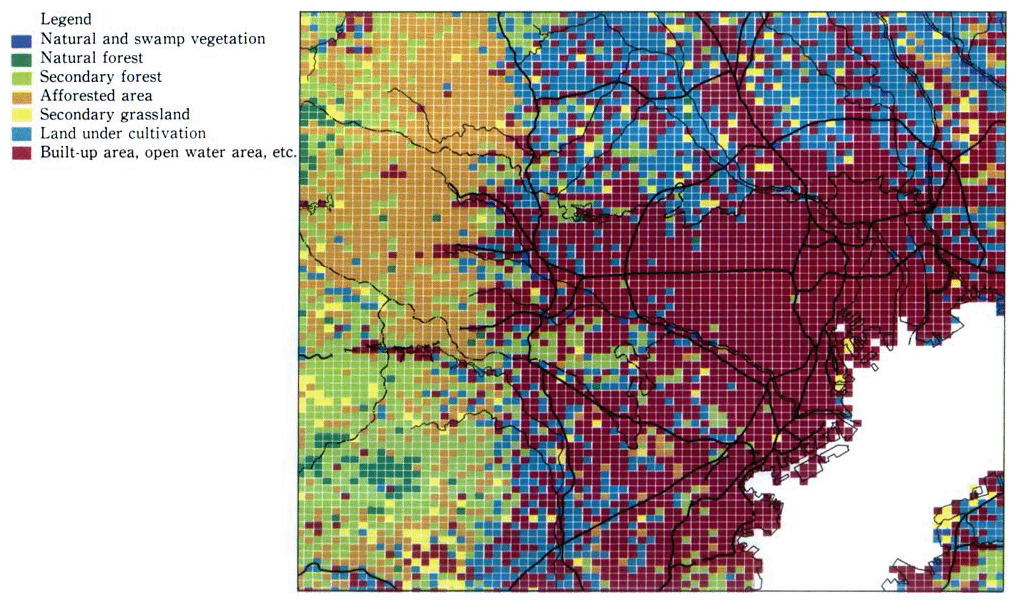
Remarks: 1. Based on "the 3rd Basic Survey on Conservation of Natural Environment" by the Environ-ment Agency.
2. This map indicates the classification of dominant vegetation in meshes of about 1 km2
3. Public parks, graveyards and other types of open space are included in the classification of built-up areas, open water areas, etc.
Fig. 29 Distribution of Familiar Living Things in and around Tokyo
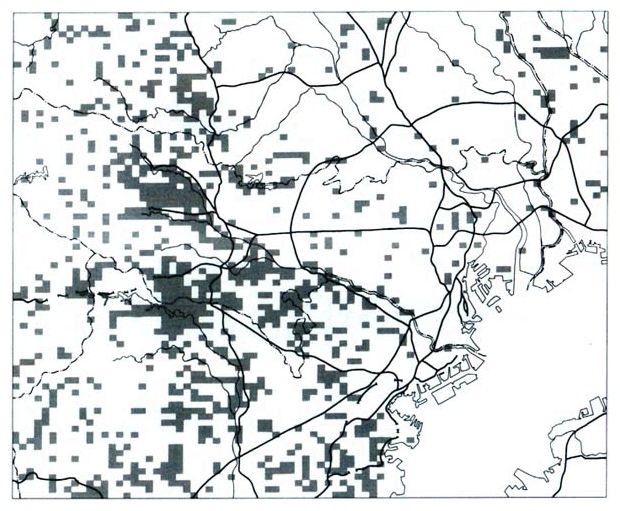
Remarks: 1. Based on "the Survey on Familiar Living Things in the 3rd Basic Survey on Conservation of Natural Environment" by the Environment Agency.
2. In this map, the information is provided by general volunteer surveyors about the distribution of wild rabbits, Japanese squirrels, giant purple butterflies, Onchcorhynchus masou (a kind of trout), singing frogs and swamp frogs among the subject species for the aforementioned survey which inhabit favor-able woodland, grassland and waterside areas, among others.
Fig. 28 Naturalization Rate of Vegetation in Tokyo
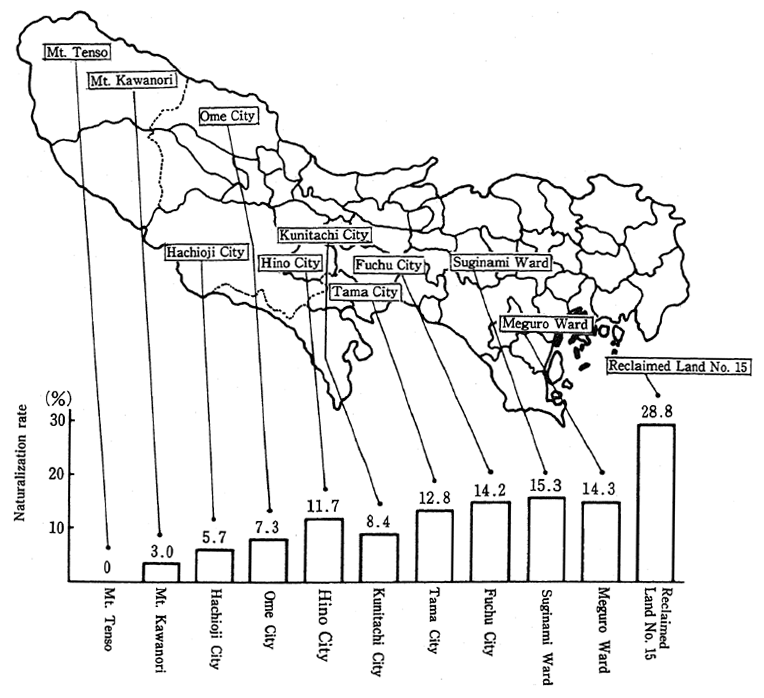
Remarks: 1. Based on the Survey Report on Natural Environment in Suginami ward
2. rate of naturalization=number of species of naturalized plants/number of species of plants
d. Living Things in the Cities
In conjunction with urbanization, there is a change in the distribu-tion of familiar living things.
The areas in which the living things requiring such an environment as afforested area, grassland and waterside recede, on the one hand, and living things of the sort the tolerance of which is high to an artificial environment continue to inhabit and expand their area of influence, with the result that a simplification of the biota is in progress.
Fig. 29 is prepared on the basis of the findings of a survey performed on familiar living things as part of the Environment Agency's Third Basic Survey on the Preservation of the Natural Environment (National Census on Open Space). The survery shows that many of the familiar living things are almost invisible in the heart of Tokyo other than open space large in area. In a comparison with Fig. 27, it is evident that the areas which are formed by thickets of assorted tress and land under cultivation, such as the Tama Hillocks and the Sayama Hillocks are inhabited by familiar living things which are multifarious and get together in groups. It is evident that those areas are of importance for urbanites as places for contact with nature.
Another issue is the loss of tidelands which forms a rich biota with the habitation of benthic organisms, fish and birds. In Tokyo Bay, about 17,200 hectares of tideland and waterside were lost by reclama-tion from 1965 to 1987. This acreage is about 2.5 times as large as the area reclaimed from the second half of the 1860s to 1965.
Due to the conversion of river banks into artificial ones and the loss of shallows and pools, the finny tribe has become poor. Large numbers of ayu (Pleglossus altivelis) and masu salmon (Onchorhyuchus masou) were seen going up the Tama River, which was known as a river for ayu. Nowadays, fewer ayu and no masu salmon go up the river.
(2) Multifarious Values of Open Space in the Cities
Open space is equipped with a wide variety of functions. Many different uses may be found for a single area of open space (Fig. 30).
a. Air Purification
Trees are capable of purifying NO2, SO2 and other air pollutants through respiration and cohesion. According to a survery carried out by Osaka Prefecture, the purification capacity of trees is indicated in Fig. 31 by kind of tree. For example, ginkgos (with leaf production at about 5 kg) with a diameter of 15 cm at the breast height may be able to absorb 212 mg of SO2 and 846 mg of NO2 in a day, respectively.
Fig. 30 Functions Possessed by Greenery
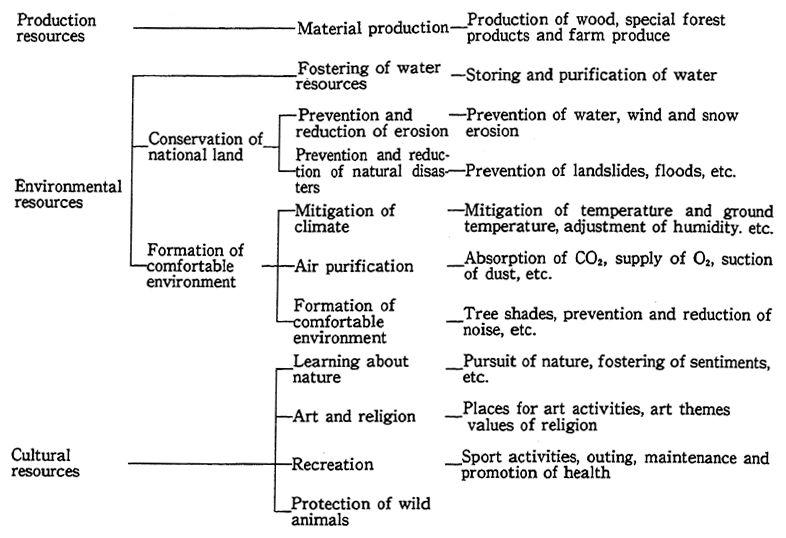
Remarks: Based on "Thinking About Coexistence With Green" compiled by the Resources Survey council, Agency of Science and Technology
Table 31 Air Purification Capacity by Kind of Tree Remarks: 1. Data of the Osaka Prefectural Government
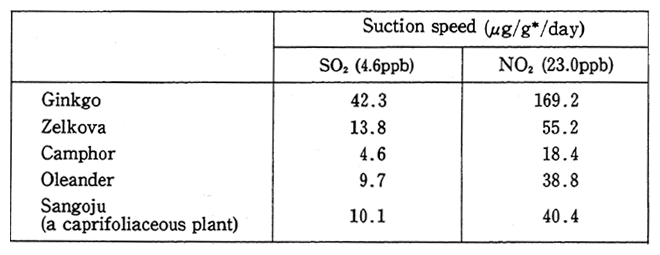
2. g* : dry weight
Computed from comparative area in May-November
The absorption of NO2 by ginkgos along the 3-kilometer-long Mido Avenue in Osaka City on which 65,000 automobiles run a day and the NO2 density is at 0.032 ppm in average August, 4.5% of the whole exhaust volume of NOX from automobiles.
b. Fostering of Groundwater and Water Retaining Capacity of Soils
We have already seen a wide variety of adverse effects brought about by the rise in the number of impermeable lands in the cities. The rainwater permeability of open space is so great that it serves to assure a sound water environment for cities.
c. Mitigation of Climate
As we have seen in 1 and 2 of this Chapter, the range of tempera-ture is narrow in areas with much open space. Trees energetically evaporate and disperse water and consume large amounts of evapora-tion heat to prevent temperature from getting high. With their evapora-tion and dispersion, water is supplied to the air, the humidity raised and drying prevented. Yet another important task for trees is to serve as shade against the direct sunlight and provides man with a sense of comfort.
d. Alleviation of Noise
Trees are effective in alleviating noise by checking the spread of sound. The sources of noise are covered and made invisible by woods and the sounds of a gentle breeze that blows trees produce significant psychological effects.
e. Habitation of Living Things
The existence of wild birds, squirrels, cicadas, dragonflies and other tiny animals provides man's life with comfort and rest. On the other hand, underground soil organisms play an extremely important part in enriching land with the dissolution of the remains of flora and fauna and supplying important nutrients for the growth of plants.
f. Soil Conservation and Disaster Prevention
Open space which is covered by trees and other vegetation plays a more significant role in soil conservation than bare land. In particular, the capacity of preventing soil erosion by woods is great. This is because trees protect the ground surface from being affected by rain-water and at the same time reduces water outflow on the ground surface by encouraging the underground permeation of rainwater. Besides, trees are equipped with many fire-prevention capacitities, such as the diffi-culty of catching fire, the obstruction of radiant heat and the intercep-tion of leaping flames.
g. Amenities
In the Opinion Poll on Town Building and the Development of Waterside and Open Space conducted by the Prime Minister's Office in 1988, the number of cases in which "rich greenery" was cited as an important factor for the building of a comfortable living environment, was the largest of all cases (Fig. 32). Besides, the conservation and creation of open space is of importance for places where urbanites come in contact with nature or places where the leisure orientation of the people who enjoy sports and other recreation in the midst of affluent nature may be satisfied.
Incidentally, the value of forests in Shinto shrines and Buddhist temples, as represented by the woods of tutelary Shinto shrines, is increasing. This is because restrictions have been imposed on the felling of trees and have been off limits for religious reasons from old.
As a result of the conservation of natural vegetation, there is a rich biota. Those trees excel in terms of scenery and provide a great sense of rest. Such magnificent trees serve as urban symbols.
Along with huge trees in the woods of Shinto shrines and Budd-hist temples, the forests on hillocks, cliffs and other slopes play a significant part in terms of scenery.
According to the findings of a questionnaire by the Environment Agency, the availability of nature around one's living environment is considered favorable that there should be an increase in the number of natural playgrounds so that children can have more contact with nature.
As we have seen, urban greenery has a wide variety of values.
As regards the extent to which greenery is desirable for cities from the standpoint of inhabitants' desire for it and the degree of their satisfaction, it has been found from a number of surveys that the desirable ratio of green coverage is 30% or 40%, and the area of open space that should be secured is set at upwards of 30% of that of a built-up urban area in the Green Master Plan (Recommendation of the Central Council on City Planning in 1976) which specified the way greenery and open space should be in the cities.
Fig. 32 Important Elements for Building of Comfortable Environment
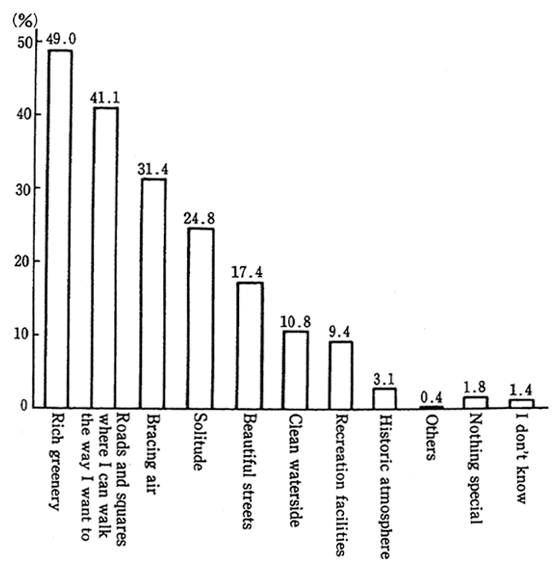
Remarks: Based on "the Opinion Poll on Town Building and the Development of Waterside and Open Spaces" conducted by Prime Minister's Office in 1988
With respect planting in the cities, 13 million high trees are to be replanted between 1987 and 1991 under a five-year afforestation pro-gram for the third series of planting in the cities, and planting is being stepped up with a view to increasing it by about 30% from the end of 1986.
As regards the area of city parks, the standard for the develop-ment of city park is set at 20 m2/person, and it is decided to secure half of this area, or 10 m2/person, by 2000. However, a check of the present state of Japan shows that the area of city parks per person is 5.1 m2(as of the end of 1986), far lower than those of foreign countries, and there is a need to continue the development.
Along with the development of open space, it is necessary that efforts should be made for the conservation and utilization of remaining natural forests, such as thickets of assorted trees, forests in tutelary Shinto shrines and slopes, important as places where many familiar living things are observed.
Chapter3. Attempts to Regenerate Circulation of Ecosystem in the Cities
In recent years, administrative institutions and citizens have carried out a wide variety of activities for conservation of the environ-ment, such as the establishment of urban systems, to regenerate the circulation of the ecosystem in the cities. In Chapter 3, let us see the tendency of those moves.
1. Attempts from Urban Systems
When the city is taken as a system, it restores the circulation of an independent and stable ecosystem and forms a favorable urban environment to use in a cycle of circulation of water and goods which sustain urban activity, to introduce a system under which energy may be efficiently used, to conserve and create nature in the city and to build a system which corresponds to the ecosystem.
Systems for the circulation and utilization of water and also for the effective use of energy are being introduced against their respective background factors. Here, an attempt will be made to classify those systems on the basis of their background, including examples in foreign countries.
(1) Traffic Measures
Cities are making a wide variety of attempts to solve all sorts of problems, such as environmental pollution and traffic congestion.
First, let us see restrictions on the hours during which automo-biles may make trips, areas and types of automobiles, among others.
As regards restrictions on trips by large trucks into city centers, for example, a total ban is imposed in Paris, in principle. Restrictions are put in London at night and at the weekend and in Tokyo on roads within Loop 7 from Saturday night to Sunday morning. In Milan, Italy, restrictions are put on trips into the city center by automobiles other than taxis, buses and automobiles with permits from 7 a.m. to 6 p.m. on the weekdays which exclude Saturdays, Sundays and national holidays. In Singapore, fees are collected for passenger cars making trips into the city center during the morning rush hours unless each carries four or more persons.
In the United States, main commuter roads in Washington, D. C. are off limits to automobiles other than passenger cars carrying three or more persons from 6:30 to 9 a.m. and from 4 to 6:30 p.m. In Athens, Greece ; Sao Paulo, Brazil ; and Denver, U.S., restrictions are put on incoming automobiles, depending on the last digit of the number plate.
In West Berlin, a ban was put on trips by automobiles with much exhaust gas, as there was a sudden rise in the density of sulfur oxides (SOX), nitrogen oxides and other air pollutants from the end of January to the beginning of February in 1987.
A "traffic cell system" is used as a means to restrict traffic passing through city centers and residential areas. Under this system, the city center and the residential areas are divided into a number of sections, and ordinary automobiles other than public buses, ambulances and the like cannot make trips directly in the designated areas and are obligated to go into the designated entrances of those areas by way of loop roads reserved for transit traffic. This system was adopted for the first time by Goteborg in Sweden and later adopted by Bremen in Germany, Bologna in Italy and Besancon in France, among others.
Attempts to curb the use of passenger cars under a system where fares are made identical by various means of transit are being done in a number of cities in Europe and North America. In Frankfurt, Ger-many, special traffic signals were installed in October 1988 to instruct drivers to switch off their engines in situations where they would have to stop at major intersections for more than 12 seconds in order to curb air pollution by automobiles.
Besides, the rationalization of cargo deliveries is being stepped up, such as a system of joint trucking and delivery whereby cargoes are jointly gathered and delivered, the development of truck terminals near loop roads and encouragement for a shift from owner trucks to business trucks.
As we have seen in Chapter 2, there will be a rise in the number of factors which give rise to trips by automobiles in the hearts of major cities, such as the growth of the service sector of the economy, changes in lifestyle and the development of buildings for business. Given this tendency, there is a need to step up studies on new measures and try to translate them into action one by one, particularly in major cities, to say the least of a replenishment and reinforcement of the conventional measures.