Quality of the Environment in Japan 1993
b. Achievement of Environmental Quality Standards
A check of the achievement of environmental quality standards concerning noise for the Tokaido and Sanyo Shinkansen Lines and the Tohoku and Joetsu Shinkansen Lines (areas north to Omiya) indicates that there are a considerable number of areas where the environmental quality standards are not achieved Given this situation, the Environment Agency required related institutions to further promote measures, such as the reduction of noise levels to less than 75 dB, in areas very much densely populated along the Tokaido and Sanyo Shinkansen Line and in "densely populated areas" along the Tohoku and Joetsu Shinkansen Lines (called "areas with the noise level set at less than 75 dB") by the end of fiscal 1990 In fiscal 1991, the Environmental Agency checked the degrees to which the measures based on those requirements had been achieved. The findings showed that the noise levels in the area with the noise level set at less than 75-phon featured a high of 78 4", higher 75 dB, but that the average noise level of all points remained at 73.7 dB. The points where the target of 75 phons had been accomplished accounted for 76% of all points (Table 6-4-6). The Environment Agency required related institutions to take necessary measures to attain the target level of 75 phons, to maintain the Environmental Quality Standards where achieved, and to expand "75 phons areas" and take measures to achieve the target level of 75 phons in expanded areas.
As regards vibration, a check of the degrees to which the guide- line value (70 dB) based on the aforementioned requirement of the Director-general of the Environmental Agency was achieved, revealed that the guideline value was met in most areas, minus some areas closer to the railway tracks, along the Tokaido and Sanyo Shinkansen Lines after the revision of the train schedules in November 1986, and that the guideline value (70 dB) was met at all points along the Tohoku and Joetsu Shinkansen Lines.
Table 6-4-6 Noise in areas with "75-phons Mesures" Taken
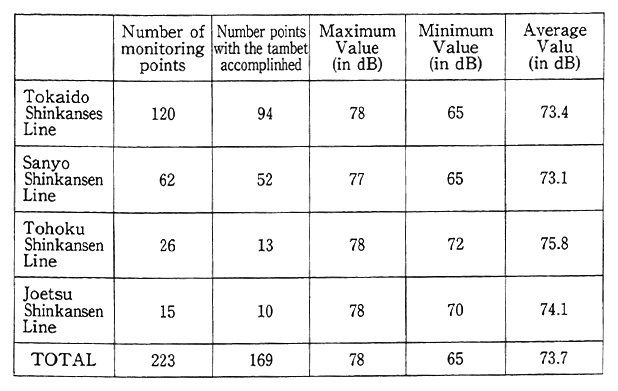
Note : 1. Number of points with the target accomplished Number of monitoring points witrebistered at less than 75 dB.
2. Rate of compliance with 75 dB(%) : Number of points with the target accompli of montoring points×100.
(2) Implementation of Measures
East Japan Railways, Japan Railways Tokai and West Japan Railways have implemented the following measures against noise sources, against vibration sources and for prevention of hazards against daily life:
a. Measures Against Noise and Vibration Sources
* Promotion of comprehensive measures against noise sources, such as strengthening of the maintenance of tracks and cars and the laying of balance mats
* Construction of reversed L-type noise arresting walls, installation of additional noise absorbers, and the deeper shaving/smoothing of rails.
b. Measures for Noise Prevention
The noise insulation works have been subsidized for houses in areas with the noise level in excess of 75 phons and for schools, hospitals in areas where the noise level exceeds 70 phons, and measures are taken for all houses for which the implementation of measures is requested. The insulation works against vibration for houses etc., in areas with the vibration level is excess of 70 dB, have been subsidized and the moves from these areas have been compensated. These measures have been taken for all houses for which these measures are required.
(3) Noise and Vibration of Conventional Railway Trains
Also as regards the so-called conventional railway trains other than the Shinkansen lines, problems are posed, such as complaints and demands about their noise and vibration. In particular, problems have cropped up about noise and vibration as the Tsugaru Strait Line was opened in March 1988 and the Seto Ohashi Line in April of the same year, and a wide variety of measures has been taken to cope with those problems.
6-5 Noise--Present State and Measures
6-5-1 Present state of Noise
Of all various pollutants, noise is most deeply tied in with every- day life, and there are all kinds of sources, so that it produces the greatest number of complaints in every year.
The number of complaints by type of generation source is shown in Fig. 6-5-1.
Fig. 6-5-1 Breakdown of Griavances about Noise
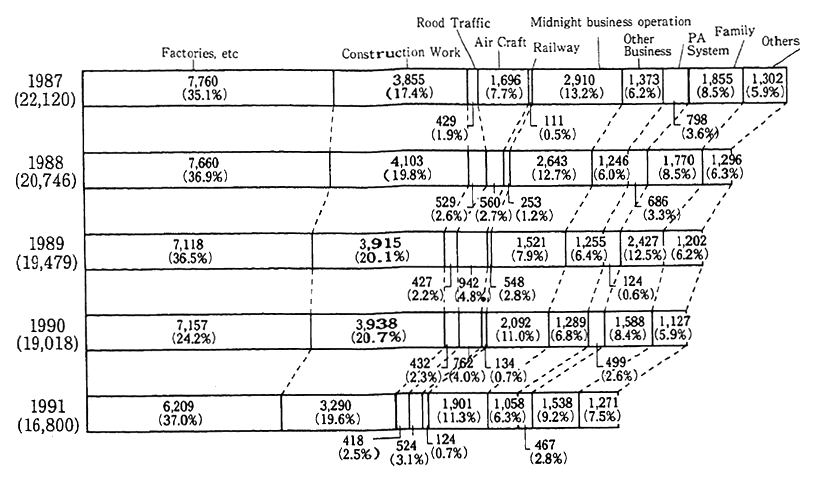
Remarks : 1. Surveyed by the Environixient Agency (which has tabulated grievances filed with local governments)
2. In computing the number of grievences,grievances about one and the same noise source are considered as one grievance,even when a number of grievances have been filed about it.
6-5-2 Measures Against Noise
(1) Environmental Quality Standards Associated with Noise
Environmental quality standards for noise were formulated on May 25, 1971. Under the standards, the standard values are classified into two sets of values--one for general areas and the other for roadside areas.
For general areas, the standard values are set, depending on the type of area and the classification of time, between "less than 35 dB (A)" during the "nighttime" for "areas for which calmness is particularly required" and "less than 60 dB" during the "daytime" for "areas which include commerce, and industrial uses, with a mix of a considerable number of dwellings." For roadside areas, the standard values are higher than those for general areas, (or 5-10 phons), and are set, depend- ing on the number of lanes and other factors.
Prefectural governors designate areas to which the classification is applied. The designation of areas was made for 596 cities, 857 towns, 102 villages and 23 special wards in 47 prefectures as of the end of fiscal 1991.
(2) Controls Under Noise Regulation Law
Controls under the Noise Regulation Law are those on the noise which is generated by the operation of factories and other types of work sites as well as construction work in areas which are designated by prefectural governors and the mayors of cities designated by the Local Government Law.
The designation of areas was done for 659 cities, 1,213 towns, 178 villages and 23 special wards in 47 prefectures as of the end of fiscal 1991, accounting for about 64% of all municipalities across the nation.
a. Noise of Factories and work sites
Controls exist for factories and work sites where metal fabrica- tion machinery and other facilities specified by Cabinet Order are installed in designated areas (hereinafter referred to as "specified fac- tories"), and the number of specified factories, etc., on which controls were exercised in designated areas stood at 200,442 as of the end of fiscal 1991.
Prefectural governors are empowered to make recommendations for changes in programs and for improvements and issue orders for improvements. There were 9 cases in fiscal 1991 where recommenda- tions for improvement were made. There were 1,274 cases in which administrative guidance was made after the receipt of reports and other inquiries in response to complaints and so forth.
b. Noise from Construction Work
Of all construction work in designated areas, controls are exer- cised on specified construction work, (such as pile driving), which are determined pursuant to Cabinet Order. There were 39,608 cases in fiscal 1991. where reports were filed about the execution of specified construc- tion work.
Prefectural governors are empowered to take measures, such as recommendations or orders for improvements, in relation to noise prevention methods and so on. There were 2 cases in fiscal 1991 where recommendations for improvement was made. There were 679 cases in fiscal 1991. when administrative guidance was made after the receipt of reports and other inquiries in response to complaints and so on.
(3) Neighborhood Noise
In recent years, it has become an important task to cope with neighborhood noise, such as noise from late night business operations, noise caused by loudspeaker announcement, and noise from everyday activities. Currently, controls have been exercised under administrative decrees of local government on noise from late night business operations in 44 Prefectures and noise from caused by loud speaker announcement also in 44 prefectures.
6-6 Vibration--Present State and Measures
6-6-1 Present State of Vibration
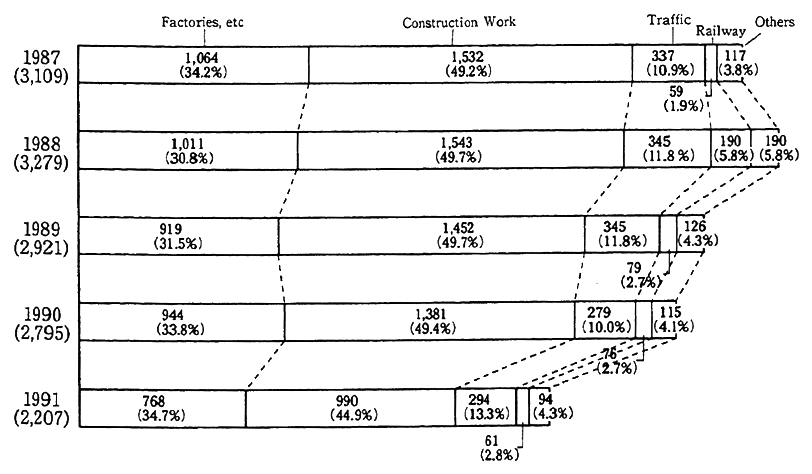
Of all pollutants, vibration is most deeply tied in with everyday life along with noise. The breakdown of, and the fluctuations in, the number of grievances about vibration are given in Fig. 6-6-1.
Fig. 6-6-1 Breakdown of Griavances about Vibration
6-6-2 Measures Against Vibration
(1) Controls Under Vibration Regulation Law
In accordance with the Vibration Regulation Law, prefectural governors and the mayors of cities designated by the Local Government Law are empowered to designate areas and to control vibrations gener- ated in conjunction with the performance of business and construction work at factories and work sites in designated areas, and take measures in response to requests for coping with road traffic vibration.
As of the end of fiscal 1991, vibration control areas were designat- ed in 648 cities, 847 towns, 106 villages and 23 specialwards in 47 prefectures, accounting for about half of all municipalities across the nation.
a. Vibration at Factories and Work Sites
In designated areas, controls are exercised on factories and work sites where metal fabrication machines and other facilities specified in administrative decrees are installed (hereinafter referred to as "speci- fied factories"), and the number of specified factories, etc., as of the end of fiscal 1991 was 113,899.
Prefectural governors (and commissioned mayors of municipal- ities; this also holds true in the subsequent sentences) are empowered to make recommendations for plan changes or to order on methods of vibration abatement and so forth. During fiscal 1990, there were 2 cases where recommendation for improvement was made as measures under the Vibration Regulation Law. There were 230 cases where administra- tive guidance was provided on the prevention of vibration after the collection of reports and other surveys in response to complaints.
b. Vibration by Construction Work
Of all construction in designated areas, controls are exercised specifically on pile driving and other construction work specified by administrative decrees. There were 26,829 cases in which reports were filed about the execution of specified construction work in fiscal 1991.
(2) Measures Against Infrasound
There are more than 30 cases across the nation in which In- frasound which are barely audible by the human ear gives rise to the vibration of glass windows, paper sliding doors (Shoji) and so on (Table 6-6-1).
Table 6-6-1 Breakdown of Grievances about Low-Frequency Vibration
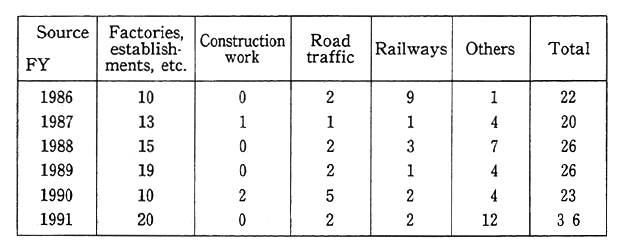
Remarks: 1. Surveyed by the Environment Agency (which han tabulated grievances filed with local governments).
2. In computing the number of grievances, grievances about one and the same vibration source are considered as one, even when a number of grievances have been filed.
From the surveys and research that have been performed, no data have been acquired which demonstrate that the human body is affected by Infrasound of the levels existent in the normal environment.
6-7 Offensive Odors--Present State and Measures
6-7-1 Present State
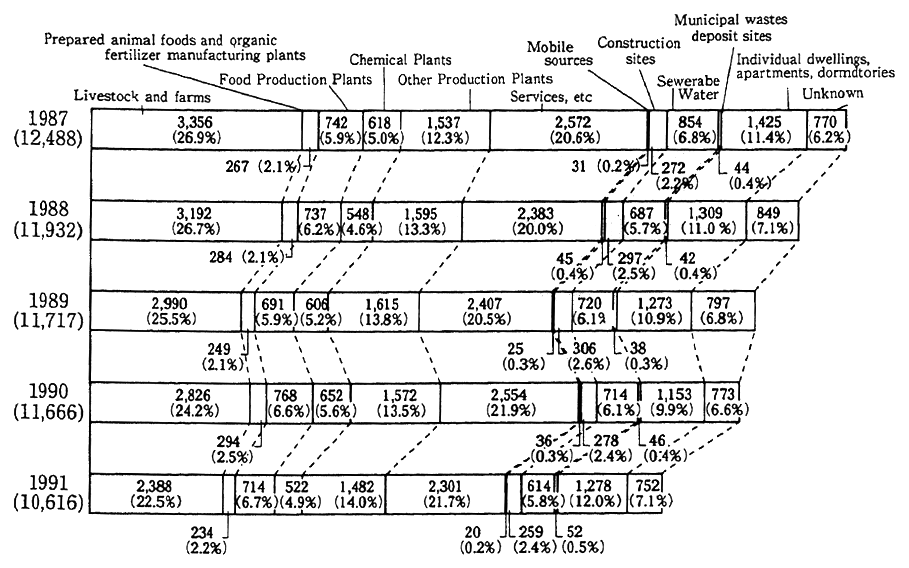
In recent years, there have been signs of a drop in the number of complaints about offensive odors. The number stood at 10,616 in fiscal 1991. By business type, the number was greatest for the livestock industry and agriculture with about 23%, followed by service and other industries with about 22% (Fig. 6-7-1).
Fig. 6-7-1 Breakdown of Grievances about Offensive Obor
6-7-2 Preventative Measures
(1) Enforcement of Offensive Odor Control Law
Under the Offensive Odor Control Law, prefectural governors (and mayors of cities designated by the Local Government Law) desig- nate areas where controls will be exercised on the emission of offensive odor and formulate control standards.
As of the end of fiscal 1991, areas were designated in a total of 1, 555 municipalities, including 582 cities, 836 towns, 114 villages and 23 special wards (accounting for about 48% of all municipalities across the nation) .
Prefectural governors (and commissioned mayors of municipal- ities) are empowered to make recommendations or issue orders for improvements to people who operate business establishments so that they may take measures for the prevention of offensive odors. In fiscal 1991, there were three cases where commendations for improvements were made and there were one cases in which orders for improvements were issued. In addition to the above measures based on the law, there were 5,004 cases in which administrative guidance was provided to odor-generating business establishments in control areas.
(2) Refinement of Measures
Refinement of the following measures is being carried out:
(A) Detection of offensive odor which originates from uncontrolled substances
(B) Improvements in methods for the assessment of odors
(C) Collection of findings on technology for the prevention of odors, technological application to model business establishments and enforce- ment of dissemination projects
(D) Investigation of measures against the generation of Urban Type odors, such as by the service industry
Chapter 7. Water Pollution--Present Situation and Measures
7-1 Water Pollution--Present Situations and Factors
7-1-1 Present Situation
The outline of water pollution based on the findings of surveys on the water quality of public waters across the nation in fiscal 1991 is as follows:
(A) As regards pollutants toxic to human health, the rate of samples which exceed environmental quality standards is exceedingly low. In regard to health related pollutants, such as cadmium, the percentage of in excess of environmental quality standards was 0.02%. For trichlor- oethylene and tetrachloroethylene, the percentage of samples in excess of target values was 0.03% (Table 7-1-1).
Table 7-1-1 Rates of Hazardous Substances Exceeding Environmental Quality Standerds
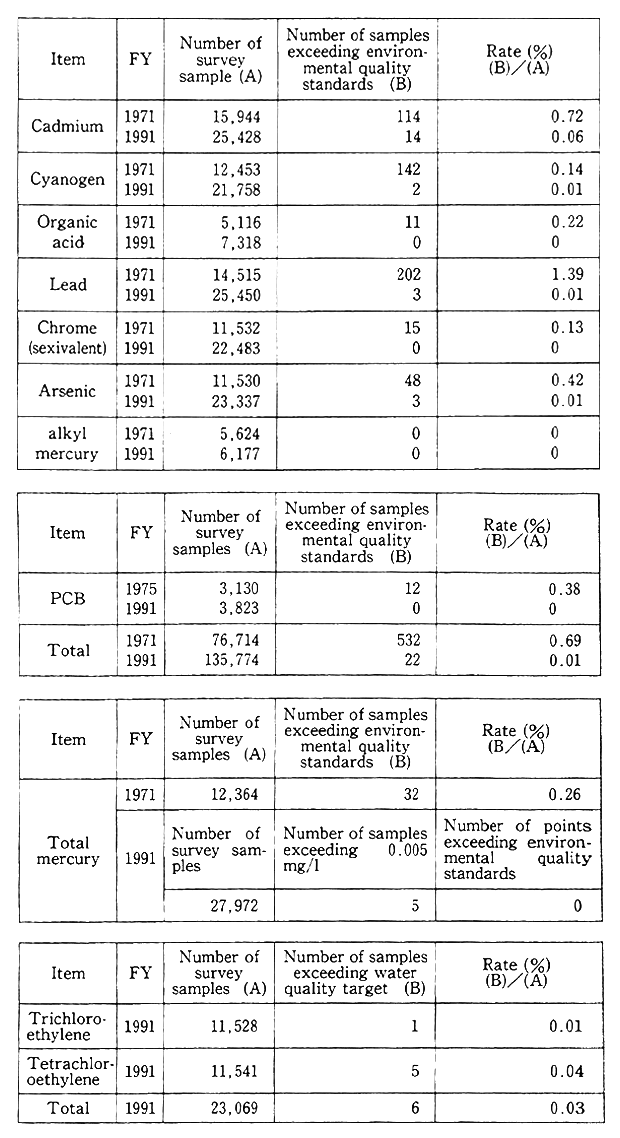
Remarks:1. Surveyed by the Environment Agency.
2. The total for FY1971 does not include PCB.
(B) As regards the water quality associated with conservation of the human living environment, the rate of achieving environmental quality standards was only 75.0% of 3,123 water bodies (including 2,407 rivers, 130 lakes and reservoirs and 586 sea regions), suggesting that about one-fourth of all water bodies did not satisfy environmental quality standards. By type of water body, rivers accounted for 75.4%, lakes and reservoirs 42.3% and sea regions 80.2%, and the achievement rate was low particularly for enclosed water areas, such as lakes and reservoirs, bays, inland seas and so on and medium and small rivers in cities. (Table 7-1-2, Fig. 7-1-1 and Fig. 7-1-2).
Table 7-1-2 Achievement of Environmental Quality Standards
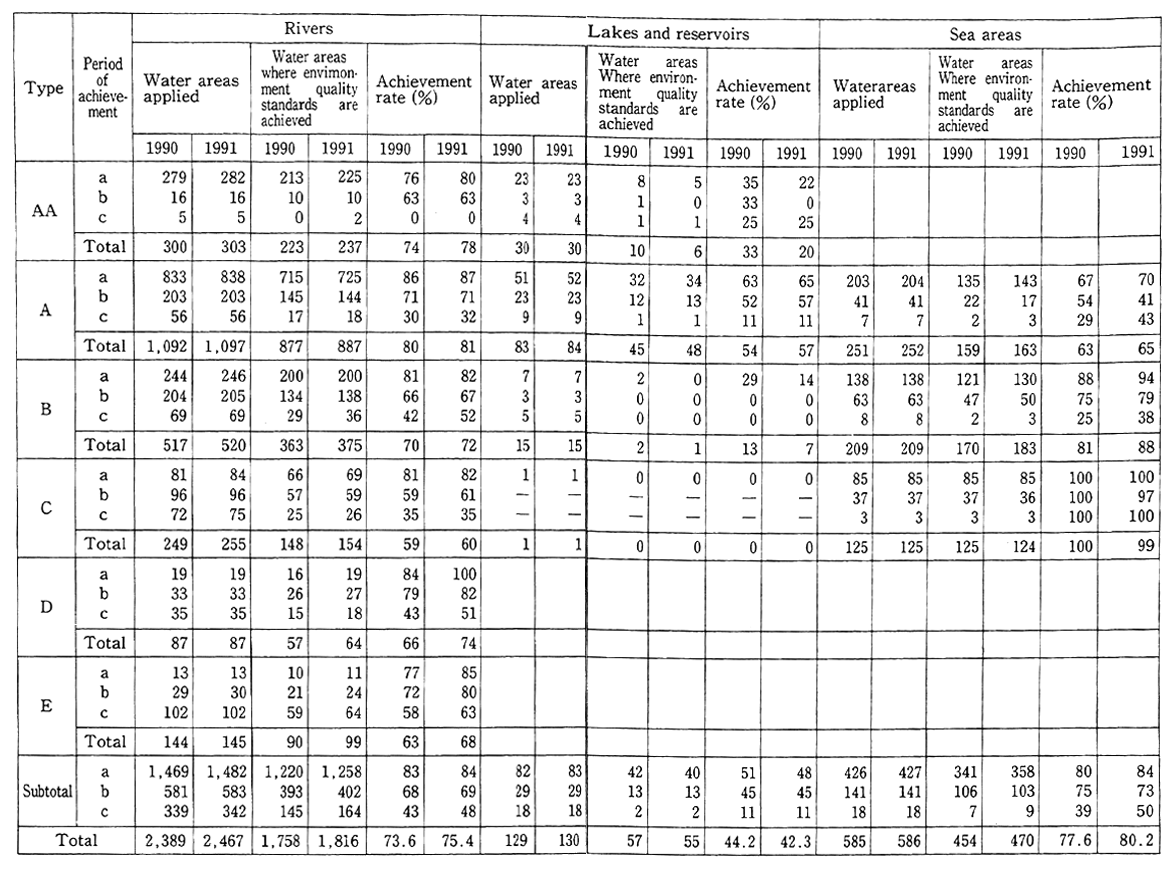
Remarks: Of the water areas to which types were applied, those which were 1990 monitored are tabulated in this table for the FY 1991 survey till FY 1990 fsi the FY survey till FT 1989.
Fig.7-1-1 Pollution of Major Rivers(FY1991)
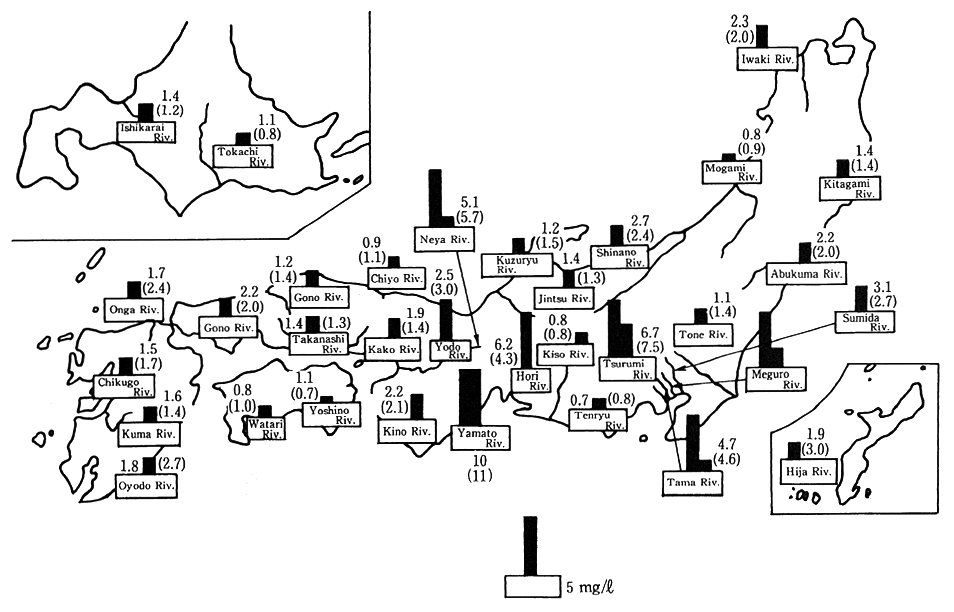
Remarks:1. Surveyed by the Environment Agency.
2. The Figuren are the annual average BOD values.(Unit:mg/l)
3. The figures in parentheses are those monitored in FY 1990.
Fig.7-1-2 Pollution of Major Lakes, Reservoirs and Inner Bays (FY 1991)
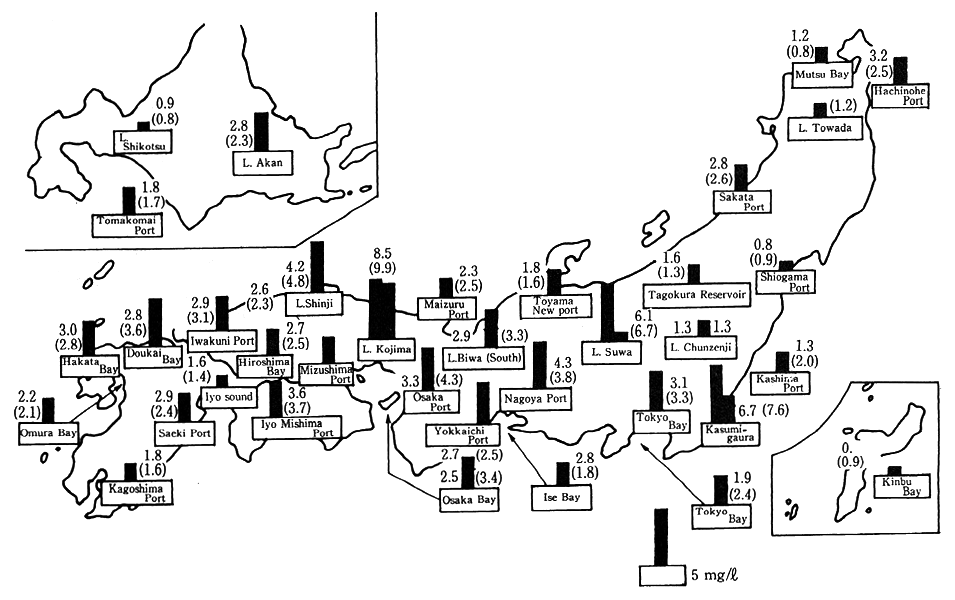
Remarks:1. Surveyed by the Environment Agency.
2. The Figures are the annual average BOD figures(Unit:mg/l).
3. Tte figures in parentheses are those monitored in FY 1990.
(C) As regards other forms of water pollution, pollution by ground water, a wide range of pollution by organic tin compounds, the pollution of public waters by the outflow of hazardous substances due to acci- dents, the long-term pollution of water due to the structure of dams, oxidation due to the natural factors of rivers, lakes and marshes, and the effects brought about on the environment by warm waste water from large-scale power generation plants pose problems.
7-1-2 Factors
There has been a delay in coping with household waste water, such as the fact that sewage systems and so on are not sufficient. On the other hand, improvement is already evident insofar as waste water from factories and business establishments is concerned.
The reason for the pollution of bays, inland seas, lakes and reservoirs and so forth, is due to physical features unique to closed water bodies. Polluted matter tends to accumulate. It is also due to socioeconomic factors, such as the concentration of population and industry in littoral areas. Concerning rivers in cities and lakes and reservoirs in areas where urbanization is in progress, the development of sewage systems does not catch up with increases in population.
There are problems about non-point water pollution where pollut- ants are washed out by rain and so forth from built-up broad urban areas, sites where land is under development, farmland, etc., and water pollution by the discharge of nutrients deposited and accumulated in the bottom.
7-2 Damage by Water Pollution
7-2-1 Pollution of Drinking Water Sources
Of all drinking water sources, surface river and stream water accounts for about 70% and underground source account for about 30%. Drinking water was affected by accidents in which the water sources were affected at 55 places fiscal 1991. Offensive odors caused by the excessive growth of algae affected in 98 water utilities (with an affected total population of about 19,600,000).
The pollution of drinking water sources is coped with, such as by introducing advanced water purification facilities. This turns out to be a heavy burden on water works and becomes a factor for rises in the cost of water purification and processing.
7-2-2 Pollution of Industrial Use Water
Surface river and stream water (of which about half is from industrial use water supplies) accounts for 70% of all industrial water, and there are cases in which industrial water is affected by the pollution of river water. Also in the qualitative treatment of water, there are cases in which problems in treating water arise due to the generation of sludge by river pollutants.
7-2-3 Damage to Agriculture
In recent years, the flow of polluted urban water into agricultural water has given rise to problems that cannot be passed unnoticed in terms of agricultural production, the living environment of rural com- munities and so on.
The present situation of agricultural damage caused by the pollution of agricultural water is indicated in Table 7-2-1. The damage caused by polluted urban water is the greatest, accounting for 84% of the total area of affected farmland. A comparison of the findings of this survey with those of the survey done in fiscal 1985 is as follows:
Number of affected districts Up 10%
Area of affected farmland Down 2.9%
Area where damage is newly About 24,000 hectares
occurred (91% by polluted urban water)
Table 7-2-1 Number and Area of Districts With Agricultural Water Affected by Source of Pollution
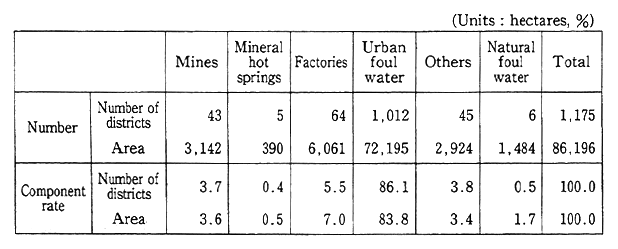
Remarks: Surveyed by the Ministry of Agriculture, Forestry and Fisheries
7-2-4 Damage to Fisheries
The damage caused by water pollution to fisheries take on the following patterns.
(A) The deterioration of fishing grounds and damage to fishing in conjunction with the sedimentation of floatage on the water surface and throwaways.
(B) Extinction of aquatic organisms, growth impotence, etc., due to oil pollution, the generation of red tides, etc.
(C) Unsalability of hauled fish or drops in fish price due to the bioaccumulation, absorption, etc., of heavy metals, PCBs and other toxic pollutants
(D) Staining, erosion, etc., of fishing vessels and gear by oil pollution and so forth
An outline of idiopathic damage to fisheries due to water pollu- tion, etc., in fiscal 1990 is given below:
Number of cases occurred 295 (285 in fiscal 1989)
Damage by oil pollution on the sea surface 48 (71 in fiscal 1989)
Damage by red tides 42 (22 in fiscal 1989)
Damage in value ¥3,321,600,000(¥1,973,000,000 in fiscal 1989)
Damage by oil pollution ¥1,250,000,000(¥737,000,000 in fiscal 1989)
Damage by red tides ¥1,650,000,000(¥819,000,000 in fiscal 1989)
Given the pollution of fish and shellfish, self-controls on fishing were done or dietary guidance was provided as in the past for mercury in nine water regions, one water region for PCB and seven water regions for "drin type" insecticides (as of the end of December 1991).
7-2-5 Other Damage
According to a water survey conducted by the Environment Agency on bathing beaches and so forth (in fiscal 1991), none of the 415 sampled bathing beaches was found to require improvement.
7-3 Measures for Prevention of Water Pollution
7-3-1 Establishment of Environmental Quality Standards
Two sets of environmental quality standards are formulated --one for protection of man's health and the other for conservation of the human living environment. The former set, stipulated for 9 pollut- ants such as cadmium, cyanide, total mercury, and so on, was revised on March 8, 1993 to become 23 pollutants; 9 organochlorine compounds, 4 agricultural chemicals and 2 other items were added and organic phos- phorus was deleted. Basides these revision, new category, which is called "Items for monitoring", inculding 25 items has been set up for better water quality management. In the latter set, environmental quality standards are formulated on BOD, COD and DO for each type of water. As regards lakes and reservoirs, additional environmental qual- ity standards are formulated on total nitrogen and total phosphorus to prevent eutrophication.
Concerning the removal of sediment containing toxic pollutants, provisional removal standards are formulated, respectively, for sedi- ment containing mercury and those containing PCB.
7-3-2 Strengthening of Effluent Controls
(1) Establishment of Additional Effluent Standards
In accordance with the Water Pollution Control Law, nationwide uniform effluent standards were established, but more strict controls have been added to them by all prefectures since 1975.
(2) Expansion of Control Subjects
(A) Expansion of Control Subjects Under Water Pollution Control Law
Immediately after the enactment of the Water Pollution Control Law, about 500 out of 1,100 all industries were set as controlled subjects, but their number was gradually increased. As of the end of fiscal 1991, about 600 of the 1,100 industries or so were controlled.
(B) Expansion in Total Pollutant Load Control Areas
In total pollutant load control areas, a system of "specified facilities in designated areas" was instituted, and on April 1,1991, septic tanks with a capacity of 201-500 persons were controlled.
(C) Addition of Controlled Pollutants
Controls were started on trichloroethylene and tetrachloroeth- ylene as new hazardous substances in October 1989. In July 1991, purification and distilling facilities using those two substances were made controlled subjects.
(3) Investigations of Uncontrolled Items
As regards 1, 1, 1-trichloroethane and other substances, fact finding surveys were done on discharge from factories and other facil- ities, and water surveys on public waters. Surveys and studies were also made to understand the degeneration of the marine environment, such as reduction of transparency. Findings were also gathered on heated waste water.
(4) Measures to Cope With Water Pollution Accidents
The Water Pollution Control Law was partially amended in June 1989 to update its provisions, such as obligating entrepreneurs to take emergency measures in the case of a water pollution accident and file reports with their respective prefectural governors about the measures taken.
7-3-3 Measures Against Household Effluents
Household effluents play a significant role in water pollution. Given this, there is the need to streamline sewage and household effluent treatment facilities and enhance residents' consciousness. For this purpose, the following measures are taken:
* Environment Agency
Formulation of the Guideline for Guidance on the Promotion of Measures to Cope With Household Effluents (1988)
Holding of the Water Environment Forum (annual)
Partial amendment of the Water Pollution Control Law (June 1990)
(A) Clarification of administrative work on measures to cope with household effluents and of the people's obligations
(B) Systematic promotion of measures to cope with household effluents
In accordance with the amended law, priority areas are designated by prefectural governors. As of March 31, 1992, 50 districts and 155 municipalities in 29 prefectures were designated.
* Ministry of Health and Welfare and Ministry of Construction Designation of "Sewage System Promotion Day" (September 10 of each year)
* Environment Agency, Ministry of Health and Welfare and Ministry of Construction Designation of "Septic Tank Day" (October 1 of each year)
7-3-4 Development of Sewage Systems
The development of sewage systems is being promoted under a five-year sewage system development program. The Seventh Five-year Sewage System Development Program was started in 1991 with a total outlay of ¥16,500 billion. The breakdown is shown in Table 7-3-1.
Table 7-3-1 Project Expenditures under 7 th 5-year Sewer System Development Program by Project
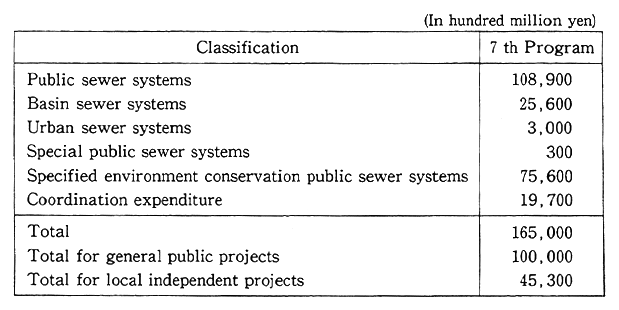
Remarks:Based on data from the Ministry of Construction.
(1) Sewage Construction and Management Projects
An outline of the sewage construction and management projects scheduled for fiscal 1991 is given below:
Total project expenditure: ¥2,387,2 billion (initial)
Execution of public sewage construction and management projects 1,150 places
Execution of basin sewage construction and management projects 106
Execution of urban sewage channel constructi and management projects 411
Execution of specified public sewage construction and management projects 3
Execution of specified public sewage construction and management projects for environmental conservation 297
As a result, the percentage of the population for whom processing is done is expected to come to 45% by the end of fiscal 1991.
(2) Comprehensive Sewage Development Program by Watershed
For the formulation of a comprehensive sewage development program, which would serve as the basic program for the development of sewage systems, a survey had been conducted at 184 places by fiscal 1990. In fiscal 1991, it was performed along the Karino River and one more place. A comprehensive sewage development program by water- shed had been formulated for 73 places by the end of fiscal 1990.
(3) Technical Development, Surveys and Studies, Etc.
To contribute to the effective promotion of sewage development and management projects, surveys were performed on the basic policy for the development and management of sewage systems and rationali- zation and other issues. And the practical use of a new waste water treatment system (bio-focus WT) which uses biotechnology is being promoted.
(4) Japan Sewage Development and Management Project Corporation
The Japan Sewage Development and Management Project Corpo- ration carries out the following projects:
projects for construction of terminal treatment plants, training of sewage technicians, qualification tests on technology, development of technology, tests and studies on sewage systems, surveys for assessment of new technologies, inter-jurisdictional sewage and sludge treatment projects (Ace plans: 3 places in fiscal 1991)
7-3-5 Development of Surveillance and Monitoring Systems
(1) Surveillance of Water in Public Waters
The Environment Agency subsidizes costs for the formulation of monitoring programs for the continuous surveillance of water in public waters by prefectures and administrative ordinance designated cities, costs for surveys on the water quality, the installation of automatic water surveillance and monitoring devices (at 169 places as of the end of fiscal 1992), and the streamlining of water analyzers at local environ- mental pollution research institutes and other organizations. Besides pH and DO, in order to add to the monitoring methods associated with environmental quality standards in relation to COD, studies on auto- matic water surveillance and monitoring devices were performed.
Acting as a river custodian, the Ministry of Construction also monitors the pollution of water in the major water areas of Class I rivers across the nation, promoting the installation of automatic water surveillance and monitoring devices (128 places along 55 water systems as of fiscal 1991) and starting the use of telemeters (112 places) in the concentrated surveillance of water.
Also, the Environment Agency and the Ministry of Construction carried out surveys on the water quality as related to aquatic animals with the involvement of private citizens.
(2) Surveillance on Effluent
In accordance with the Water Pollution Control Law, prefectural governors and the mayors of designated cities require reports from factories and business establishments, perform on-the-spot inspections there and issue orders for improvements, etc. The Environment Agency subsidizes the costs for that purpose and the costs needed for the development of water telemetric systems by local governments.
7-3-6 Purification Measures
(1) Measures for Purification of Rivers, Etc.
The following projects are carried out as projects for the develop- ment of the riparian environment (river purification projects):
Project cost:
¥16,546 million
(¥12,044 million under direct management, ¥4,52O million in subsidization)
Contents of the projects
* Projects to Introduce Treated Water--Treated or clean water is routed from large rivers into low flow polluted rivers, to improve the flow. (used for the Shin-arata River, Uchi River, etc.)
* Direct water treatment projects--Direct treatment of highly polluted river water in a REKIKAN contact and oxidation method and other methods (used for the Edo River, etc.)
* Sludge dredging projects--By dredging the sediments which contain much accumulated organic matter, attempts are made to reduce sources of pollution (used for Kasumigaura, Na- kanoumi, etc.)
(2) Improvements in Flow of Rivers, Etc.
In relation to water utilization and the conservation of the water quality, multipurpose dams and so forth are constructed in attempts to maintain and boost the normal functions of running water. At the same time, the routing of treated water is done in riparian flow adjustmen projects.
Three hundred and thirty five dam construction projects under the jurisdiction of the Ministry of Construction were completed as of fiscal 1991, and an additional 298 projects (including dam projects for measures on the water environment) were conducted in fiscal 1992.
(3) Measures for Purification of Coastal Waters
The following projects were performed as measures for the purification of coastal waters:
(A) Subsidization of fishing ground cleanup projects (58 places) con- ducted by prefectures
(B) Subsidization of rehabilitation projects (41 places), such as the dredging of coastal fishing grounds
(C) Projects for the purification of sea regions, such as the removal of sludge (Fujisawa and three other seacoasts)
(4) Measures for Removal of Sediment Polluted with Mercury and PCB
On the pollution of sediment with mercury (after fiscal 1973), all measures were completed (as of the end of July 1991) for 42 waters which had been in excess of provisional removal standards and had required removal and other measures.
Of 78 waters which had required removal and other measures in relation to the pollution of sediment with PCB (after fiscal 1972), measures had yet to be completed for Sasebo and two other waters as of the end of July 1991.
(5) Purification Measures for Waterways Etc.
There are many areas where it cannot be expected for the time being that sewerage systems and other domestic waste water processing facilities will be constructed even though some of them are situated in the districts designated as the emphasis areas for countermeasures for domestic effluents under the Water Pollution Control Law because water pollution is so conspicuous that they cannot be left as they are. In these areas, the Environment Agency has been carrying out the "Pro- jects for Installation of Purifying Facilities of Waterways Polluted by Domestic Effluents" for polluted waterways and streams to which neither the River Law nor the Sewerage Law is applied.
In fiscal 1992, the projects were carried out in the Metropolis of Tokyo, five prefectures and seven cities and towns (at a combined cost of ¥572 million of which State subsidies amounted to ¥180 million).
In addition, waterway purification projects are being carried out by cities, towns and villages without State involvement in areas outside the emphasis districts.
7-3-7 Water Pollution Control Measures Associated with Agriculture, Forestry and Fisheries
(1) Measures Against Pollution of Agricultural Water
The following projects are under way as measures to conserve the quality of agricultural water:
* Understanding the actual quality of agricultural water, reservoir water and agricultural ground water
* Surveys on the actual quality, causes of pollution and so forth in large-scale agricultural reservoirs
* Surveys for the establishment of methods for improvements in the quality of agricultural water and agricultural waste water
* Agricultural hamlet waste water projects for the development of facilities to treat waste water discharged from agricultural ham- lets (670 districts)
* Projects associated with measures to cope with hazards to the water quality by urgently separating drainage channels and changing sources of water (1 istrict under direct management and 71 in subsidization)
(2) Fisheries-related Pollution Control Measures
The fisheries-related pollution Control measures as follows:
(A) The following types of surveys were broadly conducted:
* Surveys on the impacts and pollution of mercury, PCB, dioxin and other hazardous substances on fish and shellfish
* Surveys on the impacts produced on fisheries by the oxidation of lakes and reservoirs by acid rain, and studies on conservation measures
* Establishment of methods to predict the poisoning of shellfish
* Studies on the impacts produced on fishery resources by the massive discharge of water from power plants
* Studies on quantitative methods to monitor the purification func- tions of lagoons, shallow sea waters and so forth
(B) To prevent the damage caused by the oil pollution of fishing grounds and other types of fishery pollution, surveillance is made on fishing grounds and guidance given to fishermen by fishery pollution survey and guidance officials, and projects for the conservation of fishing grounds are subsidized. Also, the formulation of programs for the disposal of fishery-related waste, such as FRP and other ships of consumer and other organizations was subsidized.
(C) As measures against red tides, surveys were conducted on the generation of plankton (the Seto Inland Sea and so forth), and projects to watch the poisoning of shellfish by red tides were subsidized.
(3) Damage Relief Measures
In order to cope with the oil pollution accidents caused by unidentifiable persons, the relief projects of the Fund for Oil Pollution Damage to Fishing Grounds, a foundation, and other projects were subsidized. Part of the net premiums associated with the Special Clause for Red Tides of Aquaculture insurance.
7-4 Water Conservation Measures for Closed Waters
For bays, inland seas, lakes and reservoirs and other closed waters particularly with significant pollution sources in the hinterland, the rates of achieving environmental quality standards are lower than for other areas, because the loads of pollutants are significant and pollutants tend to accumulate. In addition, the inflow of nitrogen, phosphorus and other chemicals leads to the progress of so called eutrophication. The achievement rates of environmental quality stan- dards for closed waters remain low for Tokyo Bay and Ise Bay and also for Osaka Bay in the Seto Inland Sea. The rates are low particularly for lakes and reservoirs (Fig. 1-1-18 and Fig. 1-1-19 in Chapter 1, Part 1). The average of those rates is 42.3% A check of the generation of red tides indicates that there were 42 cases in Tokyo Bay, 73 cases in Ise Bay and 107 cases in the Seto Inland Sea, and in Tokyo Bay and other bays, the generation of blue tides is observed. There are now a few lakes and reservoirs where the generation of blue-bloom and freshwater red tides is detected. Given this situation, there is the need to further strengthen measures for the conservation of the water quality of closed waters.
7-4-1 Promotion of Areawide Total Pollutant Load Controls
With the Water Pollution Control Law revision of 1978, areawide total water pollutant load controls were institutionalized for overall reduction in the loads of pollutants flowing into waters. This system is enforced for Tokyo Bay, Ise Bay and the Seto Inland Sea with COD taken up as a designated item.
The first series of areawide total pollutant load controls (with the target year set at 1984) and the second series of areawide total pollutant load controls (with the target year set at 1989) were carried out, but it was still necessary to improve the water quality of these waters. Therefore, the third series of areawide total pollutant load controls (with the target year set at 1994) is under way in accordance with the Basic Policy for Areawide Total Pollutant Load Controls (formulated in January 1991) and the Programs for Reductions in Areawide Total Pollutant load Controls (formulated in March 1991) is under way. The details of this series are shown in Fig. 7-4-1 The purpose is to reduce loads for the three waters by 10% (from fiscal 1989) by the target year.
As concrete measures, household effluent measures, such as the promotion of the development of sewage channels and the development of community plants, effluent facilities for agricultural hamlets, com- bined treatment and purification tanks-and so forth, industrial waste water measures, including the strengthening of areawide total pollutant load control standards, such as at factories, and various measures are being implemented in a comprehensive manner.
The procedures for improving water quality of those areas are under study with surveying the enforcement of third series of areawide total pollutant load controls.
Fig. 7-4-1 Generation Loads and Reduction Targets fore 3 Sea Areas with Areawide Total Pollutant Controls by Source
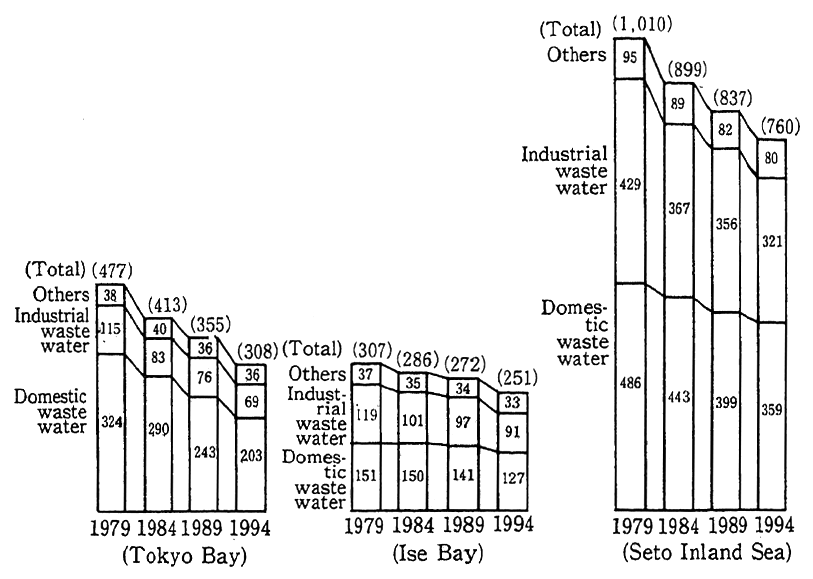
Remarks:Actual figures for FY 1979, 1984 and 1989; reduction target figures for FY 1994. (In tons/day)
7-4-2 Measures for Conservation of Lake and Reservoir Environment
Lakes and reservoirs are closed waters, and they are significantly polluted. For this reason, the lakes and reservoirs for which the mainte- nance of environmental quality standards for water are required are designated in accordance with the Special Measures Law for the Conservation of Lake and Reservoir Water (enacted in 1984 and put into force in March 1985), and programs for the conservation of lake and reservoir water are formulated to promote measures. An outline of the lakes and reservoirs that have up to now been designated is given in Table 7-4-1. For Lake Biwa, Kasumigaura and three other lakes and reservoirs, controls were strengthened in October 1991 to implement measures for reductions in the discharge of nitrogen and phosphorus, and the second Lake and Reservoir Water Conservation program was formulated in March 1992.
Table 7-4-1 Outline of Designated Lakes and Reservoirs
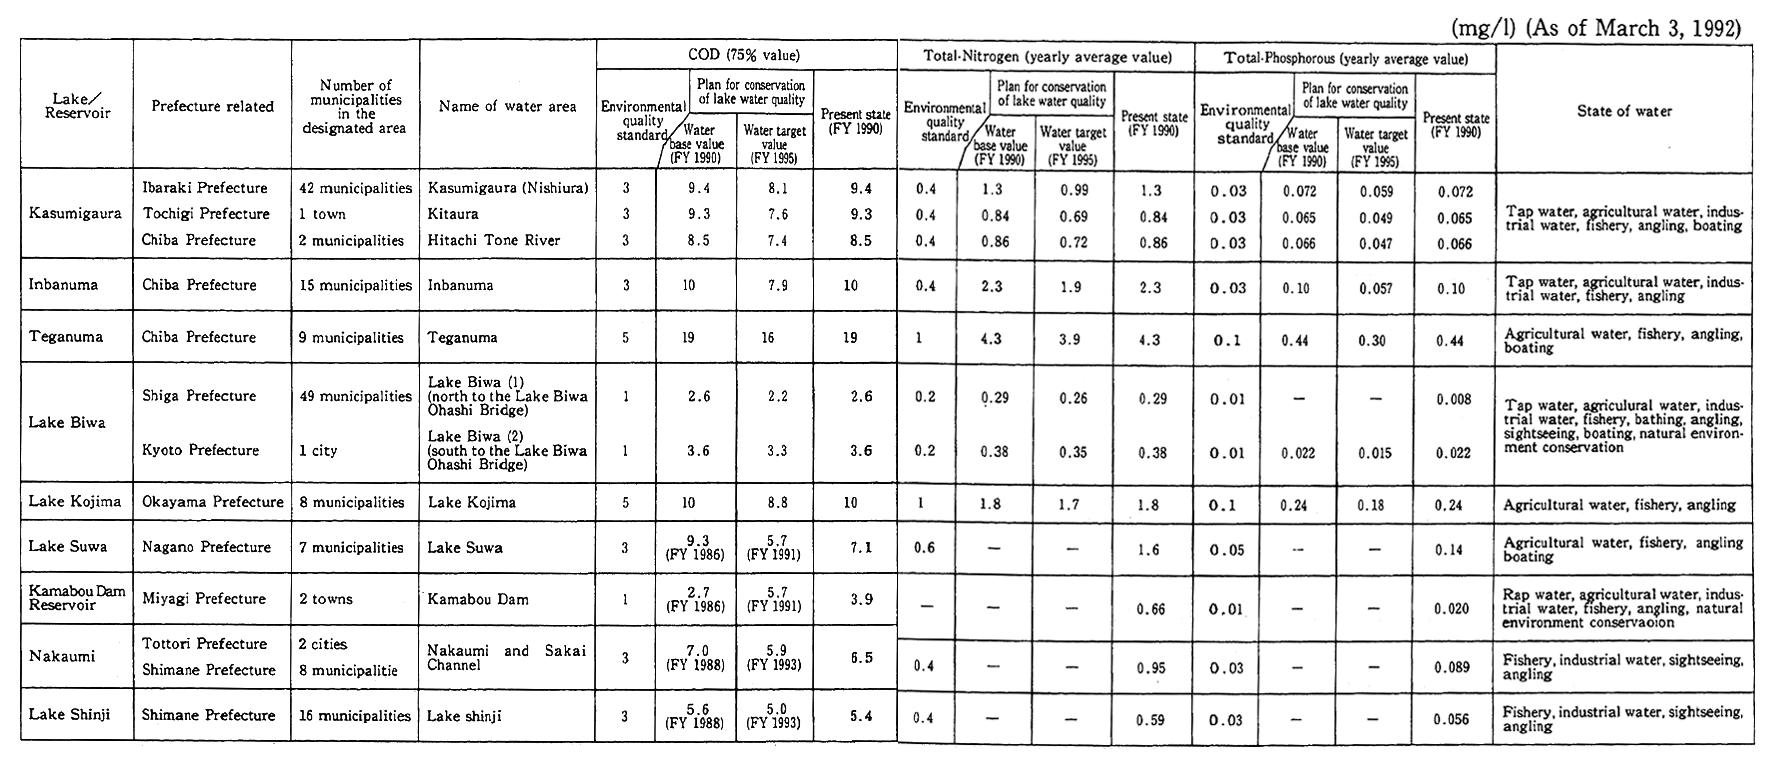
Remarks:1. Surveyed by the Environment Agency.
2. The maximum value in case there are more than one environment quality standfmd point.
7-4-3 Measures Against Eutrophication
In attempts to cope with eutrophication, which is a grave issue for lakes and reservoirs, the following measures are under way:
(A) Establishment of Standards
* In relation to lakes and reservoirs, notice was served on the environmental quality standards associated with nitrogen and phosphorus in 1982.
* Classifications are designated by the State and prefectural gov- ernments, and up to fiscal 1991, a total 48 waters (44 lakes and reservoirs), including Lake Biwa (2 water area), had been designated.
* Environmental quality standards for ocean areas are under study by the Environment Agency.
(B) Strengthening of Controls
Controls on waste water have been under way on nitrogen and phosphorus since July 1985. Effluent controls are in place for phosphorus at 1,066 lakes and reservoirs and for nitrogen at 78 lakes and reservoirs. Also, pollutant load controls exist for nitrogen and phosphorus at Lake Biwa and six other designated lakes and reservoirs. As regards the Seto Inland Sea, guidance is being provided on reductions in the discharge of phosphorus and its compounds in accordance with the Special Measures Law for Conservation of the Seto Inland Sea Environment.
In regard to Tokyo Bay and Ise Bay, measures against eutro- phication have been implemented by related prefectures and cities since 1982. Concerning red tides in the Seto Inland Sea and blue tides in Tokyo Bay, the mechanisms for their occurrence have been surveyed.
7-4-4 Measures for Conservation of the Seto Inland Sea Environment
From old, the Seto Inland Sea had been blessed with scenic spots and had also been a treasure-house of fishery resources, but it has been rapidly polluted since the 1965-74 period. To cope with this development, environmental conservation measures are under way in accordance with the Special Measures Law for Conservation of the Seto Inland Sea Environment.
(1) Environmental Conditions of the Seto Inland Sea
The conditions under which the water of the Seto Inland Sea is placed is as follows:
Achievement of Environmental Quality Standards for COD 78% over all (fiscal 1991). Though considerable improvements are observed, the achievement rates are low for Osaka Bay and other sea regions.
Condition of Red Tides Due to Seto Inland Sea's Eutrophication (See Fig. 2-2-15, Chapter 2, Part 1)
Number of occurrences (1992):
100 cases (confirmed by the Fishery Agency)
Damage:
a total 7 cases in May through December
Cases of Oil Pollution in Oceans
1972 874 cases
1992 132 cases (about 28% of the national total)
(2) Outline of Environmental Conservation Measures Taken Under the Special Measures Law for Conservation of Seto Inland Sea Environment
An outline of the measures taken for the environmental conserva- tion of the Seto Inland Sea is given below:
(A) Promotion of Prefectural Programs
Related prefectural governors formulate measures which are to be taken for conservation of the Seto Inland Sea's environment and carry out a wide variety of environmental conservation measures in accordance with prefectural programs.
(B) Permission for Installation of Specified Facilities
A licensing system is instituted for the installation of specified facilities. The number of cases in which licenses were given for the installation of facilities in fiscal 1991 was 500, and there were 466 cases in which the licenses were changed.
(C) Promotion of Areawide Total Water Pollutant Load Controls
The third series of areawide total water pollutant load controls is under way with the target year set at 1994.
(D) Guidance on Reductions in Phosphorus and Its Compounds
Though guidance had been provided on reductions in phosphorus and its compounds since 1980, guidance continues to be provided on reductions in accordance with the third policy for reductions in phospho- rus and its compounds with the target year set at 1994.
(E) Conservation of Natural Seacoasts For the conservation of natural seacoasts remaining in the related 10 prefectures, an ordinance on natural seacoast preservation areas, and other decrees were enacted, and by the end of December 1992, 90 areas had been designated as natural seacoast conservation areas.
(F) Consideration to Environmental Conservation in Reclamation
In issuing licenses and permits for land reclamation in public waters in the Seto Inland Sea, it is stipulated that related prefectural governors shall give full consideration to the special features of the Seto Inland Sea.
A check of the actual record of licenses and permits for land reclamation, there had been 3,544 cases with a total area of 8,562 hectares from the enactment of the Provisional Measures Law for Conservation of the Seto Inland Sea Environment. Over the period of one year from November 2,1991, there were 112 cases with a total area of 148 hectares.
(G) Implementation of Environmental Conservation Projects
The following projects are under way:
a) In accordance with the seventh Five-year Sewerage Development Program, public sewer systems, water basin sewer systems and speci- fied public sewer systems for environmental conservation have been developed on a priority basis.
b) The development of waste oil disposal facilities where the waste oil of ships is disposed of was under way at 39 places in Seto Inland Sea ports (including 22 places in 16 ports where waste light oil is disposed of) as of October 1992.
c) The Maritime Safety Agency has designated the Seto Inland Sea as a priority sea region for monitoring and control. In fiscal 1992, the agency carried out three "Operations for the Cleaning of the Seto Inland Sea and the Uwa Sea".
d) Water quality surveys have been continuously conducted since 1972. Surveys have also been performed to better understand the mechanisms for the generation of red tides.
e) In fiscal 1992, too, the Environment Agency had the Seto Inland Sea Environment Conservation Association, a foundation, perform projects for the promotion of thought about environmental conserva- tion, such as study and lecture meetings.
7-5 Groundwater Pollution--Present State and Countermeasures
7-5-1 Present Situation of Groundwater Pollution
As a result of fact-finding surveys the Environment Agency performed in fiscal 1982 and 1983, pollution, such as bytrichloroethylene, was observed at many places. A check of the findings of general surveys conducted by local governments on groundwater over the period of five years from fiscal 1984 suggests that concentrations in excess of provi- sional water quality standards were detected in 2.7% with trichloroeyth- lene of about 27,000 wells and in 4.1% with tetrachloroethylene, observ- ing the pollution of groundwater at many places.
Under the Water Pollution Control Law, it was decided to start performing constant surveillance on groundwater in fiscal 1989, and the quality of ground waters is monitored. According to the findings of the monitoring of groundwater in fiscal 1991, general surveys were conduct- ed (groundwater surveys performed to grasp the quality of local water in general) in 1,571-municipalities. The rate of wells in excess of assessment standards was 0.03% for hexivalent chrome, 0.1% for Arsenic, 0.1% for total mercury, 0.4% for trichloroethylene and 1.4% for tetrachloroethylene (Table 7-5-1).
Table 7-5-1 Findings of Survey on General State of Groundwater Pollution.
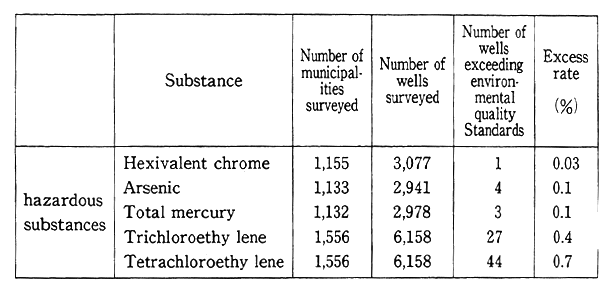
The findings of surveys on areas around polluted wells(ground water surveys carried out to confirm the scope of pollution newly detected in general and other surveys) are outlined below:
Arsenic 2.5% (8/316)
Total mercury 9.8% (9/92)
Trichloroethylene 3.4% (88/2,557)
Tetrachloroethylene 11.3% (301/2,652)
The findings of regular monitoring surveys (surveys conducted as part of continuous monitoring) are as follows:
Cyanide 0.2% (1/444)
Lead 0.4% (2/486)
Arsenic 1.8% (9/508)
Total mercury 2.2% (11/504)
Trichloroethylene 11.2% (289/2,571)
Tetrachloroethylene 21.0% (539/2,564)
In all of those surveys, incidentally, there was no well in which other hazardous substances were in excess of environmental quality standards.
The Environment Agency also carries out fact-finding surveys on groundwater pollution for chemicals other that trichloroethylene and so forth. As a result, it was found in the survey for fiscal 1988 that the pollution of groundwater with dichloroethylene reached the point where there should be concern about it.
7-5-2 Measures Against Groundwater Pollution
Once polluted, groundwater is slow to recover, so that it is important to take preventive measures. From this point of view, attempts are being made to prevent groundwater pollution with a partial revision of the Water Pollution Control Law (with the revision coming into force on October 1,1989). Implemented are such measures as a ban on the underground intrusion of water containing hazardous substances. The controls are outlined in Fig. 7-5-1.
Fig. 7-5-1 Systems of Controls, Etc., under the Revised Water Pollution Control Law (Related to Groundwater)
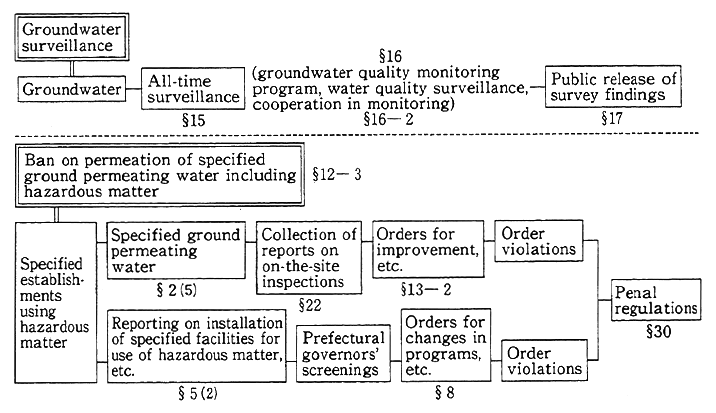
In addition, the Environment Agency established provisional environmental quality standards on carbon tetrachloride (April 1989) to give guidance on curbs on its emission. As regards dichloroethylene, the agency has called on prefectures and administrative ordinance- designated cities to strive to understand the actual conditions of ground- water pollution.
7-6 Marine Pollution--Present State and Countermeasures
7-6-1 Present State of Marine Pollution
(1) Ports and Harbors and Surrounding Seas
Though quality of waters and sediments are on the way toward improvements, there remain many waters which are polluted by effluent from factories, business estabilishments and households. In ports and harbors along Tokyo Bay, Ise Bay, the Seto Inland Sea and so forth and their surrounding waters, the generation of red tides and so on is continuing.
(2) Seas Around Japan
The Environment Agency carries out a survey on marine pollu- tion in the seas around Japan--a survey which is performed along the monitoring line (linking the coast to designated sea-Sea Area A, where dumping of solidified sludge and other pollutants containing heavy metals and others specified under the Law Relating to the Prevention of Marine Pollution and Maritime Disasters are allowed). In addition to general marine observation, the agency also surveys sea water, the concentration of heavy metals in the sediment and so forth.
The Maritime Safety Agency also carries out marine pollution surveys, including oil, PCB, heavy metals and other substances in the sea water and sea bed of the seas around Japan, Sea Area A and major ports and harbors. The findings show that there was no progress in reducing marine pollution.
Surveys on the floating and drifting ashore of waste oil ball are under way. According to the findings of the 1991 survey, the floating waste oil was on the increase in sea regions along the coasts of the Japan Sea and oil drifting-ashore was on the decrease in sea regions along the Pacific coasts.
According to an observation conducted on sea surface floatage from January to December 1991, 65% of surface floatage are styrofoam and other petrochemical products.
Confirmed by the Maritime Safety Agency, the number of cases in which marine pollution was occurred in the seas around Japan is given in Table 7-6-1. A 1991 check of oil pollution by source indicates that the majority (419 cases) was caused by ships. They include 161 due to careless handling and 104 due to deliberate act. Of the cases of non-oil pollution, there were 209 cases which originated on land. Virtually every one of them was caused by deliberate acts.
The Meteorological Agency performs marine background pollu- tion observation in the seas around Japan and in the Western Pacific. The findings are as follows:
* Mercury and cadmium --The same levels of concentrations as in other areas
* Waste oil balls --Remains low levels since 1982
* Pollutants afloat on the sea surf ace --The concentrations were leveling off on the open sea but high on the sea along the southern coast of Honshu Island.
* Oil slicks --Detected several times on the seas around Japan in 1990 and 1991
The Fishery Agency has been surveying the distribution of float- ing pollutants on the entire Pacific. In the 1990 observation, plastics accounted for 55.4% of all detected floating pollutants. The agency concluded that plastics were very densely distributed over the Central Pacific, the seas around Japan and so forth.
Table 7-6-1 Trends in Number of Ascertained Cases of Generation by Polluted Sea Area
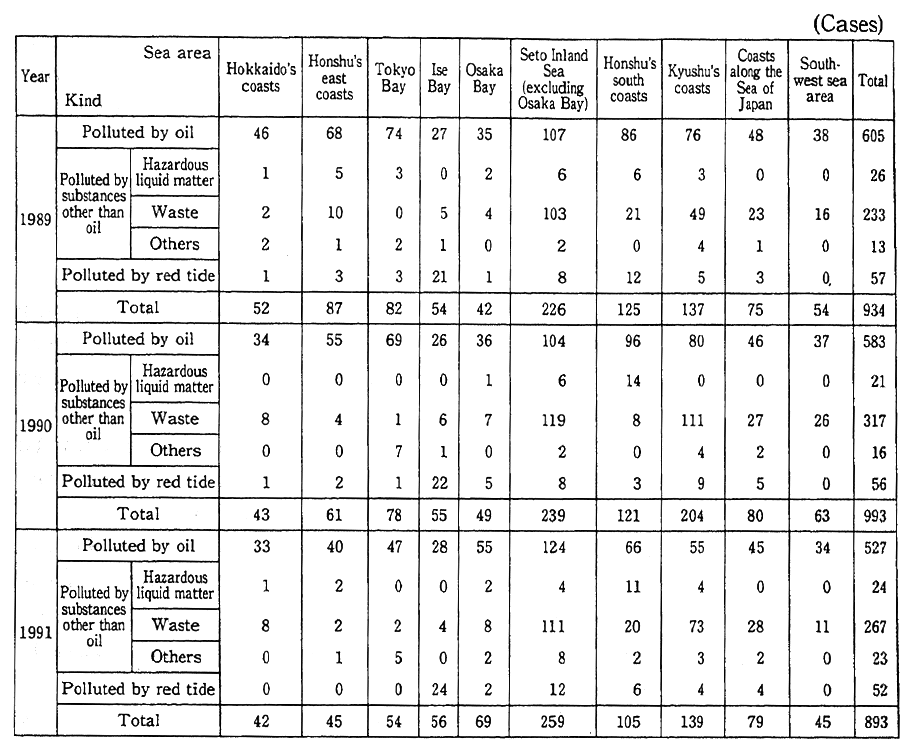
Remarks:Surveyed by the Maritime Safety Agency.
In the category of "polluted by substances other than oil," "others" represent industrial waste water, etc.
7-6-2 Marine Pollution Prevention Measures
(1) Prevention Measures
The following measures are being taken to prevent marine pollution:
a. Controls on Ships
* Controls on the discharge and incineration of oil, hazardous liquid matter and wastes
* Inspections for the assurance of compliance with technical standards on the structure and facilities of ships
* Issue of certificates for marine pollution prevention
b. Rating of Liquid Matter Not Yet Rated
The Environment Agency assesses liquid substances which has yet to be assessed. As of the end of December 1991, 121 substances were assessed and notice was served on them.
c. Guidance on Marine Pollution Prevention
Lecture meetings on marine pollution prevention carried out by the Ministry of Transport and the Maritime Safety and the Week for the Promotion of Marine Pollution Prevention set by the Maritime Safety Agency
d. Development of Waste Oil Treatment Facilities
Improvement of public waste oil treatment facilities for which treatment of waste oil from ships is under way. The outline is as follows:
Waste oil treatment facilities 133 places at 81 ports
Treatment of waste light oil 49 places at 35 ports
(2) Development of Systems for Prevention and Removal of Waste Oil
In order to cope with oil releases and other pollutants, the Maritime Safety Agency carries out the following measures:
* Maintenance of a system of immediate ship response at any time and the development of preventive and removal equipment
* Guidance and development of the Maritime Disaster Prevention Center, which is the core institution in the non-governmental sector for prevention of maritime disasters (removal of emitted oil in eight cases in 1991)
* Guidance and development of the Council on Measures to Cope with Disasters Caused by Released Oil
* Training by the governmental and non-governmental sectors to cope with large scale oil spill accidents
(3) Measures for Purification of Ports and Harbors
Measures for the prevention of pollution at ports and harbors, such as the dredging of organic sludge, were carried out at Tokyo and 13 other ports. Regional seas environment creation projects were on the Seto Inland Sea and another sea region and at three ports.
(4) Research and Development of Technology for Marine Pollution Prevention
A wide variety of techniques for the prevention of marine pollu- tion are being researched and developed, including research and develop- ment by the Ministry of Transport for the prevention of oil spills.
7-6-3 Monitoring and Control of Marine Pollution
(1) Present Situation of Monitoring and Control
The Maritime Safety Agency controls marine pollution in the seas around Japan. In its surveillance and control, priority is given to Tokyo Bay, Ise Bay, the Seto Inland Sea and other regional seas which have tanker routes where the probability is high of pollution being generated.
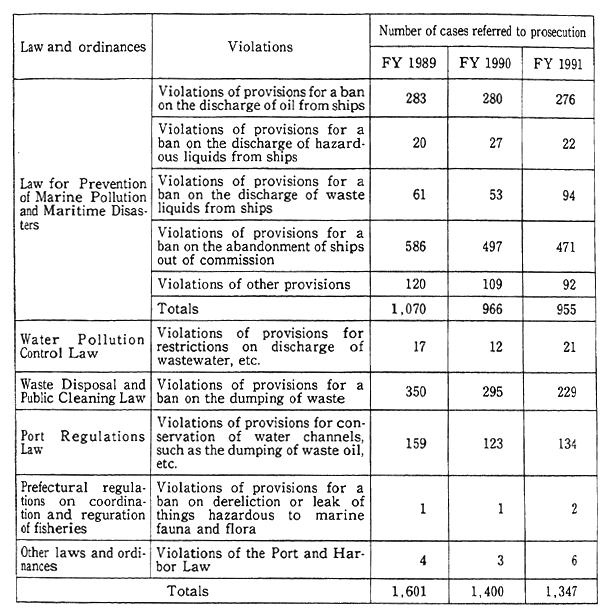
Table 7-6-2 Number of Cases Referred to Prosecution for Violation of Maritime Environmental Pollution-Related Laws and Ordinances
Source:Marine Safety Agency's survey
(2) Referral of Marine Pollution Cases
The cases of violations of the laws and ordinances related to marine pollution are indicated in Table 7-6-2. The number of cases in which oil, toxic liquid substances and waste were discharged stood at 1, 259, accounting for 93% of the total number.
7-6-4 Compensation for Damage Caused by Oil Pollution
In order to provide relief for sufferers, as the damage caused by the oil accidents involving is so enormous in amount, the International Convention on Civil Liabilities for Damage by Oil Pollution and the International Convention for Establishment of an International Fund for Compensation of Damage Caused by Oil Pollution have been estab- lished. In addition, the Law for the Reparation and Compensation of Damage by Oil Pollution was enacted, under which (1) ship owners are assigned with no-fault liability for compensation, (2) limits to specially responsible amounts are set, (3) tankers carrying more than 2,000 tons of oil are obligated to carry special responsibility insurance contracts, and (4) sufferers may be secured by the international fund, should they be unable to have access to full compensation under the aforementioned compensation and reparation system.
In 1984, a protocol for revision of the aforementioned two interna- tional conventions was adopted, and Japan's response to it is under study. When it comes to the damage caused by oil pollution for which the responsible persons cannot be identified, the relief measures to affected fishermen are subsidized by the Fishing Ground Oil Pollution Damage Relief Fund, a foundation. Relief was made in a total of 33 cases with the outlay of ¥138,420,000.
Chapter 8. Other Pollution--Present State and Measures
8-1 Wastes Disposal--Present State and Counter Measures
8-1-1 Outline of Disposal of Wastes
(1) Disposal of General Waste
General wastes are treated according to disposal programs for- mulated by municipalities. The means of disposal of human wastes is shown in Table 8-1-1.
The installation of septic tanks is indicated numerically in Fig. 8-1-1, and about one-fourth of the people are contributing to the dissemi- nation of flush-toilet systems.
The methods of general wastes disposal are indicated in Table 8-1-2. The total discharge of Trash in fiscal 1990 registered a slight rise of 0.9% from the previous fiscal year.
Fig. 8-1-1 Number of Human Waste Purification Tanks Installed
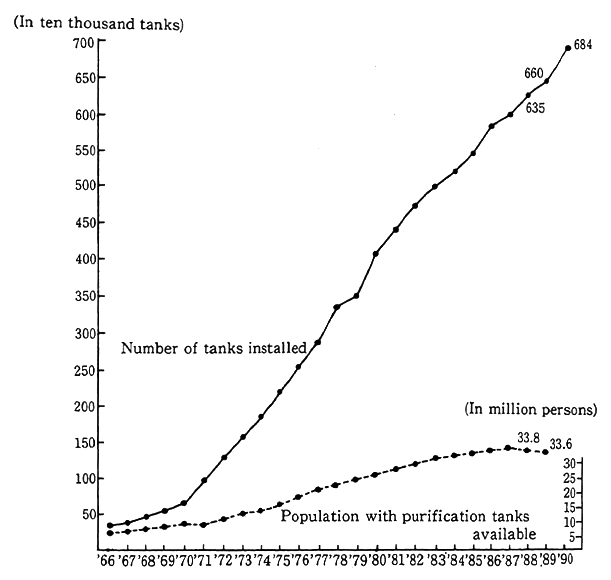
Table 8-1-1 Treatment of Human Waste
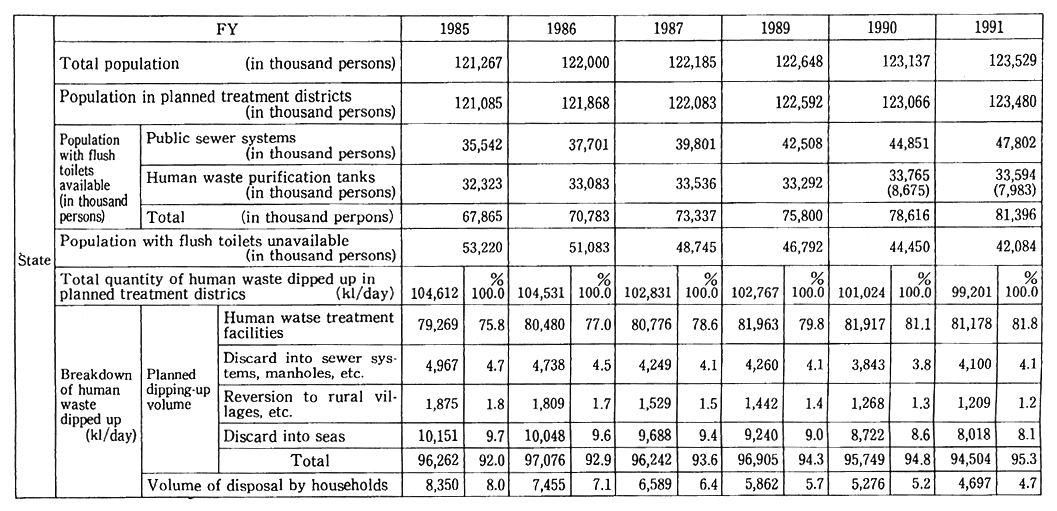
Remarks:1. Surveyed by the Ministry of Health and Welfare.
2. Total volume of human waste dipped up=volume of human watse dipped up+volume of sludge in human waste purification tanks.
3. The figures in parentheses in the row for the population with human waste purification tanks available represent the population for whom community plants are available.
4. As fractions are cut away, the total figures do not coincide with the breakdown figures.
5. The total population includes the population of foreign residents in some municipalities.
Table 8-1-2 Treatment of Trash
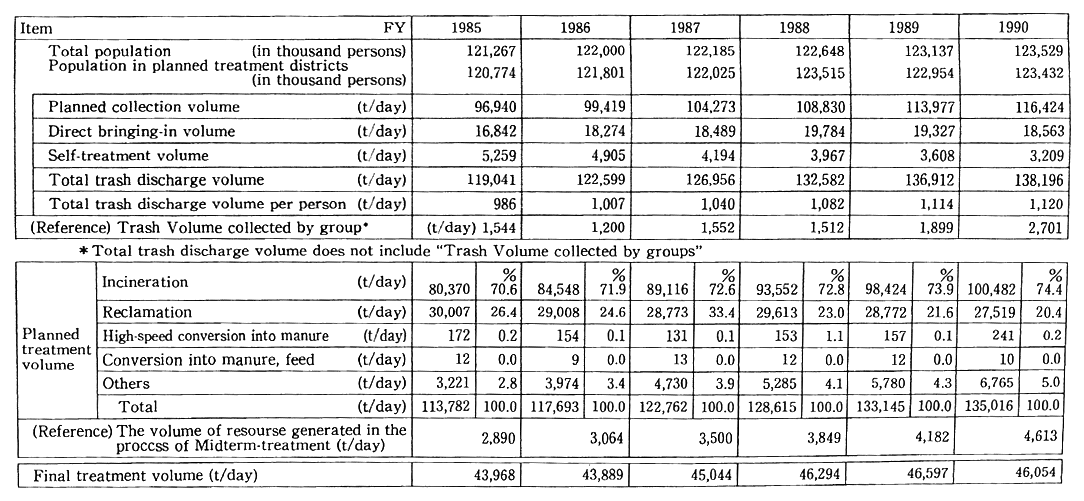
(Note)(3)=(2)/(1)
*Trash Volume collected by groups is equal to the volme collected by PTA(Parents and Teachers Association) and local community and others under the direction o the public.
*The volume of reasourse generated in the process of Midterm-disposal consists of Iron, Aluminum which is recycled from the valuble trash
*As fractions are cut away, the total figures do not coincide with the breakdown figures.
*The total pollution includes the population of foreign residents in some municipalities
(2) Disposal of Industrial Wastes
The discharge of industrial wastes is shown in Table 8-1-3. The installation of industrial waste disposal facilities is shown in Table 8-1-3. The installation of industrial waste disposal facilities is indicated in Table 8-1-4.
Industrial wastes are treated at the responsibility of entrepre- neurs, in principle. As the role played by industrial waste disposal agents however, had become important in recent years, the number of cases in which licenses were awarded to industrial wastes disposal agents stood at 71,514 as of April 1991.
Table 8-1-3 Discharge of Industrial Waste (National)
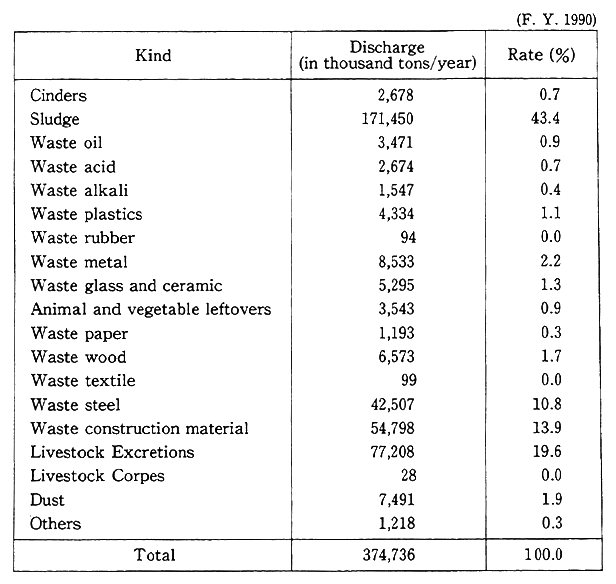
Remarks:Surveyed by the Ministry of Health and Welfare
Table 8-1-4 Installation of Industrial Waste Treatment Facilities
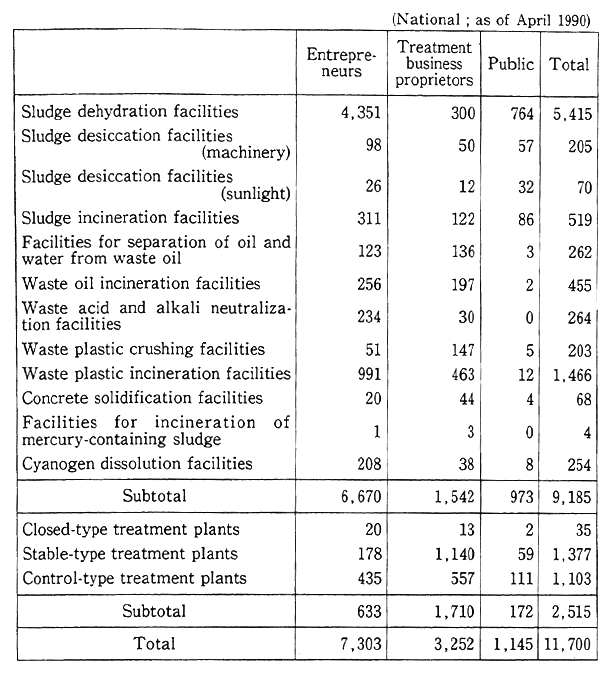
Remarks:1. Surveyed by the Ministry of Health and Welfare.
2. The facilities are those on which reports are filed under Article 15, Paragraph 1, of the Waste Treatment Law.
3. The final disposal plants where industrial and general wastes are put together for reclamation are included in the control-type treatment facilities.
4. "Public," referred to in the table, represents bodies corporate which are tied in with municipalities' tap water and sewer systems and industrial water projects.
8-1-2 Waste Disposal Measures
(1) Revision of Law Concerning Waste Disposal and Public Cleaning
Given a rise in the wastes generation and a diversification of waste type, the difficulty of securing waste disposal facilities and illegit- imate disposal, such as the illegal throwaway of wastes, have become a serious social issue. Given this situation, the Law for the Amendwent of the Waste Disposal and Public Cleaning Law and the Law for Special Measures for the Improvement and Construction of Waste Treatment Facilities were enacted. It was promulgated in July, 1992.
This law is so formulated that measures are implemented with primary attention focused on:
(A) Promotion of measures to reduce waste volume and recycle it
(B) Assurance of the proper disposal of wastes
(C) Development of disposal plants
(2) General Waste Measures
In fiscal 1991, disposal facilities were developed, including waste disposal facilities, human waste disposal facilities, facilities at re- claimed tracts of land and so forth with a total of ¥101 billion in subsidies from the General Account. The Ministry of Health and Welfare is replenishing a project to reduce the discharge of wastes.
(3) Combined Treatment Septic Tanks
Hopes are pinned on combined treatment septic tanks as an effective means to cope with household waste water. The combined treatment septic tank development project is outline below:
National Treasury subsidies in FY 1991 ¥8.5 billion
Number of project-implementing municipalities municipalities in fiscal 1992
Earlier, the combined treatment septic tank development project had been designed for areas other than those for which sewage projects had been planned. Beginning fiscal 1991, subsidization projects have been under way even in the areas for which sewage projects are planned, including those designated under the Special Measures Law for Conser- vation of the Water Quality of Lakes and Reservoirs, and the priority areas designated for measures to cope with household waste water effluents under the Water Pollution Control Law, in the case that the development of sewage systems is not expected in seven years.
Also, systematic development of community waste treatment plants and combined treatment septic tanks is being done under the household effluent waste water treatment programs worked out by municipalities.
(4) Industrial Waste Counter Measures
As regards industrial wastes, illegal disposal and other improper means of disposal are still occuring. The discharge volume is on the increase as are the types of wastes. The following measures are being taken to cope with industrial wastes: (A) Dissemination of, the "Asbestos Waste Disposal Guideline", "Medical Care Waste Disposal Guideline", "Construction Industry Waste Disposal Guideline" and "Fishery Waste Disposal Guideline" (B) The situation of administrative disposition on illegal industrial waste treatment in fiscal 1989 is as follows:
On-the-spot inspections 58,339 cases
Reports collected 12,350 cases
Permits canceled or temporarily suspended 61 cases
Counter Measures or improvements ordered 10 cases
Concerning the recycling of wastes, the Ministry of International Trade and Industry subsidizes tests, research, surveys and recycling projects. In regard to construction industry's wastes, the Ministry of Construction formulated the immediate Policy for the Promotion of Measures for Coping with the Construction Industry's Wastes in March 1991, under which measures have been implemented. Incidentally, how wastes from the manufacturing industry are disposed of is shown in Table 8-1-5.
Table 8-1-5 Recycling of Industrial Waste (FY 1990)
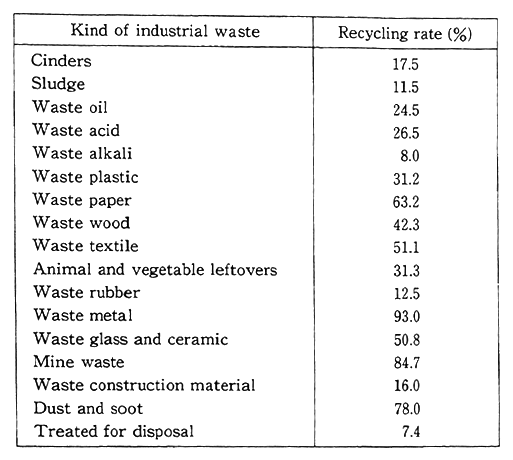
Remarks: Surveyed by the Ministry of International Trade and Industry. The figures in parentheses are those for FY 1998.
(5) Enactment of the "Law for the Promotion of Utilization of Recyclable Resources"
In order to effectively utilize finite resources and contribute to curbs on the wastes generation and to environmental conservation, the Law for the Promotion of the Utilization of Recyclable Resources was enacted in April 1991, effective in October 1991. In order to increase the utilization of recyclable resources, the law stipulates a "basic policy" of systematically and comprehensively promoting the use of recyclable resources, and it is stipulated in the law that competent ministers shall develop judgment criteria for private industry, provide guidance and counsel according to those criteria. If necessary, they may make recom- mendations and take other measures in promoting the utilization of recycled resources by specified businesses. Included as specified indus- tries are paper manufacturing, glass container manufacturing and construction industries. Additionally they may devise the structures, materials for Category I products (motor vehicles, air conditioning systems, televisions, electric washing machines and electric refrigera- tors), prepare easy-to-identify labels for Category II (aluminum and steel drink cans) and promote the utilization of designated by-products (iron and steel slugs, coal ash, earth and sand, lumps of cement, lumps of asphalt concrete and wood) as recycled materials.
(6) Development of Cross-Jurisdictional Disposal Facilities (I. e., large scale)
In order to respond to calls for the establishment of cross- jurisdictional disposal facilities in major cities, Ministry of Health and Welfare, and Ministry of Transport are promoting an cross- jurisdictional waste reclamation and disposal plant program (known as the Phoenix Plan). In the Osaka Bay area, the Osaka Bay Cross- Jurisdictional Littoral Environment Development Center continued to carry out the construction of cross-jurisdictional disposal plants, accepted wastes and disposed of them by means of reclamation.
In the Tokyo Bay area, surveys were conducted to study on Cross-Jurisdictional Disposal and identify concrete measures based on the "Tokyo Bay Phoenix Plan".
The Ministry of Health and Welfare carries out basic surveys in the Chubu area and the Kita-Kyushu area.
(7) Others
In addition, the following measures are implemented:
(A) Problems About Final Closure and Removal of Disposal Plants
The Environment Agency and the Ministry of Health and Web- fare co-provided guidance on the basic administration of Closure and removal for waste disposal plants in accordance with notices served in their names (November 1989). The Environment Agency surveyed management of these sites.
(B) Development of Coastal Protection Measures for Waste Reclamation
In fiscal 1991, the Ministry of Transport subsidized the develop- ment of coastal protection measures works for land reclamation using wastes at a cost of about ¥29,200 million (including about ¥7.6 billion from the National Treasury) for 27 ports and one bay.
(C) Response to Basel Convention
The Environment Agency has surveyed the hazardous wastes defined in the "Basel Convention on the Control of Transboundary Movements of Hazardous Wastes and Their Disposal".
8-2 Ground Subsidence--Present State and Counter Measures
8-2-1 Present State of Ground Subsidence
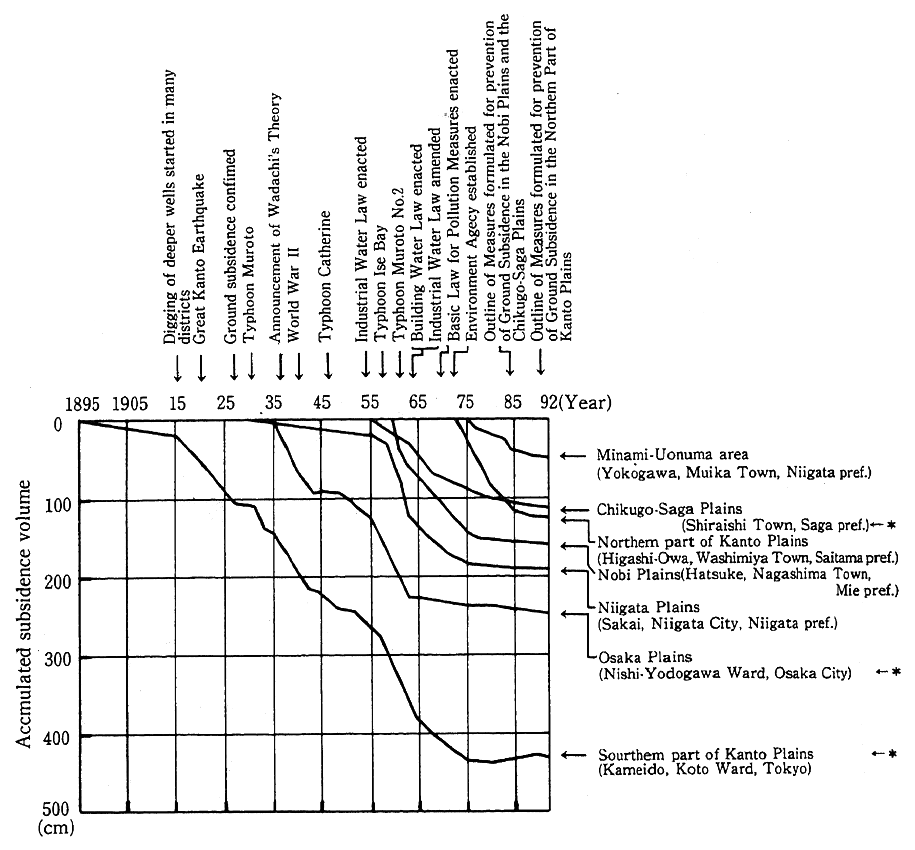
Annual changes in ground subsidence in typical areas are shown in Fig. 8-2-1. Purposes for the withdrawal of ground water, which constitutes the primary cause of land subsidence, are not confined just for industry and construction but are diversified, such as for drinking water systems, agriculture, aquaculture and snow melting. The present state of ground subsidence by region is shown in Fig. 8-2-2, covering 61 districts in 36 prefectures.
The characteristics of ground subsidence in Japan in recent years are as follows:
(1) A check of the nationwide state of ground subsidence in fiscal 1992 by area indicates that recently there are trends of a decrease but that ground subsidence was greater in fiscal 1992 than in fiscal 1991 in terms of area.
By district, considerable degrees of ground subsidence were observed in the north of the Kanto Plains as in the past, and significant degrees of ground subsidence were observed in the Minami-Uonuma area and in the Chikugo-Saga Plains. The areas where great degrees of ground subsidence (in excess of 4 centimeters a year) were observed in fiscal 1991 are as follows:
Minami-Uonuma area in Niigata Prefecture 5.7 cm
Kanto Plains in Tochigi Prefecture 5.3
Kanto Plains in Ibaraki Prefecture 4.8
Kanto Plains in Saitama Prefecture 4.7
Center and Shonan in Kanagawa Prefecture 4.3
Chikugo-Saga Plains in Saga Prefecture 4.3
(2) In Tokyo's wards, Osaka City, Nagoya City and other urbanized areas where there were significant degrees of ground subsidence, ground subsidence has slowed down or virtually come to a stop. In other areas, there are signs of an improvement in a long-term perspective, but ground subsidence continues in some of them as in the past.
(3) Due to many years of ground subsidence, structures, irrigation facilities, port and harbor facilities, farmland and agricultural facilities have been damaged in many districts, and in some zero-meter-high areas, there is the danger that some severe disasters, such as floods, high tides and tsunami, might occur.
Fig. 8-2-2 Area of Ground Subsidences Across the Nation(Tendency of Each Year)
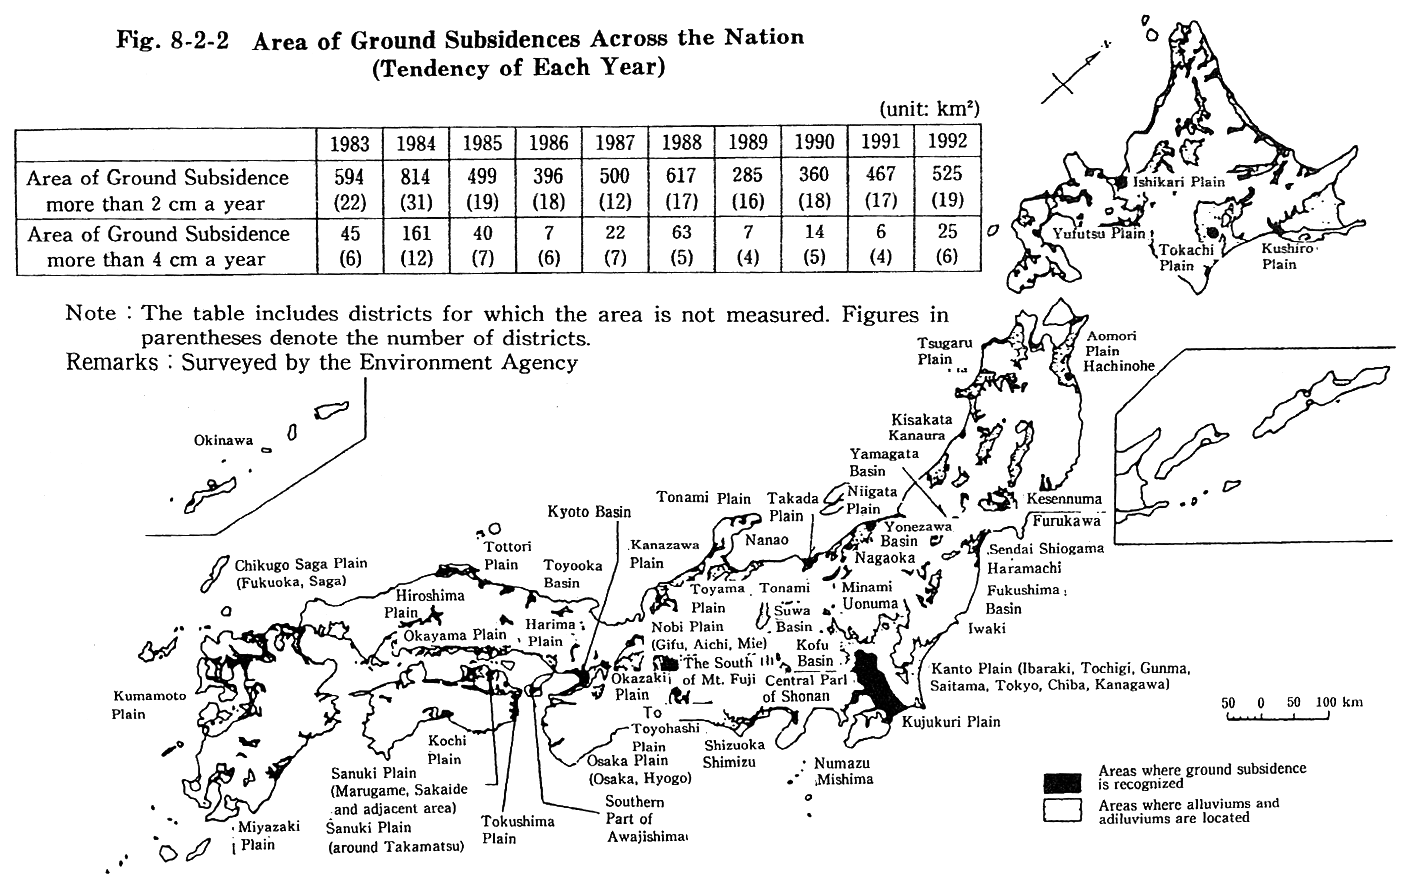
Fig. 8-2-1 Secular Changes in Ground Subsidence in Typical Areas
8-2-2 Ground Subsidence Measures
The following counter measures against ground subsidence are being taken.
(1) Controls on Groundwater Withdrawal
* Ten prefectures are designated under the Industrial Water Law and some districts of four prefectures under the Law Concerning the Regulation of Pumping-up of Undergroundwater for Use in Buildings to control the withdrawal of groundwater.
*In addition, controls under local government decrees. Voluntary controls are exercised on the withdrawal of groundwater for industrial purposes and administrative guidance are made to reduce the withdrawal of groundwater.
(2) Surveys
Local governments were subsidized for the costs required for geological surveys on fluctuations in the ground height and groundwater level which are necessary for the monitoring of areas where the with- drawal of groundwater is controlled. In addition, the measurement of water levels designed to understand the actual state of ground subsi- dence and surveys on the pumping of groundwater, were conducted.
(3) Substitute Water Measures
In order to reduce the withdrawal of groundwater, projects for the securing of substitute water and those for the supply of substitute water were carried out. In areas where measures are required particu- larly for industrial water, projects for industrial water systems are promoted with subsidies granted from the National Treasury.
(4) Damage Rehabilitation Projects
In areas where significant ground subsidence have occurred, rehabilitation projects, measures against high tides, the development of facilities for the removal of closed water, development of facilities for seacoasts conservation of land improvement projects are conducted.
(5) Comprehensive Measures
In order to carry out comprehensive measures, outlines of mea- sures for the prevention of ground subsidence, were formulated in April 1985. for the Nobi Plains and for the Chikugo-Saga Plains, and were formulated for the northern Kanto Plains in November 1991.
8-3 Soil Pollution--Present State and Counter Measures
8-3-1 Present State of Soil Pollution
In areas where there is a risk of pollution, elaborate surveys on the state of pollution of farmland soil are under way, and in fiscal 1991, a survey on cadmium was conducted in 14 areas covering a total area of 713 hectares there was no area surveying on copper and arsenic As a result, there was no area where designation for areas requiring measures (areas where values in excess of the standard values) were needed. The aggregate total of areas where values were in excess of the standard values was 128 covering an aggregate area of 7,050 hectares.
On the other hand, there are cases in conjunction with the redevel- opment of urbanized areas in recent years where toxic substances has penetrated the soil due to accidents, such as the breakdown and damage of facilities at factories, and to illegal waste disposal.
8-3-2 Measures Against Soil Pollution
(1) Establishment of Environmental Quality Standards
The Environmental Quality Standards for Soil were formulated in accordance with Article 9 of the Basic Law for Environmental Pollution Control on August 23, 1991, as the standards to protect human health and conserve the living environment. The standards are basically applicable to all kinds of soil, including that for farmland, and they are defined as targets for administration for the soil conservation.
In formulating the standards, among various functions of soil, we focus on conserving two main function; one is water purification and groundwater cultivation; another producing food. From perspective of first function, concentrations of pollutants leaching out of the soil should meet water quality standards for nine substances designated as health items. From the perspective of conserving the functions of soil to produce food, agricultural areas should not be designated as special areas for countermeasures under the Agricultural Land Soil Pollution Prevention Law.
Those standards are expected to be used for judgment over whether the soil is polluted and over which improvement measures associated with soil pollution should be taken.
(2) Agricultural Land Pollution Prevention Measures
Within all areas where concentrations in excess of environmental quality standards are detected, those specially designated areas for countermeasures are made subjects for the implementation of special land improvement projects for the prevention and elimination of pollu- tion, (including soil removal, the import of soil from other places to be mixed in the soil). The execution of such projects is shown in Table 8-3-1. In cadmium-polluted areas, incidentally, measures are taken to prevent the production of contaminated rice as a provisional measure which will remain in force until the projects are completed.
Table 8-3-1 Progress of Measures Against Farmland Soil Pollution
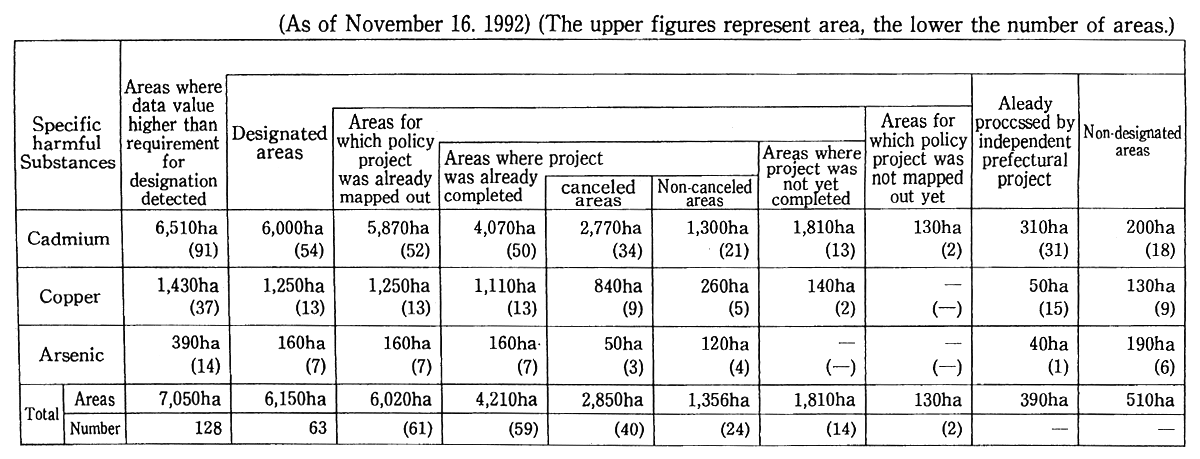
Remarks: 1. Surveyed by the Environment Agency
2. The "areas with detection of values exceeding standard values" are based on the findings of the elaborate surveys conducted before 1992.
3. Addition of the figures in each columu for area and the number of areas does not coincide with those in the column for the totals, because pollution was overlapped. Addition of the numbers of areas in each row does not coincide with the totals and the numbers of "areas with detection of values exceeding standard values," because of the existence of areas separately designated and partially taken off.
4. "Projects completed in areas with plans for measures formulated" and "areas with completion of prefecture's own projects, etc." include the area of land turned to other uses.
5. "Projects completed in areas with plans for measures formulated" represent areas where surface construction in projects for measures with which the State is associated is completed.
(3) Urbanized Area Soil Pollution Prevention Measures
As regards the soil of urbanized areas, surveys are conducted on compliance with environmental quality standards by taking advantage of opportunities for land transformation, when there are clear or pos- sible signs of soil pollution. It is made a practice to encourage entrepre- neurs to take measures necessary for the prompt achievement of envi- ronmental quality standards, when it is clear that the soil is actually polluted. For this purpose, the Japan Environment Corporation carries out loan projects for the costs required for clean up measures.
When it comes to soil and groundwater pollution by trichloroeth- ylene and other chemicals, which is an issue across the nation, surveys were conducted to establish measures to cope with it in an effective and economical way.
(4) Mine Pollution Prevention Measures
To cope with mine pollution, measures are taken under the Mine Safety Law and law on Special Measures for Mine Damages Cansed by the Metal Mining Industries, etc. also, in 1992, to permanent disposal of waste water from mine, establish a fund and the center for Eco-Mining.
The detail is as follows.
(A) Promotion of public utility enterprises for the prevention of mine pollution associated with shutdown or abandoned mines by granting of subsidies.
In 1992, the contents of enterprises.
(1) 43 as construction work.
(2) 68 as disposal of waste water.
(B) In order to prevention of mine pollution, loan projects, technology development, guidance and support to local governments were taken by the Metal Mining Agency of Japan.
8-4 Pollution by Agricultural Chemicals--Present State and Counter measures
8-4-1 Present State of Pollution by Agricultural Chemicals
Along with an increased use of agricultural chemicals after the War, the pollution of food and the environment with BHC, DDT, dieldrin, organic mercury agents etc. became a serious social problem. However,such highly toxic or persistent agricultural chemicals are now neither used nor registered for sale in Japan owing to strengthening regulations of their use under the revised Agricultural Chemicals Regulation Law (hereinafter referred to "the Law") and to the appear- ance of less toxic one developed by the advanced science and technology etc. since 1971. Therefore, the environment pollution caused by such persistent agricultural chemicals has nowadays decreased.
However, as agricultural chemicals potentially possess bioactivity to living organisms in the environment, it is necessary to properly assess those safety and control them in order that they do not cause adverse effects to human health and the environment.
8-4-2 Countermeasures for Pollution by Agricultural Chemicals
Now in Japan, in order to prevent pollution by agricultural chemicals, any agricultural chemical shall be registered for sale through inspection on the persistency, toxicity, etc. under the Law.
Any agricultural chemical shall satisfy for registration any of the following standards, on (1) persistency in agricultural products; (2) persistency in soil; (3) toxicity against aquatic animals and plants; and (4) water pollution. As of December 31, 1992, standards on persistency in agricultural products have been entablished for 260 agricultural chemi- cals. The framework of the standards on water pollution was amended in March 1993, referring to the concept of Environment Quality Stan- dards for Water Pollution Standards on persistency in soil and toxicity against aquatic animals and plants have been established commonly to each agricultural chemical.
Even after its registration, any agricultural chemical may be appointed, by Cabinet Order based on the Law, as agricultural chemical of crop persistence, of soil persistence or of water pollution and its use may be strictly regulated in case that it is in danger of causing damage to men and livestock through crops, soil or water. (Table 8-4-1)
The following are under way for the prevention of agricultural chemicals pollution:
* Surveys on measures against agricultural chemicals residue in crops, soil or water, and fact-finding surveys on agricultural chemicals residue in the environment
* Surveys and researches on the dynamics of agricultural chemicals impurities in the environment, the establishment of methods to assess the impacts of agricultural chemicals on ecosystems, methods to assess the safety of microbial pesticides, and the dynamics of agricultural chemicals in the atmosphere
Furthermore, the Environment Agency established in May, 1990 the "Guidelines for Prevention of Water Pollution by Agricultural Chemicals used at Golflinks" for the local governments and subsidizes them for monitoring contents of agricultural chemicals in the drainage from golflinks.
Table 8-4-1 Agricultural Chemicals Regulated in Terms of Environmental Pollution Prevention
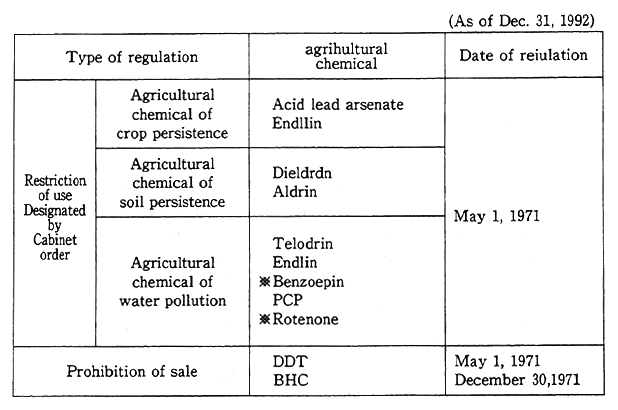
Remarks ※Agricultural chemical registered at present
Chapter 9. Promotion of Environmental Health Measures
9-1 Compensation and Prevention of Pollution-Related Health Damage
9-1-1 System of Compensation and Prevention of Pollution-Related Health Damage
The Pollution-related Health Damage Compensation Law was enacted in 1973 in order to work for prompt and fair protection of the sufferers of pollution-related health damage. This law has played a major role in protection of sufferers.
This system is based on liability according to the Civil Code, therefore, the are compensated by the expense of those who discharged pollutants which caused the health damage.
Designated diseases under this system are classified into the following two categories: one is composed of diseases, such as bronchial asthma, which are not specifically associated with causative pollutants (areas where the air pollution is significant and where the incidence of bronchial asthma and other diseases is high due to its impacts are designated as Class I areas), and the other is composed of diseases, such as Minamamata Disease, Itai-Itai Disease and chronic arsenic poisoning, which have a particular connection to causative pollutants (areas where the environmental pollution is significant and where the incidence of the specific diseases is high due to its impacts are designated as Class II areas).
Of these two areas, the Class I areas were reviewed considering changes in the state of air pollution. The Central Council for Environ- mental Pollution Control submitted a report entitled "How Class I areas under the Pollution-Related Health Damage Compensation Law should be addressed" in October 1986. Based on this report ,the following amendments were made and have been enforced since March 1988, namely (1) cancellation of the designation of Class I areas, (2) continuity of compensation to these who are already certified as sufferers, (3) implementation of programs for the prevention of air pollution-related health damage and (4) change of the name of the law to the "Law Concerning Compensation and Prevention of Pollution-Related Health Damage" (hereinafter referred to as the "Compensation Law").
Under the present state of air pollution, the amendments of the system, which are based on the scientific evaluation that it can no longer be regarded that air pollution is the main factor for asthma, are still rational. The Environment Agency will further endeavor to protect certified patients and to implement the programs for the prevention of health damage.
9-1-2 Diseases by Air Pollution
(1) Compensation to Certified Sufferers
The number of certified sufferers as of the end of December 1992 was 87,340 As the designation of Class I areas was canceled on March 1, 1988, no new sufferers have been certified (Table 9-1-1). For the sufferers who have already been certified, the payment of benefits and allowances are continued as before under the Compensation Law. And the renewal of certification has also been conducted as before. In order to improve the health and welfare of the certified the sufferers, the health care projects are implemented.
80% of the compensation fund comes from smoke-emitting facil- ities and the remaining 20% comes from automobiles.
In order to deal with requests for a review of the decision in regard to certification or the payment of compensation, there is the Pollution-Related Health Damage Compensation Grievance Board.
The requests for review in association with Class I areas are as follows:
(As of the end of December 1992)
Requests for review 189 cases
Revoked 18 cases
Rejected 14 cases
Dismissed 116 cases
Withdrawn 31 cases
Table 9-1-1 Designated Areas, Number of Certified People, Etc., under the "Law Concerning Compensation for Pollution-related Health Damage and Other Measures".
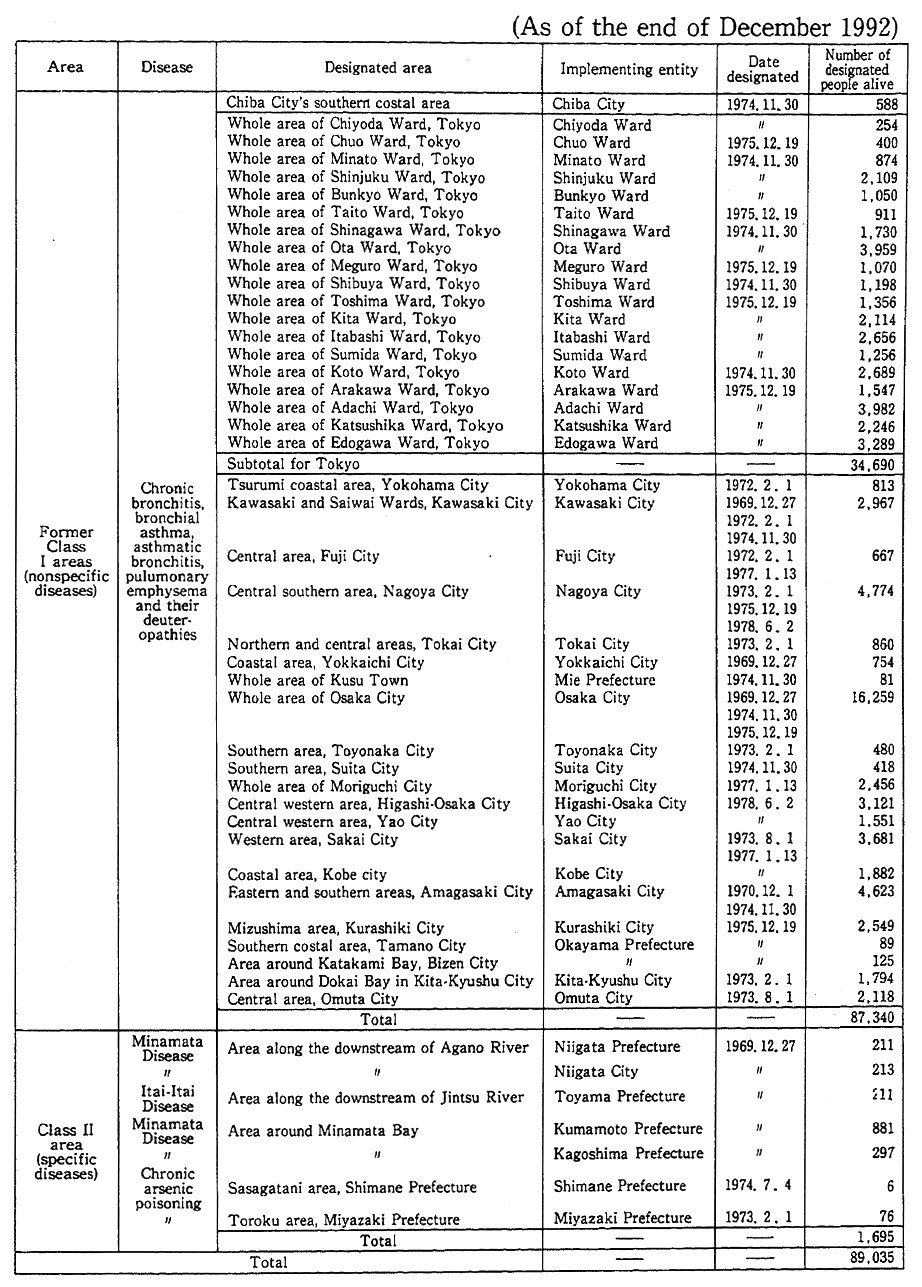
Remarks: 1. Surveyed by the Environment Agency.
2. The indication of designated areas are all according to the administrative demarcation in force at the time of designation.
(2) Implementation of Health Damage Prevention Project
With the enforcement of amended law in March 1988, programs for the prevention of air pollution-related health damage (hereinafter referred to as the "health damage prevention projects") have been implemented. The details of the project are shown in Fig. 9-1-1.
Financial sources for this project utilize working profit of the fund established in the Pollution-Related Health Damage Compensation and Prevention Association. The total amount of the fund is set at ¥50 billion. The fund will be met by contributions from those who are directly responsible for air pollution and those whose business perfor- mance is associated with air pollution, in addition to contribution from the State (¥1,326 million in fiscal 1992). The fund will be developed over a period of seven to eight years, while the fund for projects in each fiscal year is covered by these contributions.
Fig. 9-1-1 Outline of Health Damage Prevention Projects
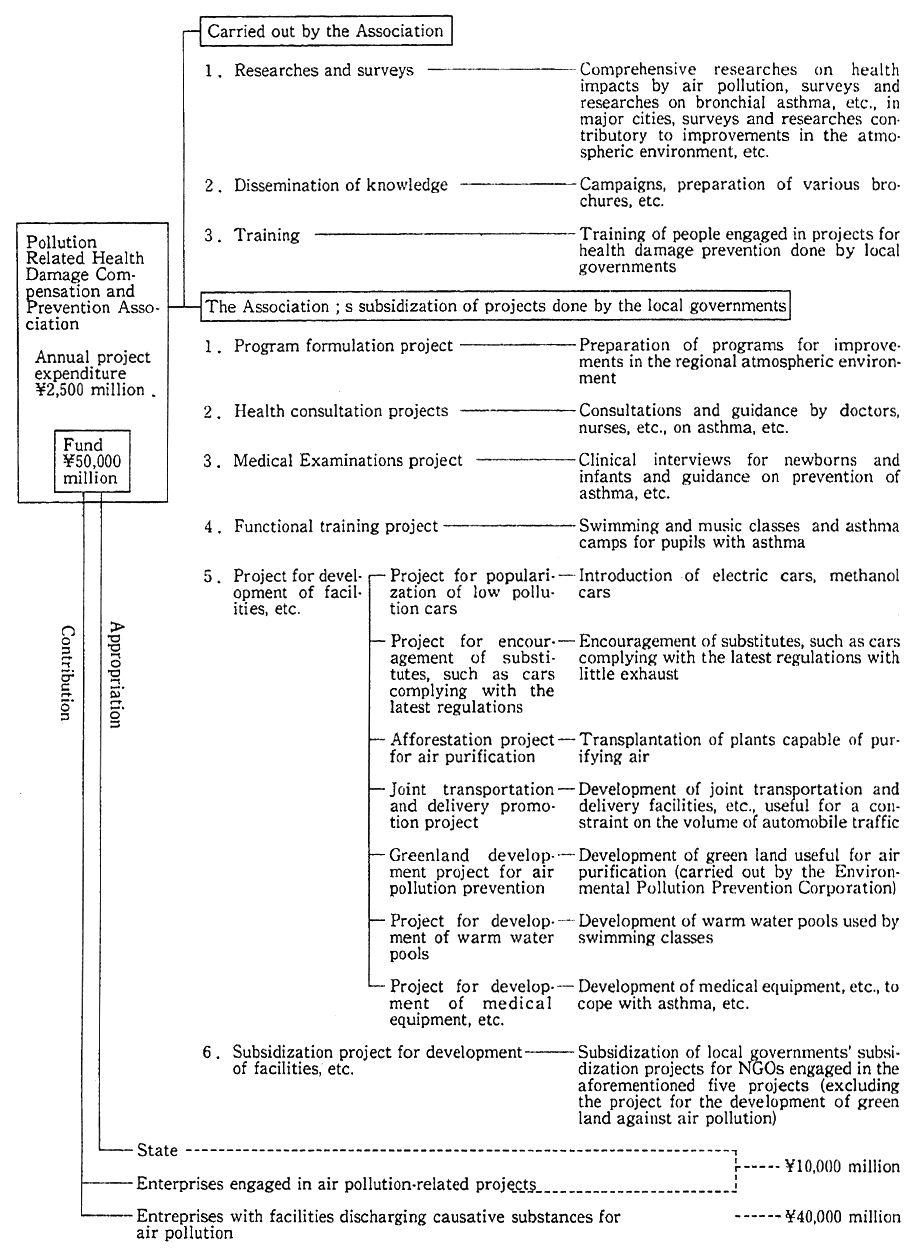
9-1-3 Minamata Disease
(1) Historical Developments
Minamata Disease was detected in areas along Minamata Bay, Kumamoto Prefecture, in 1956, and in the basin of the Agano River in Niigata Prefecture in 1965 as the Second Minamata Disease. In 1968, the government established a consensus view that the disease was caused by the consumption of fish and shellfish in which methylmercury com- pound, discharged from the facilities of Chisso Co., Ltd. and Showa Denko Co., Ltd. respectively, was accumulated. As regards the health damage caused by Minamata Disease, relief measures have been taken since 1969 under the Law Concerning Special Measures for Relief of Pollution-Related Health Damage (hereinafter referred to as "Relief Law") and since 1974 under the Pollution-Related Health Law.
In the meantime, the judgment of the first suit of Minamata Disease in Niigata was handed down in September 1971 and that of the first suit on Minamata Disease in Kumamoto in March 1973. In these judgments, the responsibility of Showa Denko Co., Ltd. and Chisso Co., Ltd. to compensate for damages were established. Based on these judgments, agreements on compensation were concluded between suf- fers' organizations and Showa Denko Co., Ltd. in June 1973 and between them and Chisso Co., Ltd. in July 1973. Thereafter the suffers certified under the Relief Law or the Compensation Law have been able to receive compensation directly from these companies.
Subsequent developments are as follows:
(A) In order to promote the certification process of the disease, the Cabinet members related to Minamata Disease reached an agreement on the "Promotion of Minamata Disease Measures" in 1977.
In response to this agreement, a notice "On Criteria for Differen- tiation of Acquired Minamata Disease" was issued in the name of the Director of the Environmental Health Department, Environment Agency (July 1977), and a notice "On the Promotion of Administrative Work for Certification of Minamata Disease" was issued in the name of the Administrative Vice Minister of the Environment Agency (July 1978).
In Kumamoto Prefecture, also, efforts were made for the quick reduction of the number of applicants who had yet to be judged about certification, such as by the establishment of a system for the medical examination of 150 people and the judgment of 120 people per month in October 1977 (In August 1986, this system was shifted to a new one for the medical examination of 250 people and the judgment of 200 people).
(B) In February 1979, furthermore, the Law Concerning Provisional Measures for the Promotion of Administrative Work on Certification of Minamata Disease was enacted, thus enabling the State, also, to do administrative work for certification.