Quality of the Environment in Japan 1993
5-8-3 Development of Green Buffer Zones
For the prevention of pollution and disaster, it is necessary to construct buffer zones to separate areas where pollution is caused by factories and where accidents and disasters occur, from the general urban areas. For this purpose, the Ministry of Construction subsidizes local governments and the Japan Environment Corporation, and the Japan Environment Corporation develops, constructs and sells green buffer zones.
In fiscal 1992, the Ministry of Construction subsidized Namashino City and other 14 areas with ¥3.4 billion.
Also, the Ministry of Transport has developed green buffer zones around Osaka International, Fukuoka and five other airports. Project outlays amounted to ¥6 billion in fiscal 1992.
5-9 Publication Information on, and Education in, Environmental Conservation
5-9-1 Public Information
(1) General Public Information
Whereas public information activities were done through a wide variety of media, the public information journal "Kankyo" (Environ- ment) was distributed, and the public information movies prepared by the Environment Agency were lent out.
(2) Execution of 'Environment Month' Events
The one month period around the World Environment Day on June 5 is designated as "Environment Month," and a wide variety of events, including the environmental exhibition "Eco-Life Fair" and Gatherings in the Environment Month, are carried out in attempts to enhance the people's consciousness about environmental problems. And 21,000 trees were planted at 179 places across the nation to disseminate thought about greening.
(3) The Earth Year 1992 Observed
Advocated by the Environment Agency, the Earth Year 1992 was observed between January and December 1992 with various events staged in a number of communities throughout the land in an effort to help make the Earth Summit in June a success and raise the people's consciousness of the conservation of environment.
(4) An Appeal for the Designation of an "Action Day for Environment Beautification"
The Environment Agency and the Ministry of Health and Wel- fare, among others, called on local governments to designate an "Action Day for Environment Beautification" to spread environment beautifica- tion movements all over the country.
5-9-2 Environmental Education
(1) Environmental Education in General
In order to cope with increasingly complicated and diversified environmental problems, there are calls for each one of the people to deepen his or her understanding about, and promote, life and action of the sort in which consideration is given to the environment, and it is all the more necessary to promote environmental education. The Environment Agency and the Ministry of Education have agreed to establish close liaison for the promotion of environmental education. The Environment Agency has produced television programs and motion pictures, held study meetings on environmental education and distribut- ed teaching materials. The agency has also held symposia on visions for environmental conservation, symposia on environmental educations and symposia on comfortable environments.
The agency also intends to support environmental education projects for which the Local Environment Conservation Fund, estab- lished in fiscal 1989, in administrative ordinance designated cities.
(2) School Education in Environmental Conservation
As regards school education in environmental conservation, guidance has been provided for years, centering on the social, television, health and physical education courses. In March 1989, the Operating Procedures for Guidance on Learning for primary, middle and high schools were amended in attempts to further replenish the contents of guidance on the environment. Started in fiscal 1990 was the preparation of guidance materials for teachers. Furthermore, symposia on environ- mental education and study meetings have been held since fiscal 1991 to enhance the quality of teachers in environmental education.
5-9-3 Promotion of Environmental Conservation Activities
(1) General Activities To Conserve the Environment
As the interest in environmental problems is on the rise, there is the need to replenish environmental conservation activities both in communities and businesses, such as the development of social condi- tions for environmental conservation activities and the offer of proper information.
For this purpose, the Environmental Agency held the Environ- mental Conservation Leaders' Study Meeting in Kochi in fiscal 1992 and took support measures, such as an exchange of information, with the use of the Local Environment Conservation Fund.
The agency also conducted surveys to come to grips with the actual conditions of corporate environmental conservation activities and carried out guidance and upbringing projects on the Eco Mark system to promote the production and consumption of merchandise.
(2) Promotion Activities of Private Organizations for the Conservation of Global Environment
With countries in Europe and North America at their center, various activities of private organizations for the conservation of global environment have been increasingly active in the late years. Private organizations from many countries in the world held the Global Forum at the occasion of the Earth Summit in Brazil in June 1992 and their activities drew attention worldwide.
In Japan as well, the number of private organizations carrying out activities for the conservation of environment not only at home but overseas, such as afforestation and wildlife protection--chiefly in devel- oping countries--is increasing, and interest of the people and enterprises is also mounting. These grass-root cooperation for the conservation of environment and actions participated in broadly by the people at their feet are extremely important. Especially in Japan, as it is necessary to strengthen activities of private organizations (generally called non- governmental organizations) in two aspects of (1) reviewing economic and social activities and (2) strengthening assistance to developing countries, it is imperative to give support to these activities.
For this reason, the importance of roles of private organizations' activities for the conservation of global environment and the necessity of giving support to these activities are pointed out strongly in an understanding made in May 1992 by the Council of Ministers for Global Environmental Conservation and the new economic plan formulated in June.
Under these circumstances, the Government expressed at the Earth Summit its intention to build a mechanism chiefly made up of funds from the private sector to give grants to private-sector activities. The Government then decided to inaugurate the "Japan Fund fom Global Environment" within the Japan Environment Corporation with subscriptions of the Government and contributions from the private sector. The Government included appropriations for the Japan Fund for Global Environment in the draft budget for fiscal 1993. In the meantime, the Cabinet on February 12, 1993 decided upon the "Bill of the Law to Revise a Part of the Japan Environment Corporation Law" and present- ed it to the National Diet.
According to the bill, it is proposed that the Japan Fund for Global Environment be established within the corporation and frants be awarded Japanese private organizations to carry out environment conservation activities, such as reafforestation and wildlife protection, etc, in developing countries, as well as Japanese private groups to carry out environment conservation activities at home, such as tree planting, recycling, etc. At the same time, it is proposed that information be provided, training be given and other necessary steps be taken for the promotion of private-sector activities.
In addition, support is being given environment conservation activities of private organizations as the recipients of subsidies to non-governmental organizations and small-scale grant aid, both of which are administered by the Ministry of Foreign Affairs; distribution of donations raised by the sale of postcards including contributions in their postage and the international volunteer savings system, both of which are admnistered by the Ministry of Posts and Telecommunica- tions, and under other arrangements.
(3) Promotion of Recycling Activities
Given the enactment of the Law Concerning the Promotion of the Utilization of Renewable Resources and the revised Waste Disposal and Public Cleansing Law, there is the need to work for a further encourage- ment of recycling activities.
For this purpose, starting in 1991 related ministries and agencies designated October as Recycling Promotion Month, and held a wide variety of symposia and activities for dissemination and enhancement.
The Environment Agency prepared and distributed various pam- phlets, video tapes, other materials for dissemination and enhancement. The agency also performed surveys to come to find out where the offer of information and so on in municipalities stand. Furthermore, the Ministry of Health and Welf are established a new system of subsidizing measures to promote making trash lighter in weight. Under this system, the ministry subsidized the establishment of routes for the conversion of trash into resources and efforts to organize groups for this purpose. The ministry also conducted a wide variety of enhancement activities to promote making waste more light in weight and recycling.
(4) Rrevention of Empty Can Litter
The output of canned drinks has rapidly increased. Oktput rose to more than 29 billion cans a year in fiscal 1990 from the 800 million cans or so in 1970. Some of them were littered on roads and seacoasts, in rivers and at other places, posing problems in terms of environmental beautification. The findings of a survey performed by the Environment Agency in 1991 reveals that the littering of empty cans has leveled off in recent years.
To prevent the littering of empty cans, some local governments recover them in a system in which coupons will be handed out which may be exchanged with book coupons when they reach the specified number or in a deposit system. In addition, ordinances are established, operating procedures and other measures are created and campaigns are conducted to prevent the discarding of empty cans and the reinforce- ment of cleaning. At the national level, attempts are being made to replenish activities for dissemination and enhancement according to an agreement reached at the Liaison Council on the Problem of Empty Cans which is made up of 11 related ministries and agencies. Besides, the Environment Agency and the Ministry of Health and Welfare call on local governments to designate an Action Day for Environmental Beautification with a view to promoting positive actions on the part of a broader segment of the people.
5-10 Understanding Conditions at Local Environment
Efforts are being made to understand local environmental infor- mation and the people's views and demands with the collection of information from environmental monitors (1,500 persons commissioned across the nation) and through administrative consultation.
Chapter 6. Air Pollution, Noise, Vibration and Offensive Odors--Present State and Measures
6-1 Present State of Air Pollution
According to the data given by continuous monitoring stations established across the nation, the conditions of air pollution, as classi- fied by pollutant, are as follows:
(1) Sulfur Dioxide
a. Changes in Annual Average
(a) General Air pollution Monitoring Stations
Data on sulfur dioxide in fiscal 1991 were provided by 1,606 effective air pollution monitoring stations in 678 municipalities (by "effective monitoring station," it means a monitoring station where monitoring is done for more than 6,000 hours a year).
Changes in the simple mean of annual average values at 15 air pollution monitoring stations which have been in operation since fiscal 1965 are given in Fig. 1-1-3, Part 1.
(b) Road-side Air Pollution Monitoring Stations
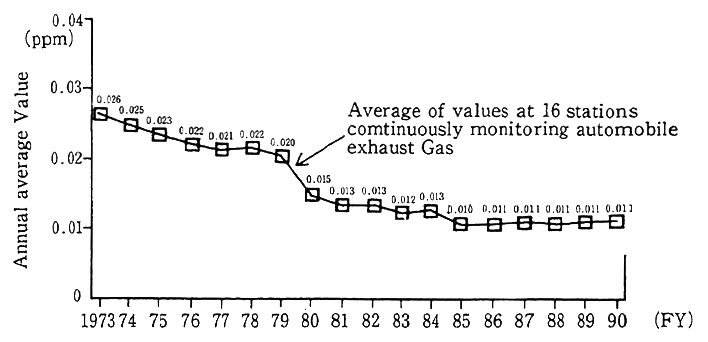
As regards road-side air pollution monitoring stations, fiscal 1991 data were provided 71. effective monitoring stations in 57 municipalities. Changes in the annual average concentration registered by 16 monitor- ing stations which have been in operation since fiscal 1973 are depicted in Fig. 6-1-1, suggesting that the average have generally been falling.
Fig. 6-1-1 Year Specific Trends in Simple Mean of Annual Average Values of Sulfur Dioxide
b. Achievement of Environmental Quality Standards--Changes and Present State
(a) Compliance with Environmental Quality Standards Based on the Long-Term Criteria
In the long-term criteria of environmental quality standards, it is stipulated that the cases where the daily average values throughout the year (excluding those which come within a range of 2% from the measured highest value) do not exceed 0.04 ppm and where the daily average value does not exceed 0.04 ppm for every two consecutive days are considered as satisfying environmental quality standards. For exam- ple, the value of interest here would be the daily average value on the eighth day after excluding those on the seven days from the highest value in cases where there are measured values for 365 days throughout the year.
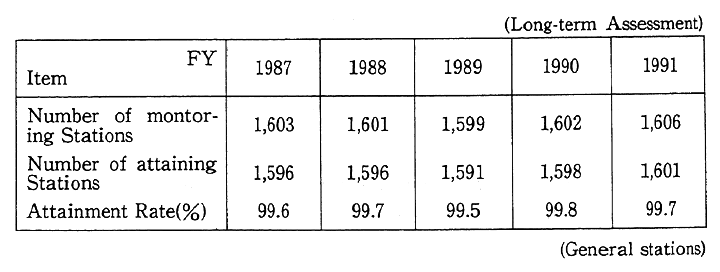
Changes in the compliance with environmental quality standards on the basis of long-term criteria have been leveling off in the last several years, as indicated in Table 6-1-1.
Table 6-1-1 Attainment of Environmental Quality Standards
(b) Compliance with Environmental Quality Standards Based on the Short-term Criteria
The ratio of general air pollution monitoring stations with a daily average value of less than 0.04 ppm on all effective monitoring days to effective monitoring stations stood at 98.9% in 1990 and 98.4% in 1991. The ratio of monitoring stations with an hourly value of less than 0.1 ppm in every monitoring hour, to effective monitoring stations fluctuate at high level, standing at 96.0% in 1990 and 94.3% in 1991.
The ratio of road-side air pollution monitoring stations with the daily average value of less than 0.04 ppm on all effective monitoring days to effective monitoring stations stood at 88.2% in 1990 and 85.7% in 1991. The rate of monitoring stations with an hourly value of less than 0.1ppm in every monitoring hour to effective monitoring stations fluctu- ate at high level, standing at 94.1% in 1990 and 9&6% in 1991.
(2) Nitrogen Dioxide
a. Changes in Annual Average
(a) General Air Pollution Monitoring Stations
Monitoring data on nitrogen dioxide in fiscal 1991 were secured at 1,378 effective monitoring stations in 647 municipalities.
Secular changes in the simple mean of annual average values recorded by 15 monitoring stations (which have continued monitoring since fiscal 1970) are shown in Fig. 1-1-1. Chapter 1, Part 1. Though there had been signs of a drop since fiscal 1969, the mean began to rise in fiscal 1986. coming to 0.029 ppm in fiscal 1991 as was the case with fiscal 1990.
(b) Road-side Air Pollution Monitoring Stations
Data on nitrogen dioxide in fiscal 1991 were secured at 329 effective monitoring stations in 185 municipalities.
Secular changes in the simple mean of annual average values recorded by 21 monitoring stations which have been in operation since fiscal 1971, are shown in Fig. 1-1-1.
b. Achievement of Environmental Quality Standards
As regard the environmental quality standard associated with nitrogen dioxide, it is stated in the revision specified by the Environment Agency Notification No. 38 in July 1978 (hereinafter referred to as the "Notification") that "the daily average of hourly values shall be within or less than a range of 0.04 ppm to 0.06 ppm." It is stipulated that efforts shall be made to arrive at 0.06 ppm within 7 years (2-1 the Notification) in areas where the daily average exceeds 0.06 ppm, in principle, and that in areas where the daily average is in a range of 0.04 ppm to 0.06 ppm, efforts shall be made to maintain the present level or a level around it within this range or not to significantly exceed it, in principle" (2-2 the Notification).
A comparison with environmental quality standards for nitrogen dioxide by the daily average value equivalent to 98% from the lowest throughout the year (hereinafter referred to as "annual 98% value of the daily average") for 1,378 effective general air pollution monitoring stations indicates, as shown in Fig. 1-1-2, Chapter 1, Part 1, that 5.9% of all the stations exceeded the standard in fiscal 1991, less than the 6.3% recorded in fiscal 1990.
As for Road-side Air Pollution Monitoring Stations, annual 98% value of daily average exceeds 0.06 ppm in 121 stations (37.2%), which concentrate in urban area such as Tokyo, Osaka and Kanagawa prefec- ture.
c. Trends for areas whose Nitrogen Dioxide concentration level is in 0.04-0.06 ppm specified by environmental quality standard
Recent trends in concentrations in areas with the daily mean, (associated with environmental quality standards for nitrogen dioxide), within the range of 0.04 ppm to 0.06 ppm are given in Table 6-1-2 with the data of fiscal 1977 through 1991, when the standards were specified in the Environment Agency's Notice No. 2-2.
Table 6-1-2 Trends in Nitrogen Dioxide Concentration in Areas Within a Range of Daily Average Values Values from 0.04ppm to 0-06ppm
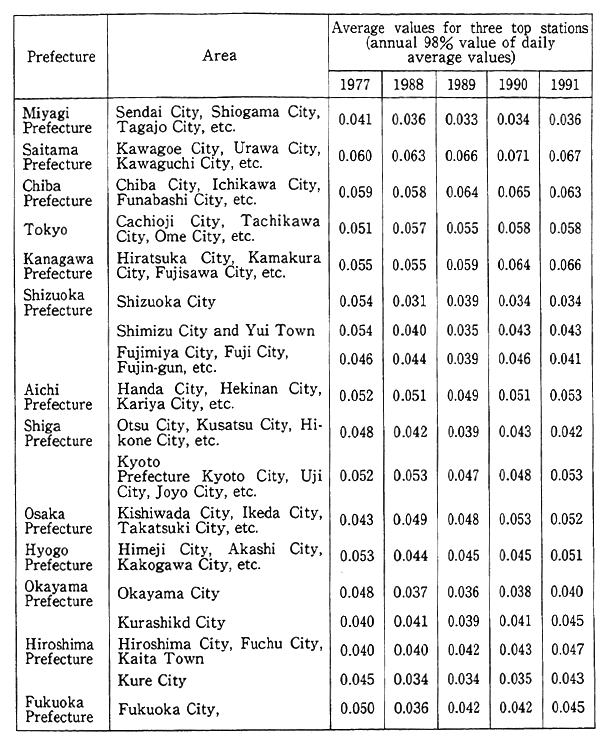
Remarks: 1. Surveyed by the Environment Agency.
2. Arean with increases 3areas
Areas virtually with the present levels. l5areas
However, the areas with more than 0.06ppm are counted as areas with increases.
d. Nitrogen Monoxide
(a) Air Pollution Monitoring Stations
Data on the monitoring of nitrogen monoxide in fiscal 1991 were secured at 1,378 effective monitoring stations in 647 municipalities.
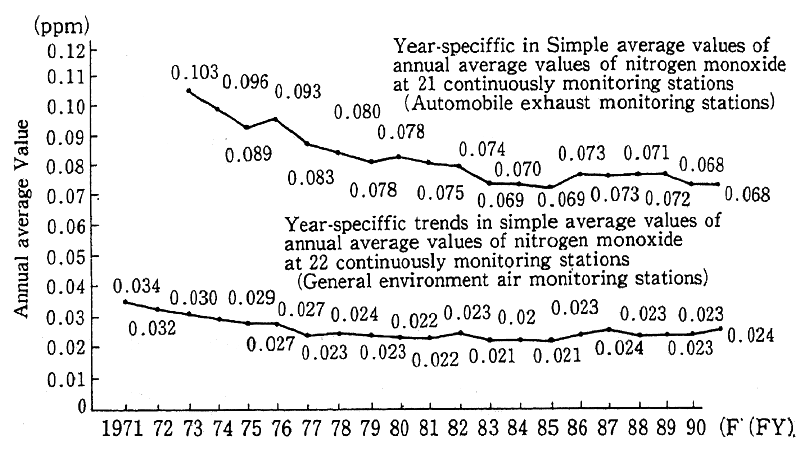
Secular changes in the simple mean of annual average values at 28 monitoring stations which have continued monitoring since fiscal 1971 are shown in Fig. 6-1-2. The changes have roughly leveled off in the last 10 years, and 0.024 ppm in fiscal 1991 is as save as 0.023 ppm in fiscal 1990.
Fig. 6-1-2 Year-spacific Trends in Simple Average Values of Annual Values of Nitrogen Monoxide
Remarks: 1. Surveyed by the Environment Agency.
(b) Road-side Air Pollution Monitoring Stations
Data on the monitoring of nitrogen monoxide in fiscal 1991 were secured at 329 effective monitoring stations in 185 municipalities.
Secular changes in the simple mean of annual average 21 monitor- ing stations (the same as in the case of nitrogen dioxide) which have been in operation since fiscal 1973 are shown in Fig. 6-1-2.
(3) Carbon Monoxide
a. Road-side Air Pollution Monitoring Stations
Data on the monitoring of carbon monoxide in fiscal 1991 were secured at 320 effective monitoring stations in 189 municipalities.
(a) Trends in Annual Means
Secular changes in the simple mean of annual average value at 14 monitoring stations which have been in operation since fiscal 1971 are indicated in Fig. 1-1-6, Chapter 1, Part 1.
(b) Achievement of Environmental Quality Standards
In the long-term criteria of environmental quality standards, it is stipulated that the cases where the daily average values throughout the year excluding those which come within a range of 2% from the highest value do not exceed 10 ppm and where the daily average value does not exceed 10 ppm for every two consecutive days are considered as satisfy- ing environmental standards.
In the long-term criteria of environmental quality standards, it is stipulated that the cases where the daily average value does not exceed 10 ppm and where 8 hours' average value does not exceed 20 ppm are considered as satisfying environmental standards.
All 314 effective road-side air pollution monitoring stations have recorded compliance with the environmental quality standards, both on long-term and short-term criteria.
b. General Air Pollution Monitoring Stations
Data on the monitoring of carbon monoxide in fiscal 1991 were secured by 190 effective monitoring stations in 160 municipalities. All stations satisfied the environmental quality standards, both on long- term and short-term criteria.
(4) Photochemical Oxidants
a. Findings of Monitoring of Photochemical Oxidants in Fiscal 1991
Data on the monitoring of photochemical oxidants were observed in 1,063 general Air Monitoring Stations in 584 municipalities and in 39 Road-side Air Monitoring Stations in 25 municipalities.
The frequency with which photochemical oxidants appear is significantly affected by meteorological conditions, so that there is a rise irregular or drop, depending on the year. But it decreased in fiscal 1991 compared to in fiscal 1990. As for 979 General Air Monitoring Stations and 38 Road-side Air Monitoring Stations where the photo- chemical oxidants were monitored continuously since 1987, the average number of days per monitoring station with concentrations above the warning issuance level (0.12 ppm in terms of hourly value) is shown in Table 6-1-3.
Table 6-1-3 Trends in Average Number of Days with Concentrations Requiring Issue of Warnings (General Stations)

Remarks:1. Surveyed by the Environment Agency.
2. The Tokyo Bay area consists of Tokyo and six prefectures including Ibaraki, Tochigi, Guruna, Saitama, Chiba and Kanagawa.
3. The Osaka Bay area consists of Kyoto Prefecture, Osaka Prefecture, Hyogo Prefecture and Nara Prefecture.
4. The values in the table are computed by dividing the total number of days when the concentration exceeded at coninuously monitoring stations by the number of continuously monitoring stations.
b. Issuance of Warnings on Photochemical Oxidants in 1992
(a) Issuance of Warnings
The number of days in 1992 when a warning on photochemical oxidants was issued (this warning is issued when the hourly average of photochemical oxidants concentrations is 0.12 ppm or higher and that the pollution is considered to continue further in view of the meteorolog- ical condition at that time) was 164 in the aggregate, covering 16 prefectures. This suggests that the number of days increased by 43 days from the 121 in 1991 (in 15 prefectures). This number in fiscal 1992 is virtually the same as in 1985 (171 days) and 1987 (168 days). (Table 6-1-4).
Table 6-1-4 Trends in Aggregate Total of Days with Warnings Issued and in Number of Person Reporting about Damege

Remarks : Surveyed by the Environment Agency.
The monthly breakdown of the aggregate total number of days when warnings were issued were five days in April, three days in May, 28 days in June, 102 days in July, 12 days in August and 14 days in September, suggesting that the issuance is more frequent in July.
Incidentally, the highest concentration of photochemical oxidants when warnings were issued in 1992 was 0.214 ppm. No photochemical oxidants alarm was issued however they will be issued, in general, when the hourly average of photochemical oxidants concentrations is 0.24 ppm or higher and that the pollution is considered to continue further in view of the meteorological condition at that time, although different criteria are applied by the local government.
(b) Regional Breakdown of Warnings Issued
The regional breakdown of the total number of days when warnings were issued in 1992 were 108 days in the Tokyo 'Bay Region (Ibaragi, Tochigi, Gunma, Saitama, Chiba, Tokyo and Kanagawa Pre- fecture) and 19 days in the Osaka Bay Region (Kyoto, Osaka, Nara and Hyogo Prefecture). Those two regions accounted for about 77%.
(c) Number of Sufferers
The number of reported sufferers from photochemical air pollu- tion in 1992 (persons voluntarily reporting due to subjective symptoms) was 307 persons, far smaller than the 1454 persons in 1991.
(5) Non-methane Hydro carbons
As regards the monitoring of hydro carbons, it is stipulated on the basis of a guideline made by the Central Council for Environmental Pollution Control that non-methane hydro carbons (NMHC) shall be monitored, and that the concentration of NMHC, shall be within a range of 0.20-0.31 ppm in terms of the average of three hours between 6 a.m. and 9 a.m. The one hour value of 0.06 ppm is the environmental quality standard for photochemical oxidant which the guideline corresponds to.
a. General Air Pollution Monitoring Stations
Data on the monitoring of NMHC in fiscal 1991 were secured by 340 monitoring stations in 240 municipalities. Secular changes at six stations which have been in operation since fiscal 1978 in terms of the annual mean of average values between 6 a.m. and 9 a.m. is indicated in Table 6-1-5.
b. Road-side Air Pollution Monitoring Stations
Data on the monitoring of NMHC were secured at 163 monitoring stations in 103 municipalities.
Secular changes in the simple mean of annual average between 6 a.m. and 9 a.m. at 9 monitoring stations which have been in operation since fiscal 1977 are shown in Table 6-1-5.
Table 6-1-5 Year-specific Trends in Simple Average Values of Annual Values of Non-methane Hydrocarbon at 6 Continuously Monitoring Stations at 6-9 O'clock

(6) Suspended Particulate Matter
Data on the monitoring of suspended particulate matter in fiscal 1991 were secured at 1,348 effective general air pollution monitoring stations in 637 municipalities and 167 effective road-side air pollution monitoring stations in 118 municipalities.
In the long-term criteria of environmental quality standards, cases where the highest daily average value (which excludes the highest 2% of annual monitored value in terms of daily average values) do not exceed 0.10 mg/m3, and where the daily average value does not exceed 0.10 ppm/m3 every two consecutive days, are regarded as satisfying environmental quality standards.
The percentage of compliance with the environmental quality standards based on long-term criteria has leveled off in recent years. It dropped to 49.7% in fiscal 1991 from 43.1% in fiscal 1990 (Fig. 6-1-3).
Fig. 6-1-3 Attainment of Environmental Standards for Suspended Particulate Matter (General Stations)
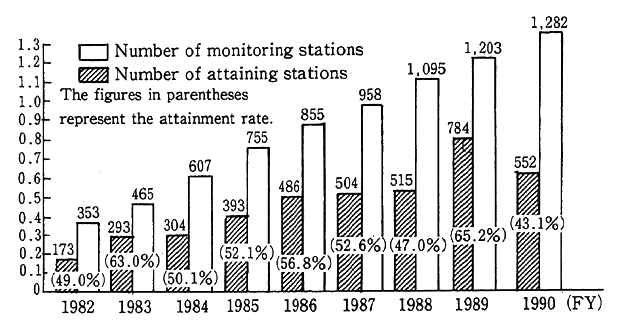
Secular changes in the simple mean of annual average value at 40 general air pollution monitoring stations which have been in operation since fiscal 1974 and 6 road-side air pollution monitoring station (since fiscal 1975) are shown in Fig. 1-1-7, Chapter 1.
(7) Dust Fall
Of all particulate matter in the atmosphere, the types which are regarded as falling dust include soot and dust, particulate and so forth, which fall due to gravity or precipitation.
Of 1,353 monitoring points in fiscal 1991. monitoring was done at 1,178 points for more than the number of hours necessary for effective monitoring. A check of the number of monitoring points by weight of dust falls indicate that there were six points (two points in fiscal 1990) which registered 20-30 t/km3/month and seventeen monitoring points (fourteen points in fiscal 1990) which recorded above 30 t/km3/month.
(8) Other Pollutants
In recent years, attention has been focused on particulate matter in terms of not just quantity but quality, including elemental composi- tion and other factors.
In addition to the aforementioned substances which are constant- ly checked and monitored, the national air pollution monitoring stations established in the nation's major areas analyze the components of suspended particulate matter (benzene soluble matter, sulfuric radical, nitric radical, vanadium and other heavy metals, benzo(a)pyrene, etc.) collected with high volume air samplers, and the components of suspend- ed particulate matter (aluminum, barium and 29 other elements) col- lected with low-volume air samplers. The monitoring and analysis of mercury started in fiscal 1982.
As regards asbestos, mercury and organic chlorine solvents, monitoring has been conducted every other year since 1985. The findings of the surveys thus far conducted indicate that they have not reached levels where problems may occur (Table 6-1-6).
Table 6-1-6 Results of Monitoring Controllde Air Pollutants as of the End of FY 1991
(1) Asbestos
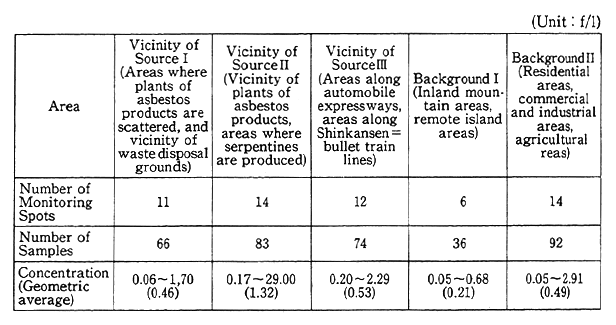
(2) Mercury
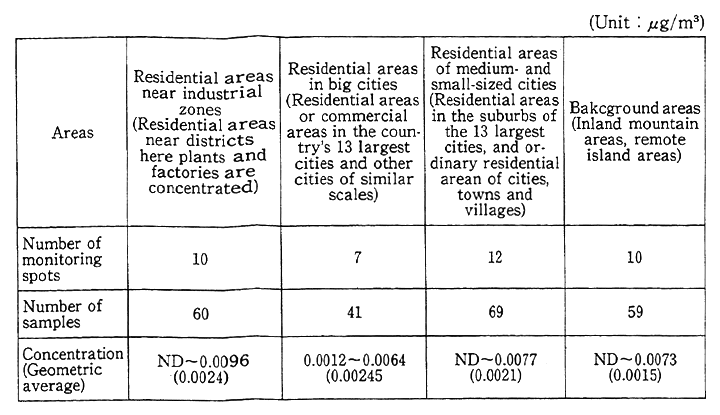
(3)Organic Chlorine Solvents
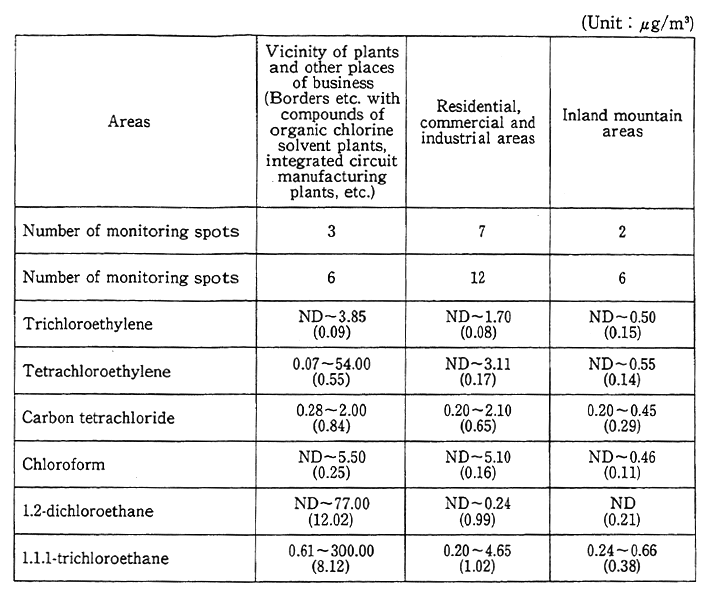
* : 5 for carbon tetrachloride only.
Remarks: 1. Surveyed by the Environment Agency.
2. lfÊg=lg/1,000,000.
3. "ND" dentes "not detected."
4. In parentheses are geometric averages: ND is calculated as 1/2 of detection limit.
(9) Findings of Monitoring at National Environmental and Air Monitoring Stations
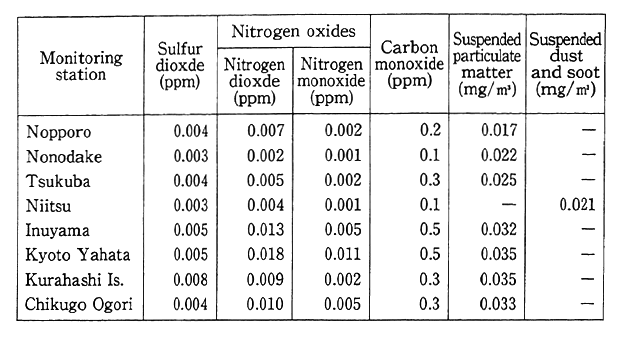
Established at the edges of major plains across the nation, the national environmental and air monitoring stations monitor pollutants at all times. The findings of monitoring by these stations serve as a good yardstick for the background concentration in non-polluted areas. (Table 6-1-7)
Table 6-1-7 Results of Air Monitoring at State-Established Air Monitoring Stations (Annual Average Values)
Remarks : 1. Surveyed by the Environment Agency.
2. The figures in parentheses represent the annual average figures when the monitoring hours is less than 6,000 hours.
6-2 Measures Against Air Pollutants
6-2-1 Sulfur oxides
(1) Controls on Emissions
As regards controls on the emission of sulfur oxides, controls consist of emission standards for facilities, and areawide total pollutant load control standards for factories in highly polluted areas. The con- trols based on emission standards for facilities are known as K-value controls whereby acceptable emissions are formulated. An acceptable emission rate is determined, depending on the stack height and the area, and the permissible rate is gradually amended and strengthened. Are- awide total pollutant load controls for factories are made according to total quantity reduction programs formulated by prefectural governors in the state-designated areawide total pollutant load control districts (designation is done for areas where factories and business establish- ments are concentrated and where it is difficult to achieve environmen- tal quality standards with emission standards alone). At present, con- trols are in place in 24 districts.
In addition, standards for the use of fuels (related to the sulfur content) are formulated for small scale factories and business establish- ments, to which areawide total pollutant load control standards are not applied because of their size. These fuel use standards apply in areas designated for total-quantity controls, and for soot and smoke generat- ing facilities in areas whose air is seasonally polluted to a significant extent due to rises in fuel consumption, such as with heating systems.
(2) Measures Against Pollutant Generation
Sulfur oxide emission standards which have been established for source include: (A) the desulfurization of heavy oils, (B) the installation of devices for flue gas desulfurization and other measures.
(A) As regards the desulfurization of heavy oils, the processing capacity for heavy oils as of the end of fiscal 1991 was 67,000 kl/day with 12 devices for direct desulfurization and 127,000 kl/day with 26 devices for indirect desulfurization. With such measures for the desul- furization of heavy oils, the average rate of sulfur contained in heavy oils for domestic demand stood at 1.02% in fiscal 1991.
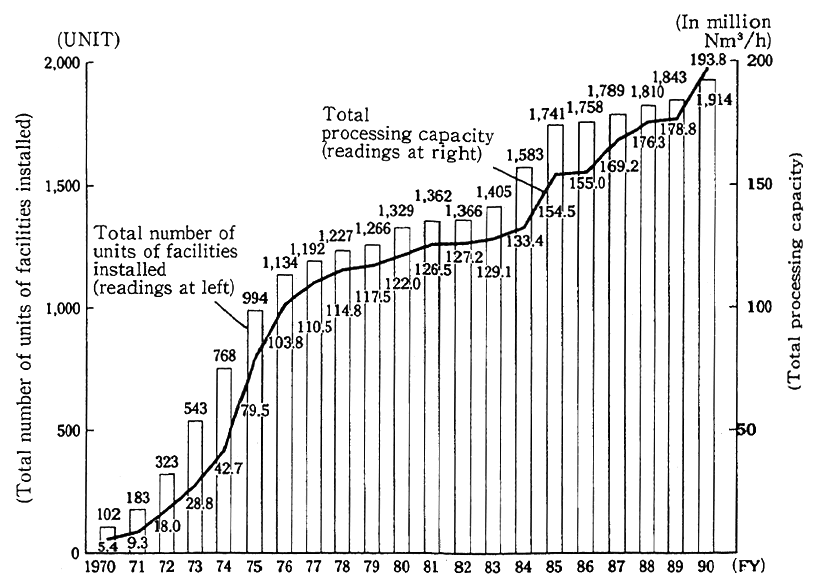
(B) As regards devices for flue gas desulfurization, the operation of practical models began in 1970. Later, the number of devices and the processing capacity have steadily increased (the installation of exhaust smoke desulfurization devices by year is indicated in Fig. 6-2-1).
With the aforementioned measures, the conditions of air pollution by sulfur dioxide are far better than in the first half of the 1965-70 period.
Fig. 6-2-1 Installation of Flue Gas Desulfurization Facilities by Year
Remarks : 1. Surveyed by the Environment Agency.
2. The figures for FY1982 and the preceding years are those as of January 1 of the given year,whereas those for FY 1983 and the subsequent years are those as March 31 of the given year.
6-2-2 Nitrogen Oxides
(1) Measures For Stationary Sources
a. Implementation of Nationally Uniform Emission Controls
Concerning nationwide uniform controls on the emission of nitro- gen oxides when it comes to stationary sources, the strengthening of emission standards and the expansion of subject facilities have been conducted several times since 1973. In addition to in September 1985 small boilers, in October 1987 gas turbine and gasoline engine were added. In November 1990. natural gas engine and gasoline engines were additionally designated as controlled sources, and their controls were started in February 1991.
b. Exercise of Areawide Total Pollutant Load Control
(a) Introduction of Areawide Total Pollutant Load Control
For areas where factories and business establishments are con- centrated and it is considered difficult to assure environmental quality standards with emission controls for each soot and smoke generating facility in isolation, the Ordinance for Enforcement of the Air Pollution Control Law was partially amended in June 1981 to introduce a system of areawide total pollutant load controls on nitrogen oxides. Tokyo's Special Wards and other areas, Yokohama City and other areas, and Osaka City and other areas were designated for areawide total pollutant volume controls.
c. Development of Technology for Reductions in Emission of Nitrogen Oxides
Of late, the development of low NOx combustion technology is remarkable. With the adoption of a two-phase combustion method and a low NOx burner, combustion technology of the kind with which considerable effects may be secured for reductions in the emission of nitrogen oxides is already widely utilized.
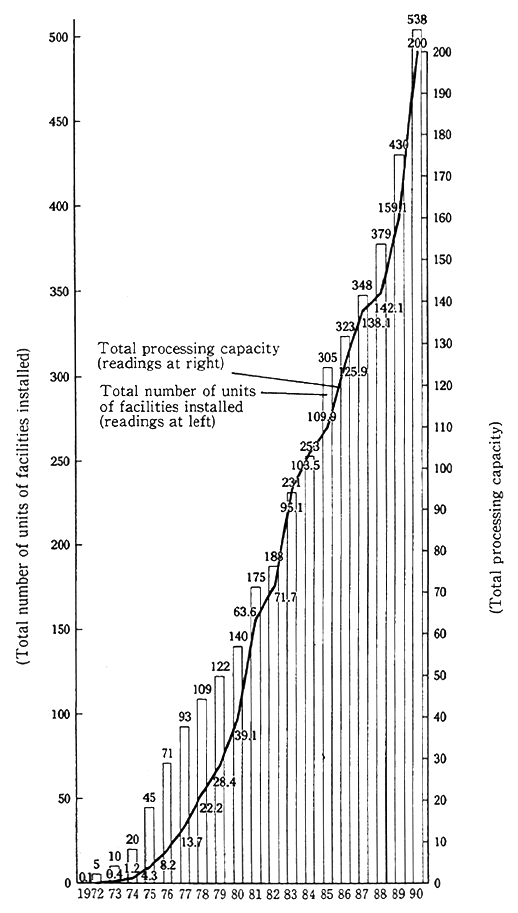
The number of flue gas desulfurization devices installed and the processing capacity have steadily increased as indicated in Fig. 6-2-2. A check of the installation shows that most of them adopt a dry-type selective contact and catalyst reduction method. Other methods include a non-catalyst reduction method, a wet-type direct absorption method and a wet-type oxidation and absorption method.
Fig.6-2-2 Installation of Exhaust Desulfurization Facilities by Year
Remarks : 1. Surveyed by the Environment Agency.
2. The figures for FY1984 and the subsequent years are based on the reported data pigeonholing project associated with facillities which emit soot.
3. The figures for FY1982 and the preceding years are those as of January 1 of the given year, whereas those for FY1983 and the subsequent years are those as of March 31 of the given year.
(2) Countermeasures For Automobile Exhaust
Controls on nitrogen oxides emitted from automobiles have been gradually strengthened, but it has become necessary to lower emissions in major cities and other areas where the traffic volume of automobiles is great, so that there is the need to further promote comprehensive measures, including traffic controls, the improvement of the road struc- ture and so forth (for details, see Section 4).
In addition to those measures, a wide variety of projects which will contribute to improvements in the local air environment is being promoted with a fund established in the Environmental Pollution Health Damage Compensation and Prevention Association as the financial source. This association falls under the revised Law for the Compensa- tion of Health Damage by Environmental Pollution, which is to be referred to in Chapter 9, and attempts to prevent health damage caused by nitrogen oxides and other air pollutants.
(3) Measures Against Nitrogen Oxides in Major Urban Areas
Despite the implementation of the aforementioned various mea- sures we have just seen, the levels of air pollution caused by nitrogen oxides in major urban areas remain significant.
A check of the concentrations of nitrogen dioxide in three areas designated for areawide total pollutant volume controls on nitrogen oxides in fiscal 1991 indicates that the level of annual average values remained almost the same as in the preceding year and that the achieve- ment of environmental quality standards remained marginal with 47.3% for general air monitoring stations and 6.9% for road side air monitor- ing stations. A projection of the emission of nitrogen oxides by source of generation in those areas in fiscal 1985 indicates that the rate of emission from automobiles was significant in terms of weight, standing at 67% for Tokyo's Special Wards and other areas, 32% for Yokohama City and other areas and 47% for Osaka City and other areas.
Given those conditions, the Environment Agency formulated the Medium-Term Prospect of Measures Against Nitrogen Oxides in Major Cities in December 1985 and the New Medium-Term Prospect of Measures Against Nitrogen Oxides (hereinafter referred as "New Medium-Term Prospect") in December 1988. On the basis of the future prospect, the agency has been promoting systematic and comprehensive measures. On this basis at present, a wide variety of measures, including three centerpieces-measures on individual automobiles themselves, measures on automobile traffic and measures on stationary source--are being stepped up for early achievement of environmental quality stan- dards
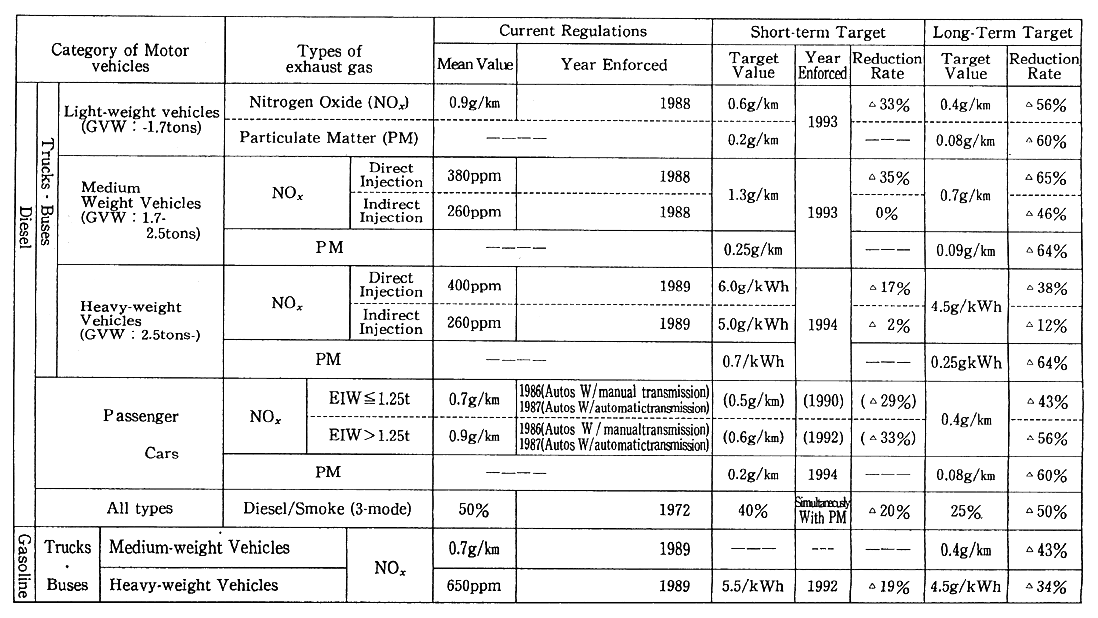
As regards measures on automobiles, the Central Council for Environmental Pollution Control came out with a recommendation in December 1989 regarding future policy for motor vehicle exhaust reduc- tion. In the recommendation, strict reduction targets were set for nitrogen oxides in two phases, a short term (less than five years) and a long term (less than 10 years) centering on Diesel-powered vehicles. Additionally, the recommendation called for technical modes of measur- ing automobile exhaust gas to reflect more on the actual driving condi- tions (Table 6-2-1). In line with this recommendation, the Environment Agency revised the permissible limits of motor vehicle exhaust emis- sions and the Ministry of Transport revised Safety Regulations for Road Vehicles in March 1991 to change test cycles in 1991 and achieve short-term targets from 1992 to 1994. It will also strive to attain long- term target values as early as possible while encouraging automakers, etc., to develop technology.
Table 6-2-1 Target Values of Permissible Limits of Exhaust Emissions
As for the promotion of substitution of low NOx emission vehi- cles, such as those satisfying the latest controls, and the introduction and dissemination of electric and other low-emission vehicles, active approaches are being made, using such approaches as preferential tax measures and the fund available under the Law Concerning the Compen- sation of Health Damage Caused by Environmental Pollution.
To reduce the amount of nitrogen oxides in major cities, it was decided that such measures as based on new concepts should be im- plemented in addition to repletion and strengthning of the measures which had been implemented, and the"Law Concerning Special mea- sures for Total emission Reduction of Nitrogen Oxides form Automo- biles in Specified Areas" was promulgated on 3 June 1992.
The law intends to protect the health of the citizens by achieving environmental quality standards for air pollution caused by nitrogen dioxide, and decides that a fundamental policy and plans for reducing the total volume of automobile emitted nitrogen oxides in specified areas where the air is considerably polluted by nitrogen dioxide must be formulated, and that nitrogen oxides emission standards for trucks, buses and so forth which are registered in such areas must be estab- lished. In addition, it lays down that guidelines for persons and enter- prises conducting business to rationalize the use of automobiles can be established.
In addition to those measures, the Provisional Measures Against Seasonal Air Pollution, which include the control of heating tempera- tures, curbs on the number of incoming and outgoing trucks and so forth, have been in force to cope with high concentrations of air pollu- tion in the wintertime. With December designated as Air Pollution Prevention Promotion Month, dissemination and enhancement activities for the prevention of air pollution are being made for a broad segment of the people, such as by promoting the utilization of public transporta- tion.
6-2-3 Suspended Particulate Matter
Particulate matter in the atmosphere is roughly classified into "falling dust" and "suspended dust," and suspended dust is further sub-classified into suspended particulate matter with a particulate diameter of less than 10 micrometer, for which environmental quality standards are set, and other suspended particulate matter. The genera- tion sources include industrial activities, such as factories and business establishments; trips by motor vehicles; the natural environment, includ- ing the entrainment of soil particles by the wind; and so forth. In regard to dust generated in conjunction with industrial activity, such as fac- tories and business establishments, particulate matter which comes out due to the combustion of fuels and the like or the use of electric power as a heat source is designated as "soot and dust". Particulate matter which comes out in conjunction with materials crushing and sorting and other types of mechanical processing or storage are designated as "dust" for regulatory purposes. On particulate matter which comes out due to motor vehicles, controls are exercised as "particulate matter" (black diesel smoke).
(1) Measures Against Suspended Particulate Matter
Environmental quality standards were formulated on suspended particulate matter in May 1973. Thought it has improved, the achieve- ment rate remains low, and it is now an urgent task to establish measures. For this purpose, starting in fiscal 1989, the prevailing condi- tions of pollution were analyzed and studies conducted on improvements in the precision of prediction methods and study meetings on methods to reduce, suspended particulate matter were held to formulate measures that should be taken in the future. In September 1990, the prevailing state of pollution was defined and future issues were sorted out in the form of an interim report.
As regards particulate matter contained in motor vehicle exhaust, the strengthening of controls on diesel smoke and new controls will be put into effect in 1993 and 1994 on particulate matter in line with the short-term targets specified in the recommendation made by the Central Council for Environmental Pollution Control in December 1989. Furthermore, studies have started towards reaching an early achieve- ment of the long-term targets (see Table 6-2-1).
(2) Measures Against Soot and Dust and General Particulate
When it comes to soot and dust, emission standards are set based on the type and size of facilities. Special stricter emission standards are set for new and modified facilities in areas where facilities are concen- trated and where the levels of pollution are significant. In November 1990, natural gas engine and gasoline engines were added to the list of controlled sources, and the controls were into force in February 1991.
In regard to general particulate [other than "special particulate" (asbestos is designated as such under an administrative ordinance)], standards are set on the lay out, handling/use and management of general particulate generating facilities, such as stockpiles and conveyers.
6-2-4 Measures Against Air Pollution Caused by Studded Tires
In recent years, the air pollution caused by dust, generated by motor vehicles equipped with studded tires has posed serious social problems in snowy and cold areas.
In light of this situation, "Studded Tires Regulation Law" was promulgated and put into force in June 1991. In this law, it is prescribed as a duty for the people to prevent such dust from being generated. It is also stipulated that the State and local governments shall promote and implement related measures, such as arousing public concern on the problem, supporting development of substitute tires, improving mainte- nance of roads and instructing winter driving skills, and that the use of studded tires shall be regulated in the areas which are to be designated by the Director-general of the Environment Agency.
The Environment Agency has prepared and distributed the "Administrative Manuals", brochures and posters, to help local govern- ments implement related measures for society without use of studded tires.
Local governments has designated December as "Month for the Promotion of the Studded Tire Elimination Campaign". A wide variety of activities has evolved under the sponsorship of the Administrative Liaison Council on Studded Tire Problems, formed by 23 affected prefectures, and the Promotion Council for City Without Use of Studded Tires, established by 198 cities, with the support of the Environment Agency and six related ministries.
In December 1990, an administrative ordinance was promulgated to list motor vehicles, for which the prohibition of the use of studded tires is exempted. The Environment Agency began in January 1991. to designate areas where the use of studded tires would be regulated (788 municipalities in 18 prefectures as of March 1993).
In November 1991, another administrative ordinance was promul- gated to designate as March 31, 1993, the grace period during which the enforcement of regulations on the use of studded tires by large-size vehicles will not occur.
6-2-5 Photochemical Air Pollution
The concentrations of photochemical oxidant are in excess of environmental quality standards in almost every district of the nation. Now that the conditions are such that warnings are issued, depending on meteorological conditions, there is the need to understand accurately changes in the degree of pollution and take appropriate measures.
(1) Emergency Measures Against Photochemical Air Pollution
In order to get meteorological data to judge whether to issue warnings or not, the Environment Agency is carrying out the meteoro- logical observations at four points on Tokyo Bay and Osaka Bay, where photochemical air pollution tends to occur in the summertime, and offering meteorological information to related local governments. The Meteorological Agency analyzes and forecasts meteorological condi- tions, under which photochemical air pollution tends to take place, at 19 meteorological observation of Meteorological Agency across the nation, reporting to local governments. And in case of necessity, the Meteoro- logical Agency announces meteorological information concerning photo- chemical air pollution to the public. On the basis of that information and the data from monitoring stations, local governments issue warnings in accordance with the Procedure on Emergency Measures Against Photo- chemical Oxidants, call on persons responsible for the emission of soot and smoke to cut back emissions and on motor vehicle drivers to refrain from making unnecessary car trips, and conduct public-information activities and health care measures for residents.
(2) Measures for Curbs on Emission of Hydrocarbons
a. Measures for Curbs on Emission of Hydrocarbons from Stationary Sources
In July 1982, the Environment Agency produced a policy docu- ment "Promotion of Measures Against Hydrocarbons for the Preven- tion of Photochemical Air Pollution". In accordance with this policy, the agency made necessary calls to local governments and other related institutions for the promotion of measures to reduce hydrocarbon emissions.
b. Curbs on 'Emissions of Hydrocarbon from Motor vehicles
Controls began in 1970 on hydrocarbons emitted from motor vehicles. In the case of gasoline and LEG passenger cars, emissions per car are down 92% from the years when no controls were exercised.
(3) Surveys and Studies of Photo chemical Air Pollution
The surveys made of photochemical air pollution cover abroad range of subjects, such as mechanisms for photochemical reactions, meteorological effects produced by drift and dispersion, actual emission of causative substances,photochemical air pollution forecast models incorporating those factors and the effects produced by photochemical oxidant on plants.
6-2-6 Other Air Pollutants
(1) Measures Against Asbestos
Asbestos excels in heat resistance and other properties so that it is used for many products. Because of its carcinogenicity and other toxicity, it is an urgent task to take measures for the prevention of air pollution and effects on man's health. The Environment Agency began surveys and studies in 1975.
As a result, it was learned that there were cases in which concen- trations tens to hundreds of times higher than in the normal environ- ment (with the highest mean of average values by monitoring point) were monitored along the fence lines of some factories manufacturing asbestos products. As the risks of lung cancer and malignant mesoth- elioma become high in cases where such concentrations continue in the future, it has been found that there is a need to reduce concentrations to the level where the World Health Organization (WHO) describes as being so low that the risks of lung cancer and malignant mesothelioma cannot be detected.
In response to a recommendation of the Central Council for Environmental Pollution Control, the Law for the Partial Revision of the Air Pollution Control Law was promulgated in June 1989 and put into force December 27 of the same year.
In the law, asbestos and other particulate which are likely to bring about damage on man's health is defined as "special particulate" and shearers and other dust generating devices as "special particulate generating facilities." Controls under the Air Pollution Control Law apply to factories equipped with those facilities which manufacture asbestos products and other substances.
In addition, since fiscal 1990. fact-finding surveys have been made on the dispersion of asbestos from the repair and demolition of build- ings.
(2) Measures Against Harmful Substances
Under the Air Pollution Control Law, (1) cadmium and its com- pounds, (2) chlorine and hydrogen chloride, (3) fluorine, hydrogen fluo- ride and silicon fluoride and (4) lead and compounds are controlled as "harmful substances" emitted from soot and smoke emitting facilities in addition to nitrogen oxides. Particulate matter, emitted at soot and smoke emitting facilities for other reasons are controlled simply as "soot and dust."
(3) Measures Against Uncontrolled Matter
From the standpoint of preventing air pollution, substances are chosen from uncontrolled substances of the kind about whose toxicity there is concern and studied for emission concentrations, impacts on the environment and other factors. Continuous monitoring has been con- ducted every other year on asbestos since fiscal 1985, formaldehyde and dioxins since fiscal 1986, mercury since fiscal 1987, and organochlorine solvents since fiscal 1990.
And "Working Group of Measures for Chloriscated Organic Conpounds" was established in March 1990 to evaluate lealth effects and find measures for their emission control.
Also concerning a wide variety of air pollutants, a list was prepared of substances to be dealt with on a priority basis. For these pollutants, systematic efforts will be made, such as the expansion of monitoring and the strengthening of studies on health effects.
(4) Activities for Dissemination and Propagation, Etc.
Nowadays the role local residents should play themselves for conservation of the local environment has increased. In order to increase opportunities for them to come in contact with, and reassess their views about, their near-by environment, nationwide "star watching network" programme was started in fiscal 1988 by the initiative of the Environment Agency In the summer of 1992, observations were done by 7,186 persons of 247 groups (from 47 prefectures, 9 designated cities and 213 municipalities) to deepen the interest in the conservation of the atmosphere.
Also, "checks on the ability of trees to purify the atmosphere" were started in fiscal 1989 as one event during the Environment month, involving junior-high school students across the nation.
"Ambient Air Quality Guideline (tentative value) for Trichloro- ethylene and Tetrachloro-ethylene (Under 250 fÊg/m3 in yearly average value for Trichloro-ethylene and Uuder 230 fÊg/m3 in yearly average for Tetrachloro-ethylene)"or desirable level for protection of human health was established in April 1993.
Then "Tentative Guideline for Countermeasures against emmis- sion into the Air of Trichioro-ethylene and Tetrachloro-ethylene" was provided and the actual state of emission on these substances have had to be grasped through prefectural govenors and mayers of government ordinance assignment cities.
6-3 Development of Monitoring and Surveillance System
(1) National Air Monitoring Network
National air pollution monitoring stations and environmental atmospheric monitoring stations are operated for the surveillance of air pollution. The location of the air monitoring network is shown in Fig.6-3-1. Air pollution monitoring stations are established in 15 major areas across the nation. Incidentally, in conjunction with the 1991 eruption of Mt. Unzen Fugendake, the Unzen South Monitoring Station was estab- lished in August 1991 for the surveillance of environmental effects on nearby residents. National environmental atmospheric monitoring sta- tions are established at eight places to understand the conditions of areas other than those already polluted in Japan's typical plains.
Fig. 6-3-1 Location of State-Established Air Monitoring Stations
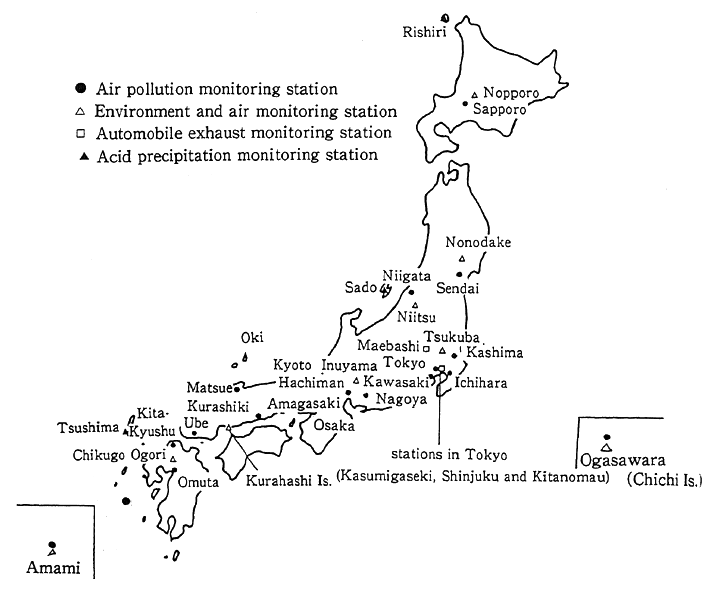
It was also decided to establish acid precipitation monitoring stations on offshore islands under a three-year program which started in fiscal 1989. They were established on Oki and Tsushima in fiscal 1989. Rishiri and Sado in fiscal 1990, and Ogasawara (Chichijima) and Amami Oshima in fiscal 1991.
National automobile exhaust monitoring stations are established at three locations in Tokyo and also in Maebashi City, Gunma Prefec- ture.
(2) Local/Municipal Air Pollution Monitoring System
At the prefectural/local level, the continuous surveillance and monitoring of air pollution is conducted by the governors of prefectures and the mayors of administrative ordinance-designated cities in accor- dance with the Air Pollution Control Law. In addition, it is also done by other local governments.
Continuous monitoring is under way for sulfur dioxide and the quantity of fuels utilized at air pollution emission sources, and telemetry systems are urban development by some local governments for the findings of those surveys will be transmitted to the central surveillance center.
6-4 Transportation Pollution--Present State and Measures
6-4-1 Comprehensive Promotion
(1) General State of Transportation Pollution Issues
a. The high and diversified development of various means of trans- portation in Japan has brought about much social efficiency, on the one hand, and on the other, had led to the occurrence of pollution in areas around large-scale transportation facilities. The traffic volume has increased in major cities due to the concentration of population and industry and other factors, making it all the more difficult to solve traffic problems.
b. In order to cope with those problems, measures against sources, on the organization/layout of traffic facilities and measures for sur- rounding areas have been taken, but there remain areas in which it will be difficult to solve problems unless further measures are comprehen- sively promoted.
(2) Comprehensive Promotion of Transportation Pollution Measures
a. Exhaust, noise and vibration of motor vehicles have become problems, and there is the need to address further measures against nitrogen oxides and other exhaust gases and noise and vibration.
b. When it comes to measures against aircraft noise, there is the need to promote measures that have been taken against sources arid the structure of airports with a view to meeting environmental quality standards. In areas where those measures were not good enough, it is necessary to promote systematic land use around airports (in addition to noise insulation work) for the arresting of noise for dwellings and other measures for the prevention of hazards.
c. In regard to measures against the noise and vibration caused by Shinkansen bullet trains, there is the need to comprehensively promote measures against noise sources, those for the prevention of hazards and systematic land use along the railroads.
Particularly regarding the noise caused by Shinkansen bullet trains, environmental quality standards are not satisfied the way they should. The following measures are to be taken for an early attainment of the environmental quality standards:
(A) Basic Measures against noise sources
(B) In areas where environmental quality standards are exceeded,promote noise insulation work which prevents noise at nearby residences.
(C) Development and use of technology for reduction in noise levels
(D) Promote Proper land use in areas along railway lines (curbs on land use for new dwellings, location of public facilities which are less likely to be functionally affected by noise, and so forth)
d. Nitrogen Oxides and sulfur oxides exhausted from ships are not controlled at present, but studies on international control measures are under way at the International Maritime Organization (IMO) with a target of adopting some measures in 1996. In Japan as well, exhaust reduction methods are being studied to meet the international trends by grasping the actual state of exhaust from ships, and trends of exhaust reduction technologies, etc., in view of the possibility that air pollution caused by ships may become unignorable in cities along big harbors in future.
6-4-2 Measures Against Road Traffic Pollution
(1) Present Situation
a. In the process where Japan has developed into a sophisticated economic society, the concentration of population and industry and rapid motorization have evolved. A check of changes in the ownership of motor vehicle indicates that it rose about 3 times to 62.7 million at the end of fiscal 1991 from about 21.2 million registered in fiscal 1971 (Fig. 6-4-1). As things now stand, there are no signs of a slowdown in the evolution of motorization. Especially in major cities and urban areas along trunk roads which form arteries of motor vehicle traffic, prob- lems have been posed about air pollution, noise and vibration due to automobile traffic.
Fig. 6-4-1 Trends in Number of Automobiles Owned
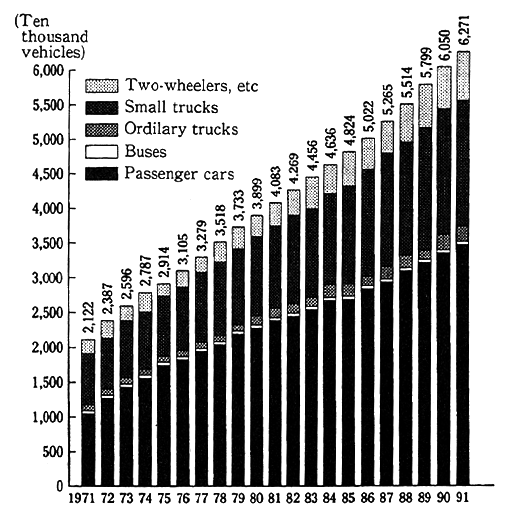
Remarks: 1. Prepared on the basis of the Ministry of Transport's "Statistical Yearbook on Land Transportation."
2. The passenger cars include light passenger cars.
3. The small trucks include light trucks.
b. The findings monitored by road-side air pollution monitoring stations are shown in 6-1. As regards nitrogen dioxide, in particular, there remain many monitoring stations where concentrations exceed environmental quality standards, centering on those in major urban areas, suggesting that the improvements are not the way they should be (Table 6-4-1).
Table 6-4-1 Achievement of Environmental Quality Standards for Nitrogen Dioxide at Automobile Exhaust Monitoring Stations in Major Urban Areas (3 Areas with Areawide Total Pollution Load Controls) (FY 1991)

Remarks: Surveyed by the Environment Agency.
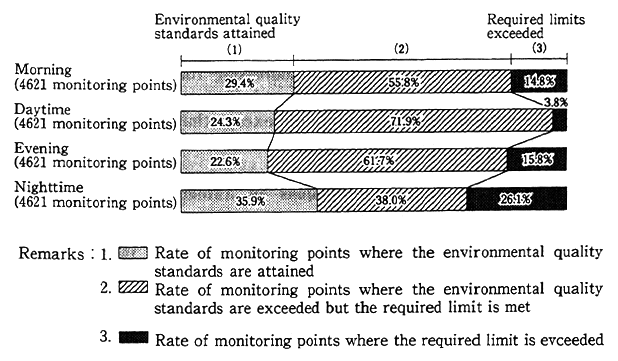
c. A check of the findings monitored at 4,621 monitoring stations in regard to motor vehicle noise suggests that environmental quality standards for noise are achieved at 629 monitoring points (13.6% of all monitoring points), and that the required limits were exceeded (speci- fied in Paragraph 1, Article 17 of the Noise Control Law) at 1,472 monitoring points (31.9% of all monitoring points). (Fig. 6-4-2). The cases where environmental quality standards are achieved and those where the limits are exceeded are shown in Fig. 6-4-3, classified by area. In the Class II category areas, where it is necessary to maintain quiet in residential areas, the rates of achieving environmental quality stan- dards were particularly low. The rates classified by hour are given in Fig. 6-4-4. At night, the rate of achieving environmental quality stan- dards is high but, conversely, that of monitoring points where the monitored values are in excess of the required limits is also high. Incidentally, the achievement of environmental quality standards and the degree of exceedance above the required limits have worsened year after year (shown in Fig.1-1-14, Chapter 1, Part 1). Centering on major cities and urban areas along trunk roads which form arteries of automo- bile traffic, in particular, there remain many areas where the noise is so significant as to exceed the required limits. (Fig. 6-4-5).
Fig. 6-4-2 Attainment of Environmental Luality Standards and Excesses over Required Limits (FY1991)
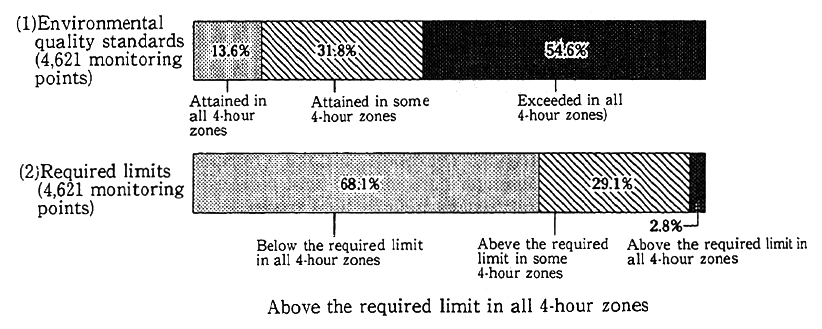
Fig. 6-4-3 Achievement of Environmental Quality Standards and Excesses over Required Limits by Area (FY1991)
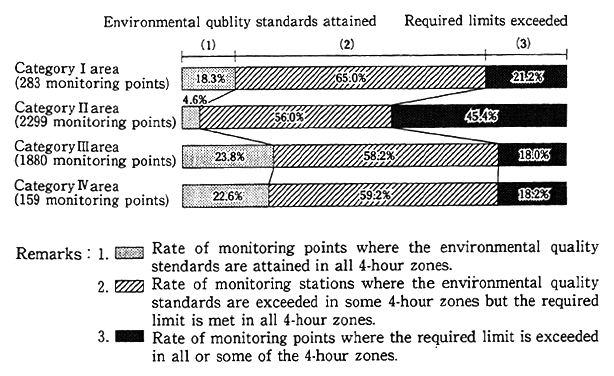
Fig. 6-4-4 Attainment of Environmental Quality Standards and Excesses over Required Limits by Hour (FY1991)
(2) Trends in Counter Measures
a. Environmental Quality Standards and Measures
In accordance with the provisions of the Basic Law for Environ- mental Pollution Control, environmental quality standards are deter- mined for air pollution and noise. In order to achieve those standards, comprehensive measures are being implemented for the prevention of road traffic pollution.
Air Pollution and Noise Control
* General Director of Environment Agency
Determine the quantity of motor vehicle exhaust and the tolerable degree of noise in accordance with the Air Pollution Control Law and the Noise Control Law
* Minister of Transport
Assurance of permissible limits in accordance with the standards for the safety of road transport vehicles under the Road Transport Vehicles Law
* Prefectural Governors
In cases where measured levels are in excess of certain limits, prefectural governors require Prefectural Public Safety Commissions to take measures under the Road Traffic Law. Prefectural governors also set forth their views to road managers and so forth on road improvements (Table 6-4-2).
Table 6-4-2 Demands and Opinions on Automobile Nosise Under Noine Control Law

Remarks: Surveyed by the Environment Agency
As regards vibration, it is stipulated that prefectural governors may be able to demand road managers and the respective Public Safety Commissions to take necessary measures.
Incidentally, no demands for addressing road traffic vibration have been made to road managers and Prefectural Public Safety Commissions in the last several years, except that one demand have been made to road manager in 1991 FY.
b. Measures
Fig, 6-4-5 Road Traffic Noise Countermeasures
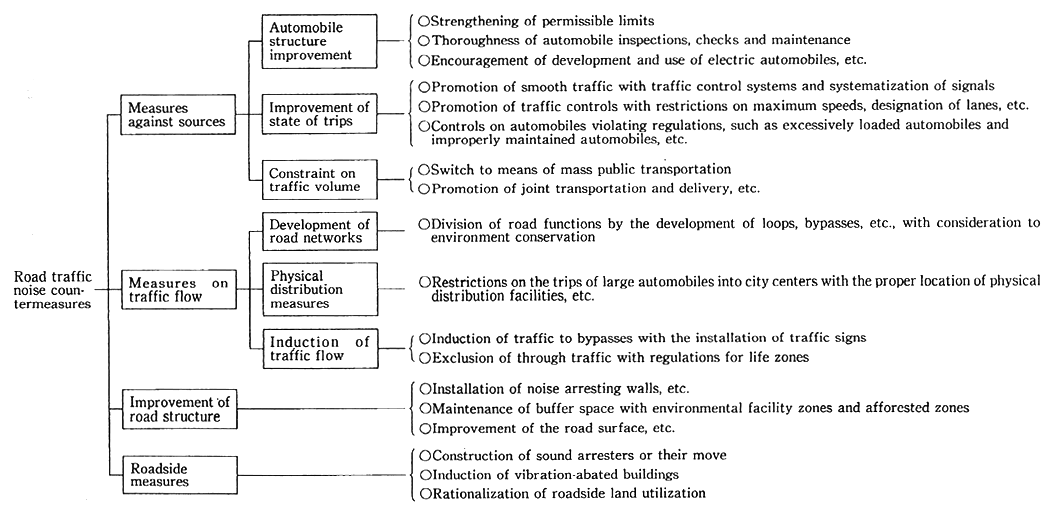
Remarks : Other measures include (1) Implementation of environment quality assessments for the construction and renovation of roads, (2) replenishment of monitoring and surveillance systems, (3) Promotion of the development and research of technology for noise prevention, (4) development of new transportation systems, (5) enlightenment activities for rationalization of the use of automobiles, etc.
There has been little improvement in the air pollution, caused by nitrogen oxides in major cities, because the impacts of each motor vehicle regulations which have been long promoted, have been offset by increases in the volume of motor vehicle traffic and the ratio of diesel vehicles to trucks as a whole. Noise from motor vehicle is generated as a result of a complicated mixture of various factors, including the traffic volume, the types of passing vehicles, their speeds, the road structure and the land use of roadside areas, in addition to that which is generated directly from motor vehicles themselves.
It is necessary to formulate and implement those measures against road traffic pollution in a comprehensive manner (Fig. 6-4-5). For the time being, there is the need to promote measures in the following direction:
(a) Measures Against Nitrogen Oxides and Other Exhaust Gases in Major Cities
(A) Measures on Motor Vehicles Themselves
* Further strengthening of regulations on motor vehicle exhaust emissions
* Prompt switch to less-polluting vehicles satisfying the latest control standards
* Studies on, and development and propagation of practical low-emission vehicles, such as electric vehicles and methanol vehicles
(B) Measures for Automobile Traffic
* Curbs on trips by trucks with improvements in the efficiency of goods transport
* Curbs on the use of passenger cars, such as by the development of mass transport
* Dispersion and smoothing of traffic, such as by the construction of loop roads
(b) Measures Against Road Traffic Noise
(A) Subsidization of the noise insulation work for dwellings, band promotion of the redirection of large-size vehicles to bypasses, etc., and as well as conventional measures in areas with severe situation
(B) Curbs on total volume of automobile traffic with the rationaliza- tion of commodity distribution in major cities; curbs on the flow of large-sized motor vehicles into city centers by the reasonable location of commodity distribution facilities; the rational land use of roadside areas; and redirection of large-size vehicles to bypasses to prevent pollution in cities along major roads
(C) Enhancement on reasonable methods for the maintenance, con- trol and driving of motor vehicles, dissemination of less-noisy vehicles, and the development of various technologies for noise reductions
(c) Development of Systems for Promotion of Measures
From the standpoint of the establishment of systems of close liaison and cooperation among related ministries and agencies and the promotion and support of close approaches in communities with prefec- tural governments taking the lead, the following measures are being implemented in a comprehensive manner.
(A) Comprehensive Measures
* Notification to prefectures of methods to formulate comprehensive programs for the prevention of road traffic noise
* Surveys in model areas
* Utilization of environmental pollution programs
(B) Measures Against Nitrogen Oxides
* Promotion of measures based on the plan to reduce nitrogen oxides in the Tokyo-Yokohama and Osaka-Kobe areas
* Promotion of switch to vehicles satisfying the latest exhaust gas regulations, and the implementation of campaign activities against air pollution with the fund established in the Pollution-related Health Damage Compensation and Prevention Association (PHDCPA) under the Pollution-related Health Damage Compensation and Prevention Law.
(C) Promotion of Use of Low Emission Vehicles
* Monitoring surveys on trial use of electric and methanol vehicles by local governments
* National subsidies for promotion of use of low-emission vehicles as pollution patrol cars by local governments
* Subsidies from the fund in PHDCPA for promotion of use of electric vehicles and methanol vehicles
* Subsidies for trial production of hybrid buses
* Special measures for levying the motor vehicle tax and the automobile acquisition tax for electric vehicles, methanol vehicles and hybrid vehicles
* Holding of fairs featuring low-polluting cars at 10 places across the nation
* Trial production of high-performance electric scooters with subsidies from the fund in PHDCPA
* Use of low-polluting cars by the Environment Agency as official cars
* Preparing a guideline for controlling exhaust gases from methanol vehicles, especially concerning NOx and formaldehyde
* The Electric Vehicle Propagation Program formulated by the Electric vehicle Propagation Council
(d) Automobile NOx Reduction Law
On 3 June 1992, in consideration of the problem on air pollution in major cities, the "Law Concerning Special Measures for Total Emission Reduction of Nitrogen Oxides from Automobiles in Specified Areas" was promulgated to reduce the amount of nitrogen oxides emitted from automobiles.
The law determines the obligations of the State and entrepre- neurs to control air pollution by nitrogen oxides emitted from motor vehicles and calls for implementation of the following measures:
(A) Areas where pollution levels of nitrogen oxides are high, would be designated as special areas, and the State would formulate a policy for curbs on areawide total pollutant loads and the prefectural governors would formulate total-quantity reduction programs.
(B) Special standards for exhaust gas would be determined for trucks, buses and so forth, and for those which could not meet the standards, measures would be taken, such as the refusal to automobile inspection certificates.
(C) Measures would be taken to ask entrepreneurs and so forth to promote the reasonable use of motor vehicles.
(D) In addition, Necessary provisions will be prepared for a system of consultation, etc., with related institutions involved in the development and propagation of low-polluting vehicles, the offer of aid in going in for substitutes for automobiles and the formulation of areawide total pollutant load reduction programs.
The law was (is to be) enforced on 1 December 1992 except for the provisions concerning (B) and they are to be enforced on 1 December 1993. Under the provisions of the law, 196 cities, wards, towns and villages in 6 metropolis and prefectures (Tokyo, Chiba Prefecture, Saitama Prefecture, Kanagawa Prefecture, Osaka Prefecture and Cyogo Prefecture) were designated as "specified areas". On 26 January 1993 "fundamental policy for total volume reduction" was established by the Cabinet, and on 26 March 1993 the order of the Prime Minister' s office on "specified vehicles emission standards" and so forth were promulgated.
(3) Improvements in Motor Vehicle Structure
a. Measures Against Exhaust Gas
As regards nitrogen oxides emitted from motor vehicles, controls began on gasoline and LPG vehicles in fiscal 1973 and on diesel automo- biles in fiscal 1973. On gasoline and LPG passenger cars, controls were strengthened in fiscal 1978, coming out with a strict standard in which the emission should be reduced to less than one-tenth of what was emitted during the years when no controls had been exercised.
Controls on motor vehicles (such as trucks and buses) other than gasoline and LPG passenger cars were strengthened step by step in 1975, 1977 and 1979-83 after they were introduced in fiscal 1973-74.
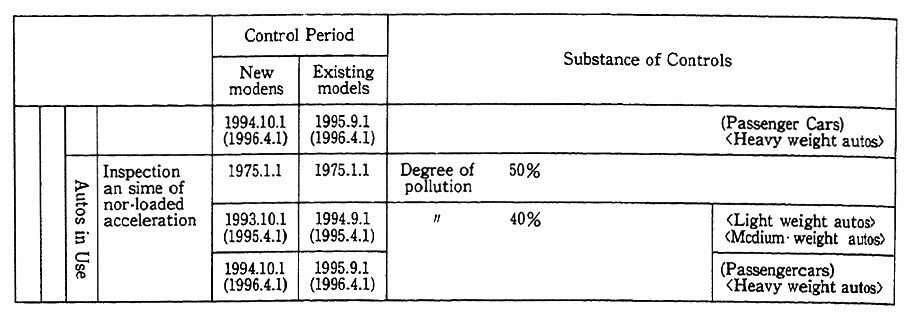
As regards the black diesel smoke emitted from diesel motor vehicles, controls (with the degree of pollution not more than 50%) put into force on new vehicles in 1972 and existing vehicles in use in 1975.
As we have just seen, controls on exhaust gas from motor vehicles have been strengthened step by step, but it is necessary to further reduce the emission of nitrogen oxides and particulate matter in major cities and other areas where traffic volume is significant. For this reason, controls had been strengthened by 1991, such as 15% reductions in the emission of nitrogen oxides from large-size diesel trucks and controls on light vans and other lightweight trucks of the sort which would correspond to passenger cars. Controls were also started on compact diesel vehicles in 1991 and mid-sized diesel vehicles in 1992 with 30% reductions in the emission of nitrogen oxides.
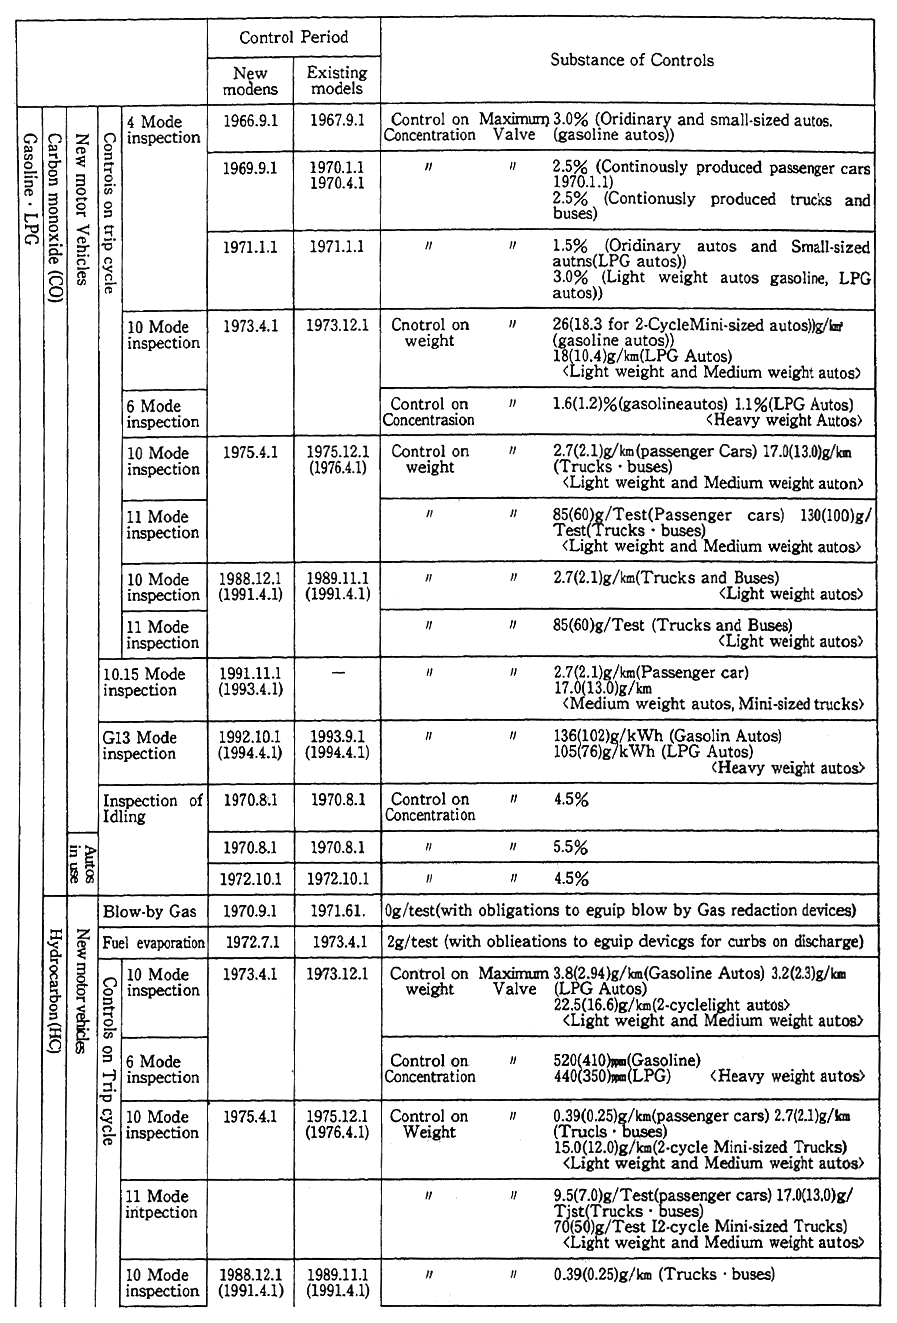
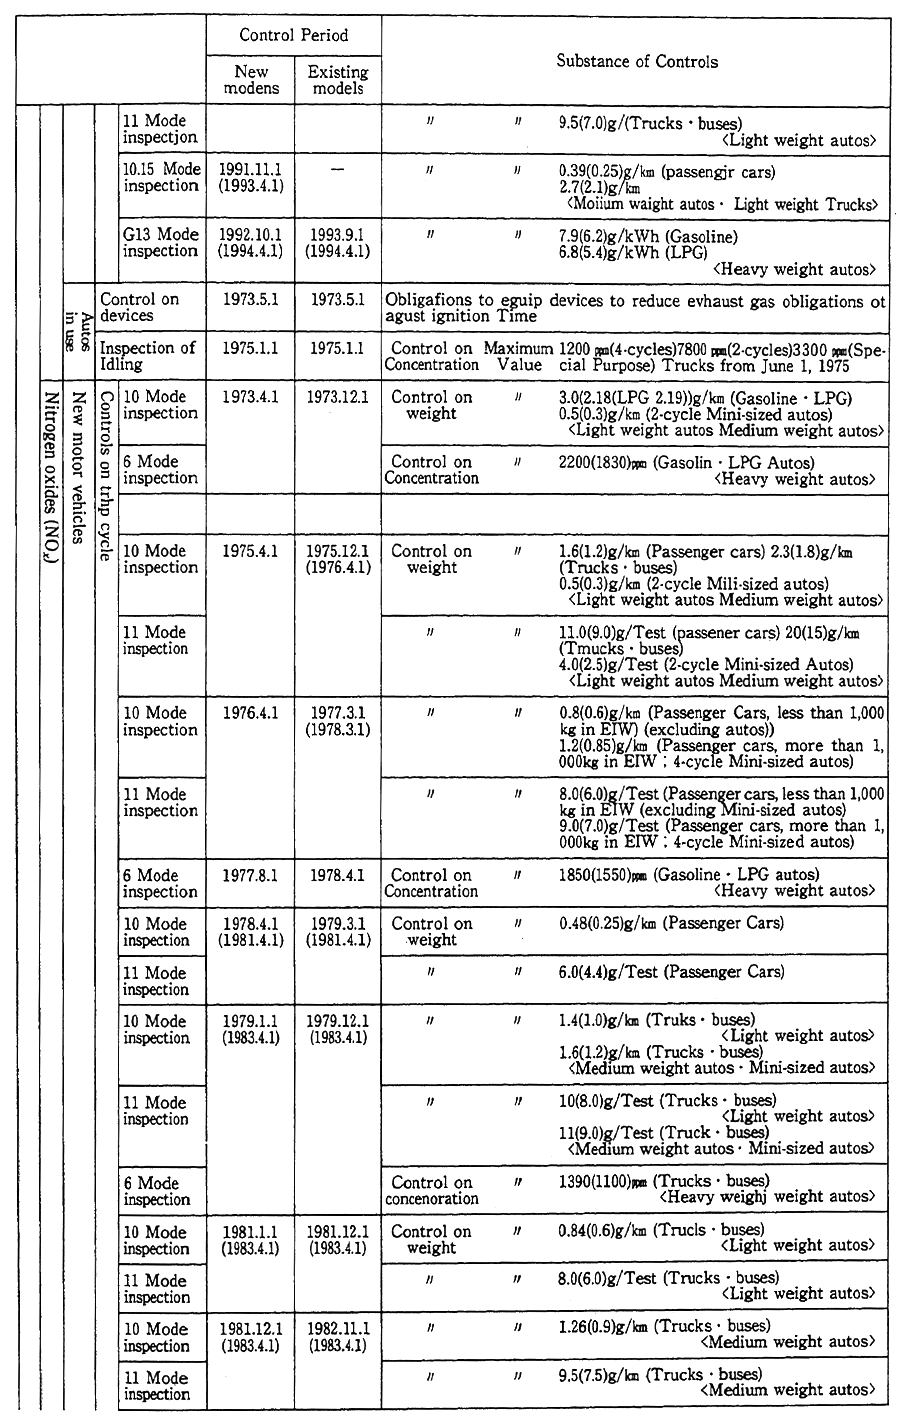
In December 1989, the following conclusive recommendation was prepared. It is stipulated that the contents of this recommendation shall be enforced with target values set for a short term (within five years) and a long term (within 10 years). (Tables 6-2-1 and 6-4-3)
Table 6-4-3 Controls on Automobile Exhaust Gas in Historical Perspective
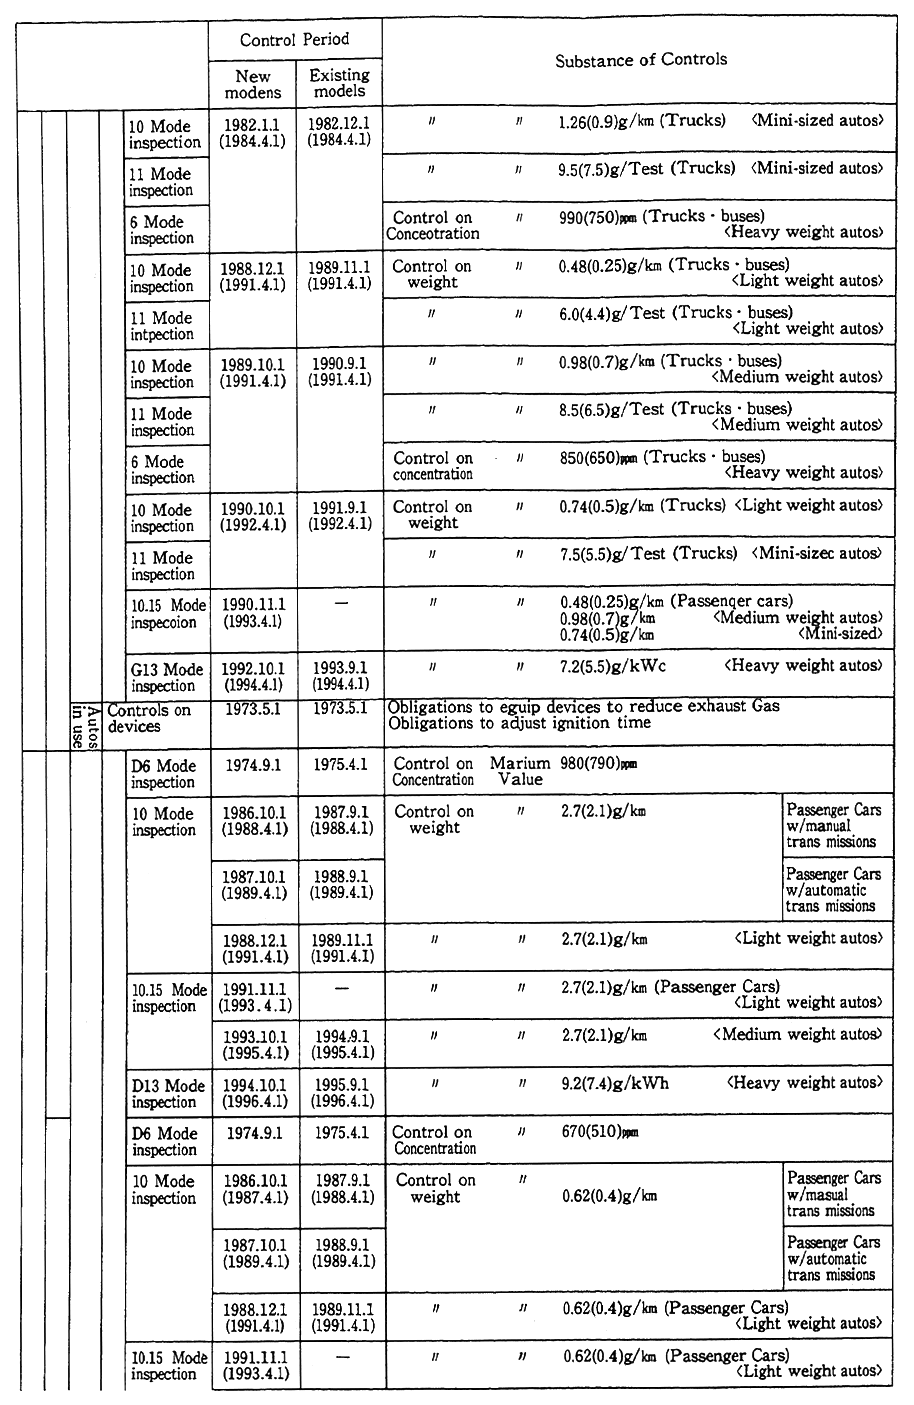
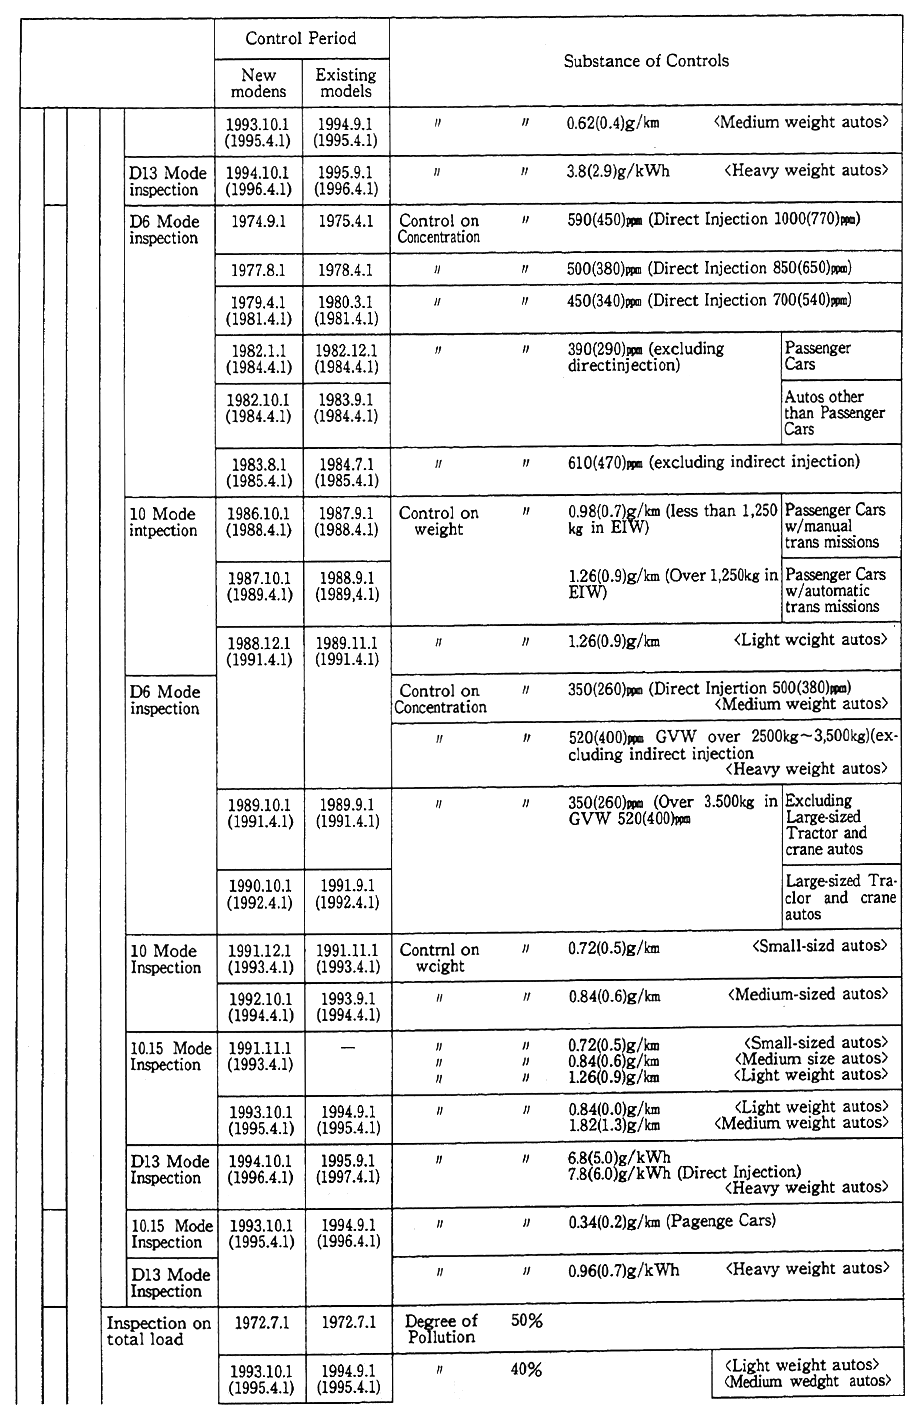
(a) Large Reductions in Emission of Nitrogen Oxides
(A) 30-60% reduction in the emission levels of nitrogen oxides from Diesel-powered vehicles
(B) Reduction of the emission level of the direct injection type to the level of the indirect injection type
(C) Setting of reduction targets designed to reduce Diesel-powered vehicles emission to the levels of gasoline vehicles
(b) Drastic Reassessment of Particulate Matter Countermeasures
(A) Reduction of more than 60% in the emission levels of particulate matter from Diesel-powered vehicles
(B) 50% reduction in the emission levels of black diesel smoke
(c) Reduction in Sulfur Content of Light Oil
Reduce sulfur content in light oil to a level of one-tenth or so of the convert content.
(d) Review of the driving cycle for exhaust emission test
In line with this report, the Environment Agency in March 1991 revised the permissible limits while the Ministry of Transport revised the Safety Regulations of Road Vehicles in order to enforce the stren- gthened control between 1992 and 1994--to fulfil the short-term targets set with the change of the driving cycle in March 1991. As for long-term targets, the Investigation Committee for Motor Vehicle Exhaust Emis- sion Control Technology established within the Environment Agency carried out hearings with automobile manufacturers, etc., and it made the second technical assessment in June 1992. As a result, it has been found possible that long-term targets will be achieved in about 1994 for gasoline-fueled medium-weight vehicles and in about 1995 for gasoline- fueled heavy-weight vehicles, and steps are being taken to strengthen the control. As for diesel-powered vehicles, there has been some prog- ress observed in technological development efforts but there still remain technical problems unsolved, and it was found difficult to predict at this present stage any concrete timing of the fulfilment of targets. The long-term targets were shown as the ones to be attained in 10 years at the most after the report is submitted but it is expected that the targets will be achieved at as early a stage as possible with encouragement to be given automobile manufacturers and others, and technical assess- ments to be continuously conducted.
As for vehicle exhaust emissions of which those not controlled at present, a study group has been formed within the Environment Agency and surveys of the actual state of exhaust emissions have been initiated with a view to looking into the necessity of controlling exhaust emis- sions of those vehicles.
In order to reduce the content of sulfur in light oil and abandon outdated diesel trucks and buses and to encourage shift to trucks and buses which will satisfy the latest controls on exhaust gas, measures for tax cuts and various systems of low-interest loans have been added or newly established.
b. Measures Against Noise
As measures designed to reduce the magnitude of the noise generated by motor vehicles by improving their structure, automobile noise controls are in force for all motor vehicles and motorcycles. The noise controls are classified into three types--accelerated running noise which is the maximum from vehicles, steady running noise, which is generated during constant speed, proximity stationary noise which can be easily measured in the road-side.
Controls on new vehicles have been strengthened since 1971. Since the latest regulations are 6-11 dB stricter than those in 1971, it is expected that the noise level will fall as the use of vehicles which satisfy new controls spread. The proximity stationary noise controls, which represent a simple monitoring method on the road, were started in 1986. They are instrumental in controlling illegally altered automobiles.
In spite of such intensification of regulations, the compliance rate of environmental quality standards was still at a low level mainly in the areas along the major roads due to andincrease traffic, etc. As it was necessary to further reduce traffic noise, the Director General of the Environment Agency asked, in June, 1991, the Central Council for Environmental Pollution Control to deliberate on "The Future Policy for Motor Vehicle Noise Reductions" In November, 1992. the Council presented an interim report. As for the target values for permissible limits (accelerating running noise), it examined measures to reduce it to the largest extent possible by individual type of vehicle, and recom- mended to reduce the noise by 1 through 3 dB depending on the type of vehicle. This reduction of noise is equivalent to 21% to 50% reduction in terms of noise energy. On the basis of its recommendation, it has been decided to implement measures for reductions in the noise of motor vehicles themselves.
(4) Traffic Control
It is important, for the sake of reductions in the air pollution, noise and vibration caused by motor vehicle traffic, to direct and maintain traffic in a safe and smooth manner. The measures taken by police from the standpoint of road supervision for the prevention of road traffic pollution are as follows:
a. Measures for Arterial Roads
(A) Reduce number of departures and steps at intersection using the traffic control system, advanced traffic signals, improvement of func- tions for collecting and offering traffic information.
(B) Distribute and guide traffic flows using reductions in the number of departures and stops at intersections.
b. Measures in citiy areas
(A) Implement the "life zone regulation", traffic regulation in residen- tial area including off-limits to large sized motor vehicles and limits on the maximum speed.
(B) Shift to the use of public mass transit, such as by designating bus lanes and by introduction of the park and ride system.
(C) Introduce high-speed driving restraining system and regulate the driving with extremely high noise and speed
(D) Regulate overload vehicles
(5) Improvements in Road Structure and Roadside Environment
The measures as seen from the standpoint of the road structure are as follows:
(A) Diversion and smoothing of road traffic with the development of bypasses and loops
(B) Elimination of places with traffic congestion, such as by improve- ment of road structure and development of new transport system
(C) Research and development of new commodity distribution system which will utilize the space under arterial roads
(D) Development of environmental facility zones and noise arresters, planting trees along roads, improvement in road surface
The roadside measures are as follows:
(A) Sharing of costs for the construction of buffer structures, subsidi- zation of the construction of noise arresters and non-interest loans for land purchases by municipalities based on the program provided by the Law Concerning the Development of Areas Along Arterial Roads
Five routes with a total length of about 103 kilometers were taken up as subjects as of the end of fiscal 1992. Of them, projects were conducted for 63.3 kilometers in 26 districts, including 0.8 kilometer in Nerima Ward along the Haneda-Takaido-Iwabuchi Route (Loop No.8).
(B) Subsidization of the noise insulation work for dwellings surround- ing national expressways
The soundproofing for about 46,100 houses was done as of the end of fiscal 1992.
(C) Low-interest financing for construction of buildings helpful to improvement of the road-side environment since fiscal 1985
(D) Enforcement of Guidance and Control on Trucks with overload, Etc.
(6) More Efficient Commodity Distribution
The following measures are in effect for the formation of traffic systems which will not give rise to traffic pollution.
(A) Formulation of preferential tax measures and financial support measures necessary for development of the infrastructure to encourage a shift in transport from trucks to less-polluting means of mass transit, such as railway and shipping
(B) Encouragement of the use of business trucking which are superior in freight transit efficiency than owner operated trucks, and promotion of combined loading by business trucks
(C) Consolidation and reasonable location of warehouse complexes, truck terminals, etc.
6-4-3 Measures Against Aircraft Noise
The use of jet aircraft has raised the convenience of transport remarkably, on the one hand, and has posed issues about the noise of aircraft around airports. Particularly in conjunction with urbanization around airports, lawsuits were instituted for a ban on landings and take-offs at night and the reparation of damages, at Osaka International Airport and Fukuoka Airport, which are civilian airports, and Komatsu Air Base, Yokota Air Base, Atsugi Air Station and Kadena Air Base, which are defense facilities. The lawsuits other than that which are related to Osaka International Airport and Yokota Air Base have yet to be settled. As regards Osaka International Airport, the mediation was concluded and it was decided in December 1990 to retain the airport as a result of the adjustment of views between the mediators' group, which was formed by residents around the airport and other people, and the related local governments, and to continue implementing measures against noise.
(1) Establishment of Environmental Quality Standards
a. Environmental Quality Standards
The environmental quality standards (December 27, 1973), which would serve as the targets of various measures to prevent aircraft noise pollution, are so designed that the weighted equivalent continuous perceived noise level (WECPNL) is set, according to the classification of areas, at less than 70 for areas which are used only for houses and less than 75 for areas where there is the need to maintain a normal mode of life.
As of the end of fiscal 1991 the classification of areas had been made by prefectural governors for areas around 57 airports in 32 prefectures.
b. Achievement of Environmental Quality Standards
When it comes to airports and so forth for which the deadline for the achievement of environmental quality standards or for the achieve- ment of 10-year improvement targets came at the end of December 1983, the environmental quality standards had yet to be achieved with the exception of some of them. But there are signs of an overall improve- ment in areas around Osaka, Fukuoka and other airports from the time when the environmental quality standards were put into force, insofar as the noise was concerned.
As regards heliports and so forth whose numbers are increasing across the nation, there are many which are so small in scale that environmental quality standards cannot be applied. The Environment Agency notified local governments in September 1990 of a guideline which would contribute to environmental conservation.
(2) Measures Against Noise Sources
Insofar as measures against sources are concerned, the introduc- tion of less-noisy aircraft models and the implementation of operation systems with reduced noise are being promoted. These are basic and the most effective measures.
a. Introduction of Less-Noisy Aircraft Models, Etc.
A ban on the operation of aircraft whose noise exceeds prescribed levels has existed since 1975. Along with the introduction of less-noisy models (such as the B-767), the decommissioning of noisy aircraft is being stepped up. In principle, the operation of highly noisy models, such as B-707 and DC-8, was prohibited, in January 1988 and the last B-727 retired from domestic airlines in April 1990.
b. Controls at Take-offs and Landings
The following controls are exercised at take-offs and landings except emergencies.
(A) New Tokyo International Airport at Narita and Tokyo International Airport at Haneda
A ban on the take-offs and landings of jets from 11 p.m. to 6 a.m.
(B) Osaka International Airport
A ban on the take-offs and landings of jets from 10 p.m. to 7 a.m.
No schedules may be set for regular flights after 9 p.m.
Since October 19777 the frequency of take-offs and landings has been set at 370 times a day, including 200 times for jets for Osaka International Airport. In December 1988, an additional permit of jet take-offs and landings was set (50 times a day) as the YS-11s would be replaced by new jet models. This permit is a transitional measure until a new international airport of Kansai will open.
In May 1992, more additional permit of jet take-offs and landings was set at 50 times a day as the YS-11s replacement ay new jet model. This permit is to ad just for jets take-offs and landings to regional airports.
c. Flight Operations with Less Noise
Depending on conditions for the location of each airport, use of a specific running and air route by which less noise would be reached the ground, a chandelle method, a rapid climb method, a low-flap angle take-off and landing method and a delayed flap approach are adopted in order reduce aircraft noise.
(3) Measures for Areas Around Airports
For areas which will not be free from the noise caused by aircraft even when measures against noise sources are taken, some measures are taken in accordance with the Law Concerning the Prevention of Haz- ards Caused by Aircraft Noise in Areas Around Public Airports. With Tokyo International Airports at Haneda, Osaka International Airport, Fukuoka and 13 other airports included in those measures, the noise insulation works are subsidized for schools, hospitals, dwellings and other facilities for joint use. In addition, compensation for moves is made, green buffer zones are developed, and television subscription fees are subsidized under the Law (Table 6-4-4).
Table 6-4-4 Measures for Areas Around Airports Remarks: 1. Surveyed by the Ministry of Transport.
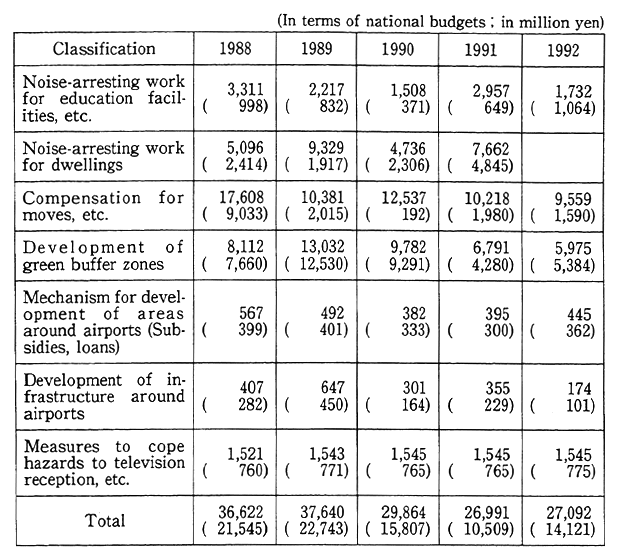
2. The figures in parentheses are the amounts of budgets for Osaka International Airport.
3. The expenditure for surveys are excluded.
Also for Osaka International Airport and Fukuoka Airport which are designated according to the above mentioned Law, the Organization for the Development Around the Airport carries out urban renewal projects, projects for the development of alternative sites and other projects, as their near-by areas are urbanized.
As a result of the execution of projects for surrounding areas, the noise insulation work for dwellings was almost completed in fiscal 1985, making it possible to retain indoor environment of the kind which is specified in the Environmental Quality Standards Associated With the Noise of Aircraft.
(4) Measures Against Aircraft Noise Around Defense Facilities
When it comes to aircraft noise in areas around airfields in use by the Self-Defense Forces and the U.S. Armed Forces, it is difficult to work for reductions in the engine noise in light of the essential function and raison d'etre of the Self-Defense Forces and the U. S. Armed Forces. The use of noise mufflers, controls on flight patterns and so forth are main measures. In measures against noise sources and those on opera- tions by the U. S. Armed Forces in Japan, cooperation is sought through the U. 5.-Japan Joint Committee, etc.
The surrounding-area measures associated with the airports in use by the Self-Defense Forces and the U. S. Armed Forces, center on the Law Concerning the Improvement of the Living Environment around Defense Facilities in subsidizing the noise insulation works for schools, hospitals, dwellings and so forth, compensating for the move of buildings, and subsidizing the land purchases, the development of green buffer zones and television subscription fees, among others (Table 6-4-5).
Table 6-4-5 Projects Associated with Measures Against Noise around Defense Facilities
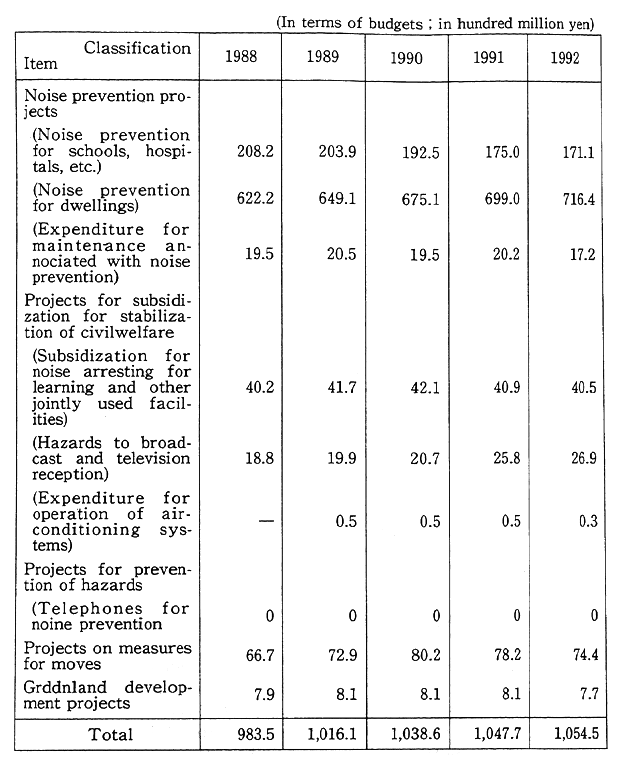
Remarks: 1 Surveyed by the Defense Agency.
2. The figures in the table include some of those for measures other than those against aircraft noise.
3. As each figure in rounded to the nearest whole number, they do not coincide is some cases with the totals in terms of fractions.
As of the end of fiscal 1992, the subsidization of the noise insula- tion works for dwellings and other measures were implemented for areas around 25 airports.
6-4-4 Measures Against Noise and Vibration of Shinkansen Trains
The Shiukansen system of bullet trains has developed as a means of high-speed mass transport since the Tokaido Shinkansen Line was put into operation in 1964. As regards the Nagoya area along the line, a lawsuit was filed in March 1974, in attempts to demand the stop of noise and vibration pollution and the reparation of damages. In April 1986, the case came to an amicable settlement, including a further promotion of measures against noise and vibration sources.
(1) Establishment of Environmental Quality Standards
a. Environmental Quality Standards
In the "Environmental Quality Standards Associated With the Noise of Shinkansen Trains" (July 29, 1985) which serve as targets for measures against the noise of Shinkansen trains, it is stipulated that the noise level shall be less than 70 dB for areas which are to be used primarily for housing purposes and less than 75 dB for areas which are to be used for commercial, industrial and other purposes, and that efforts shall be made for the achievement or maintenance of those levels.
It is also stipulated that the classification of trackside areas shall be made by prefectural governors,and it is clone by all prefectures (21) through which Shinkansen railway lines run.
The Government approved at its Cabinet meeting in March 1976 the Outline of Measures Against the Noise of Shinkansen Trains in which basic matters were stipulated. In conjunction with the decentrali- zation and privatization of the Japanese National Railways, the Cabinet once again approved the Promotion of Measures Against the Noise of Shinkansen Trains after the Reorganization of the Japanese National Railways in March 1987. As for the vibration generated by Shinkansen Trains in March 1976, the Director-general of the Environment Agency required the Minister of Transport on "Urgent Measures for Environmental Conservation to cope with Vibration by Shinkansen Trains."