Quality of the Environment in Japan 1993
(1) General Wastes
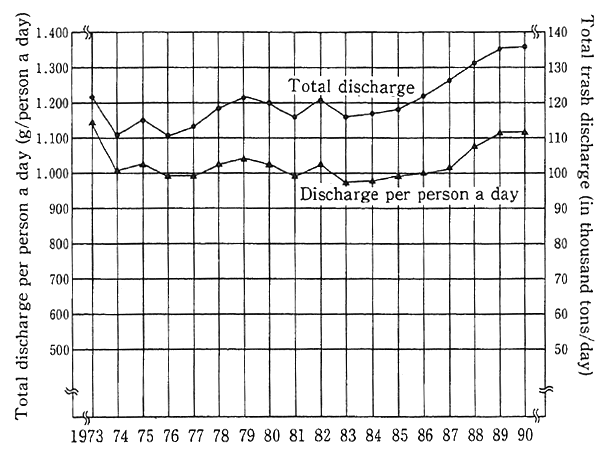
The volume of general wastes which are discharged in conjunc- tion with the everyday life came to about 50,440,000 tons in fiscal 1990 (about 49,970,000 tons in fiscal 1989), and the emission of trash per capita stood at about 408.8 kg (about 406.6 kg in fiscal 1989), both figures being higher than in the preceding years (Fig. 1-1-36). A check of trends in the emission of trash shows that it has been consistently on the upswing in proportion to the increase in standard of living. Though somewhat on the decline at the time of an oil crisis in 1973, there subsequently appeared signs of a rise in total emission. From fiscal 1985, the total emission rose by 16.1% and the per-capita emission by 13.6%. Given the diversification of life styles, the kinds of trash have become diverse, and problems are posed by large household appliances and other things difficult to dispose of.
Fig. 1-1-36 Trends in Total Trash Discharge and Per Capita Discharge a Day
Source:Ministry of Health and welfare
When it comes to the treatment of wastes, it is difficult to construct disposal plants, final ones in particular. Given an increase in the emission of trash, there is a rapid drop in the residual capacity of final disposal plants for general wastes. Particularly in the National Capital Region, including Tokyo, Kanagawa, Chiba, Saitama other prefectures, their final disposal of trash accounted for 24.5% of the national total in fiscal 1990. However, it is projected that unless new ones are prepared, the residual capacity of final disposal plants will go down to zero in a year or so (in a computation with the final disposal volume in the National Capital Region at 4,122,000 tons, the residual capacity at about 3,870,000 tons and the specific gravity of trash at 0.3). Given the growing difficulty of assuring space for disposal, it is an urgent task to reduce trash emissions and recycle and reuse trash. For this reason, the Law Concerning the Disposal and Cleaning of Wastes was amended in 1991, and a Law for the Promotion of Uses of Recycled Resources enacted, thus striving to encourage the utilization of recycled resources. Details on this matter are to be given in 4, Section 1, Chapter 4.
There has been a steady drop in the disposal of human waste for a long time, coming to about 36,210,000 kiloliters in fiscal 1990 (about 36, 870,000 kiloliters in fiscal 1989). This was because the shift to flush toilets had increased due to a rise in the number of people employing them. In recent years, incidentally, the interest in waste from human- waste disposal facilities from the standpoint of preventing water pollu- tion in waters for public use, and the development of sophisticated technology to cope with COD, nitrogen and phosphorus has been stepped up.
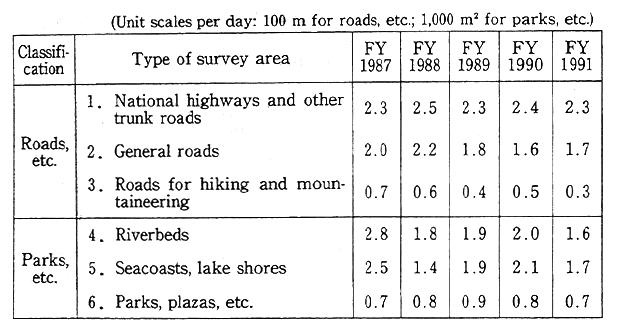
Beside trash collected as mentioned in the foregoing, there are many kinds of trash illegally thrown away. One of the problems broadly observed across the nation is the dispersion of empty drink cans. It is projected that about 30.9 billion empty drink cans were thrown away in fiscal 1991, up 6.5% from the previous fiscal year (about 29 billion cans). The central and local governments are taking various measures to prevent the dispersion of empty cans, but radical remedies have yet to be drawn up, making it necessary to come up with more aggressive measures (Table 1-1-11).
Table 1-1-11 Numbers of Empty Cans Dispersed
Source:Environment Agency
(2) Industrial Wastes
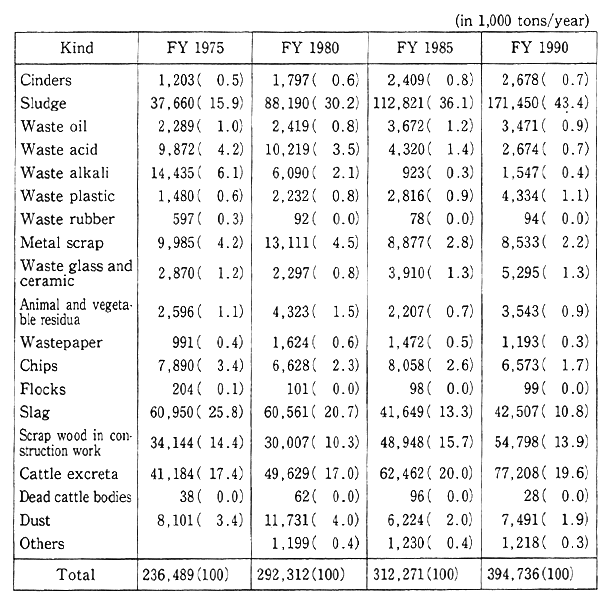
Industrial waste emissions in fiscal 1991 totaled 394,740,000 tons (Table 1-1-12), about eight times the total emission of household wastes in fiscal 1991. A check of rises in the total emission of industrial wastes indicates that the increase in fiscal 1985 was 26.4%, virtually the same as the rise of 26.3% registered in GNP that year, suggesting that the total emission of industrial wastes increased in proportion to the eco- nomic growth. Eventually, about 15,057 tons of the total emission of industrial wastes were recycled, the amount of final disposal coming to about 89,730,000 tons. The emitted items included sludge (43%), cattle excretions (20%) and waste construction materials (14%), among others. According to a survey performed once every five years by the Ministry of Health and Welfare on industrial wastes, sludge has significantly increased since fiscal 1975, whereas waste acid and alkali have de- creased. Similar trends were observed in fiscal 1991, too. In terms of emissions on a weight basis by line of business, agriculture came on top of the list with 20%, followed by the construction industry, electricity, gas and heat supplies, and the tap water service.
Table 1-1-12 Trends in Discharge of Industrial Wastes (National)
Source: Surveyed by the Ministry of Health and Welfare
Note:Tthe figures in brackets represent the shares in the total discharge.
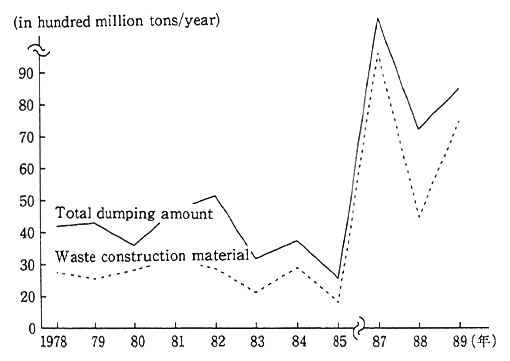
A wide variety of controls is imposed on the treatment and disposal of industrial wastes under the Law Concerning the Treatment and Cleaning of Wastes, and efforts are being made for their proper treatment and disposal. When those emitted industrial wastes, excluding that which is reduced in the intermediate processing phase or diverted for recycling, 23% of the total amount, or 89,730,000 tons, was subjected to the final disposal process. In recent years, the location of final disposal plants has become a grave issue. Particularly in the National Capital Region, the residual capacity of the final waste disposal plants was only 10,360,000 m3 in fiscal 1989, and many industrial wastes are disposed of in other prefectures. The shortage of final disposal plants is one reason for the illegal dumping of industrial wastes. In fiscal 1989, illegally dumped industrial wastes, centering on waste materials coming from construction work, amounted to about 870,000 tons across the nation (Fig. 1-1-37).
Fig. 1-1-37 Trends in Illegal Dumping of Industrial Waste
No data available for 1986
Source: National Police Agency
When it comes industrial waste emissions in foreign countries, a comparison is difficult to do as data on a uniform basis are not avail- able, but it is projected that in all OECD countries, for example, annual emissions stood at about 1 billion tons in the first half of the 1980s, rose to 1.3 billion tons in or around 1985 and reached 1.5 billion tons in 1990.
(8) Transboundary Movements of Hazardous Matter
Hazardous wastes tend to be moved from countries where the processing costs are high in cost to those with low processing costs or from countries with strict restrictions on disposal to those with lenient restrictions. Therefore, in situations where proper disposal is not done by countries accepting hazardous matter, there is a danger that it would affect their living environment or area's ecosystems.
A well-known example is the incident in which the soils polluted by dioxins generated in an explosion (in 1976) at a pesticide plant in Seveso, Italy, were found missing in 1982 but detected in a small French village the following year. There was yet another incident in which prospective ports of call refused to accept a ship loading 14,000 tons of incinerated hazardous ash in Philadelphia, the United States, and the ash was suspected as having been dumped in the Indian Ocean after drifting for a little more than two years.
In the case of Europe, the transboundary movements of hazard- ous matter did not extend beyond its regional boundaries in the first half of the 1980s. In the second-half of the 1980s, however, they began to rapidly encompass Africa and Latin America. In Japan, there were cases in which hazardous substances were internationally traded for the recovery of useful matter from wastes. Given such transboundary movements of hazardous matter in a global dimension, studies were made on the formulation of an international rule primarily by the United Nations Environment Programme (UNEP), and in March 1989, the Basel Convention on the Control of Transboundary Movements of Hazardous Wastes and Their Disposal came out in Basel, Switzerland.
The Basel Convention came into effect on May 5, 1992. In Japan, the Law Concerning the Control of Specified Hazardous Waste Exports and Imports was enacted on December 10, 1992, and efforts are being made for Japan's early membership to the convention and the implemen- tation of measures in this international framework.
1-1-9 Environmental Pollution in Developing Countries
In developing countries and regions, a wide variety of issues crop up, not the least of which is environmental pollution. Som of them might affect mankind as a whole. It is useful for an increasingly interde- pendent world economy to address those problems and e to it that developing countries will pursue environmentally sound economic devel- opment.
In least less-developed countries (LLDCs), poverty and increasing pollution leads to environmental disruption, which in turn accelerates poverty in a vicious cycle. In those developing, countries, however, there are cases in which they are so ardent for economic development that environmental conservation is not given due priority and environmental measures are not in tune with economic development. There are cases where industrialization is being stepped up without adequate environ- mental pollution prevention measures for factories and other facilities, and urbanization is being promoted without developed social overhead capital, thereby producing excessive loads on the environment and giving rise to air pollution, water pollution and other grave environmen- tal issues. In Eastern Europe and the former Soviet Union, moreover, it has come to light that they were plagued by air pollution, water pollu- tion and other grave environmental issues in a planned economy with production made for production's sake without consideration given to environmental conservation. Some of those environmental problems are of a transboundary nature, directly linked to pollution in a global dimension, taking on an increasingly grave character.
Many of the Asian countries, closely tied in with Japan, are industrializing rapidly. In those countries, industrialization- related environmental pollution is taking on. a serious character. Given the progress of industrialization, the emission of waste gas, wastewater and wastes from factories and other facilities is on the upswing, but timely environmental pollution prevention measures are not being taken due to the low priority given to environmental measures and the lack of consideration to the environment. Environmental issues such as air pollution by sulfur oxides and other chemicals, and by water and soil pollution are becoming more serious. Urbanization due to the inflow of rural populations and the development of means of public transport, hygiene facilities and other social overhead capital left inadequate, air pollution by pollutants emitted from autos, water pollution by miscella- neous household wastewater and other urban and livelihood types of pollution have become a grave issue. In those countries, tragically, the share of primary products in their exports remain so high that it is economically important to protect natural resources, but there are cases in which the worsening pollution by industrialization and urbanization produces adverse impacts on those very natural resources.
Here, let us see where the environment of developing countries, focusing on East Asian countries closely tied to Japan both in economic and environmental terms, stands today.
(1) China
With a population of 1,102,090,000, China was economically devel- oping at a real growth rate of 9-odd percent on the average in the latter half of the 1980s. The nation's GNP, which stood at $267,800 million in 1980, soared by about 47% to $393 billion in 1989, suggesting that China has made significant economic progress in recent years.
a. Air
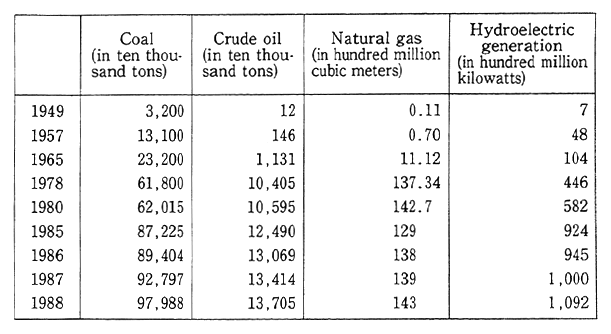
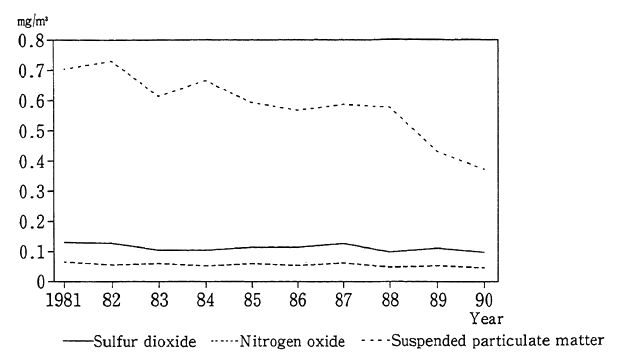
Energy consumption has also significantly increased in conjunc- tion with economic development. Standing at 387 million tons in 1980 in terms of oil, it soared by about 48% to 574 million tons in 1988. For much of the energy it needs, China relies on coal, abundantly produced at home (Table 1-1-13). Air pollution by sulfur dioxide and by dust and soot from coal combustion has become a grave issue. A check of trends in the annual mean of sulfur dioxide across China suggests that it has leveled off in the last several years, albeit with small fluctuations, and signs of a rise in recent years (Fig. 1-1-38). The annual national mean in 1990 was 0.098 mg/me (equivalent to 0.038 ppm), somewhat better than in the preceding year, and the levels of pollution have remained high.
Table 1-1-13 Output of Primary Energy in China
Source:China Energy Statistical Yearbook, 1989
Fig. 1-1-38 Trends in Annual Means of Air Pollutant Concentrations in China (Jntire Land)
Source: China Environmental Yearbook 1992
As it has been pointed out that the sulfur oxides emitted in China have something to do with acid rain in Japan. Surveys are under way at present.
Pollution by dust and soot is serious in China's northeastern cities where much coal is used by households for heating purposes. The fallout of dust and soot there is a little less than three times as much as in southern cities. A check of trends in the annual mean across the nation suggests that though it had virtually leveled off in the 1980s, it was improved by about 14% from 19 tons/km2/month from the preceding year (with the national mean registered at 22 tons/km2/month). The levels of pollution by suspended particulate matter are also higher in northern cities, and the annual mean of concentrations is roughly twice as high as in southern cities. In terms of trends in the national average value, there were signs of a slight improvement.
Pollution by nitrogen oxides is not so serious partly because the use of autos is not widespread. The national annual mean has leveled off in the last several years.
In China, environmental quality standards are formulated in three categories by area--Categories I, II and III. A check of compliance with environmental quality standards for each substance in 1990 sug- gests that the values of sulfur dioxide and suspended particulate matter exceeded the Category II environmental quality standards which were applied to residential areas, but when it comes to nitrogen oxides, the Category II environmental quality standards were satisfied.
b. Water
As for water pollution in China, the main pollutants are organic matter and ammoniac nitrogen. Besides, pollution by phenol, cyan and other chemicals is in progress. Those substances come mainly from industrial wastewater and miscellaneous household wastewater. A little less than 40% of industrial water and most of miscellaneous household wastewater are discharged into the environment without treatment. On the other hand, there have been signs of a decline in pollution by lead in recent years.
In a check of China's six principal rivers, the water quality of the Changjiang (Yangtze) River and its tributaries is relatively good, but there have been signs of a deterioration in recent years. The main pollutants are ammoniac nitrogen, COD, phenol and cadmium, among others (Table 1-1-14). The most polluted of the six rivers is the Daliao River, the main pollutants consisting of phenol, ammoniac nitrogen, COD and other chemicals.
The pollution of lakes and reservoirs around cities is particularly conspicuous. In addition to pollution by phenol, BOD, mercury and other chemicals, eutrofication by nitrogen and phosphorus is in progress, so is pollution by heavy metals, chemicals and organic pollutants from indus- trial wastewater. In the basin of Lake Songhua, a huge dam reservoir with a catchment of 1 billion in mining and chemical factories were established, with the consequence that lake water pollution by heavy metals is greater than in Japan's Kasumigaura and North America's lakes and reservoirs (Table 1-1-15).
c. Acid Rain
Table 1-1-14 Trends in Pollution of China's Six Longest Rivers
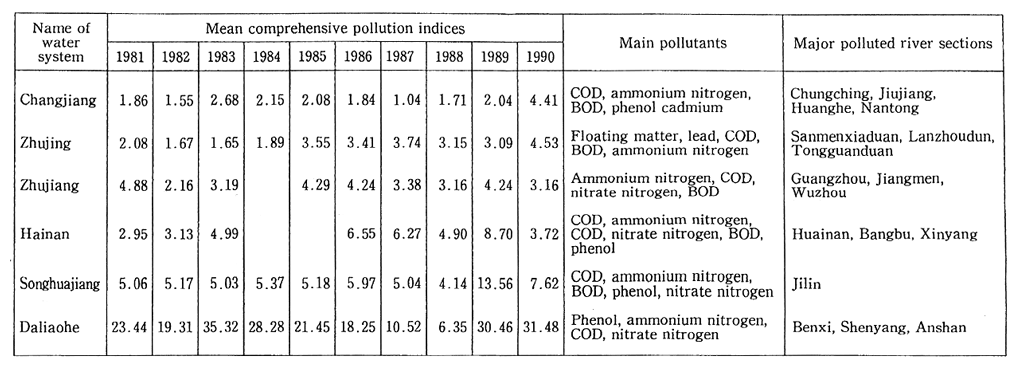
Note:The comprehensive pollution index is the index of a water assessment, and the greater the value, the worse the pollution.
Source:China Environmental Yearbook
In China, an acid rain survey (the first one) was performed from 1983 to 1984. The findings of the survey covering 189 cities and districts across the nation show that acid rain was detected in 45 cities. Presum- ably, sulfur oxides are primarily responsible for acid rain in China, and the emission of sulfur oxides from the combustion of coal and other fuels in 1989 is projected at 15,650,000 tons/year (with Japan's total emission at about 1 million tons/year). The content of sulfur in south- western China's coal is particularly high, the mean reaching 3.2%. The findings of an observation of acid rain in Chinese cities are given in Table 1-1-16. The cities where the mean of pH values in the rainfall is small are all situated south to the Yangtze River.
Table 1-1-15 Comparison of Heavy Metal Pollution Between Lake Songhua and Other Lakes
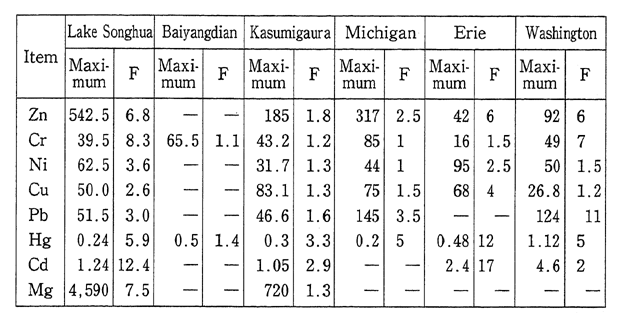
Note:F=C/Co (C: concentration in the lake water; Co: concentration in the background)
Source: Environment Agency
Table 1-1-16 Values of Acid Rain Monitored in Chinese Cities
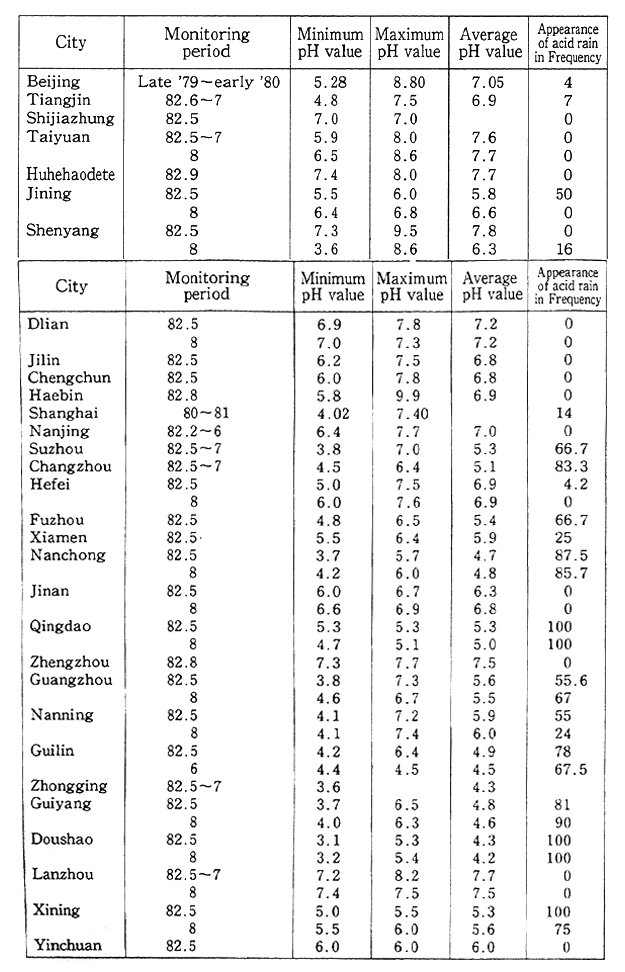
Source:According to a survey by the Chinese Environment Protection Bureau.
(2)Republic of Korea
Having a popu1ation about 42,380,000, the Republic of Korea economically developed at an average rate of 10.5% a year from 1985 to 1989 with GNP coming to $186.5 billion. Its economic growth is particu- larly high among Asian nations where the economic growth rate is high as a whole.
a. Air
In the Republic of Korea, energy consumption significantly rose from 36 million tons in terms of oil in 1980 to about 60 million tons in 1989 in proportion to its rapid economic development in recent years. Given this picture, air pollution by sulfur dioxide became a grave issue particularly in major cities. The Environment Ministry (an agency in those years) has implemented measures to encourage the use of oil containing less sulfur and LPG in major cities since 1981. As a result, there have been signs of a decline in pollution by sulfur oxides in major cities in recent years with the exception of some cities. But there still are cities where the level is in excess of the WHO guideline (with the annual mean at 40-60 μ g/m3, equivalent to 0.015-0.023 ppm), suggesting that the pollution is serious (Table 1-1-17). Incidentally, as regards sulfur oxides emitted in the Republic of Korea and other countries, surveys are under way on its drifts along the rim of the Sea of Japan.
Table 1-1-17 Sulfur Oxide Pollution in Major Cities in the Republic of Korea
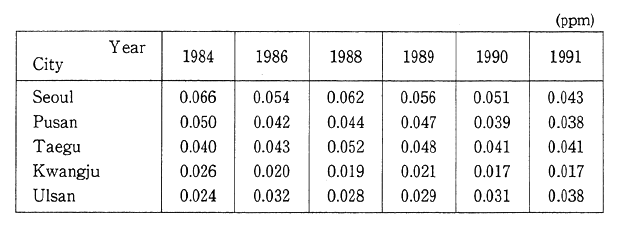
Source:Republic of Korea's National Report
Pollution by total suspended dust and soot has become a grave issue for many major cities. The primary reason is emissions from autos on trips and factories, among others which have increased in proportion to the nation's economic development. The levels of pollution have often been in excess of the environmental quality standard of 150 μ g/m3(the annual mean). Given this picture, the change of fuels, the strengthening of controls on fixed emission sources and other measures have been enforced, with the result that there have been significant improvements in the past several years. Yet the levels are in excess of the WHO guideline (60-90 μ g/m3), and the pollution is of serious proportions (Table 1-1-18).
Table 1-1-18 Pollution by Suspended Particulate Matter in Major Cities of the Republic of Korea
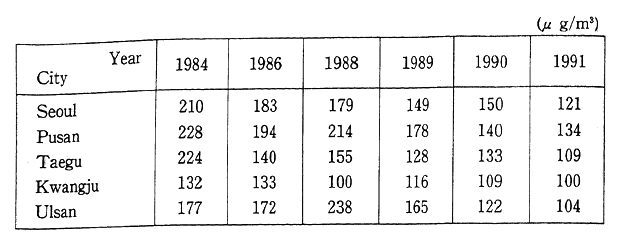
Source:Republic of Korea's National Report
As regards other pollutants, the use of non-lead fuels, curbs on emissions from diesel engines and other measures for autos and other generation sources have been stepped up, with the consequence that the levels of pollution by nitrogen oxides, ozone and carbon monoxide stay low.
b. Water
Due to rapid urbanization and ongoing industrialization, waste- water from factories and other facilities have greatly increased in the Republic of Korea, and the increase rate reportedly exceeds 20% a year. The heavy metals and other chemicals contained in the wastewater and the environmental loads boosted by the wastewater has given rise to pollution by heavy metals and other types of pollution. Given the evolution of urbanization, miscellaneous livelihood wastewater increases, but a delay in the development of disposal facilities and other reasons, the disposal of wastewater is insufficient, driving organic matter to pollute the water. In the survey conducted in 1989, it came to light that about 25% of the total volume of wastewater was treated. In a fairly large number of districts, tap water is polluted by heavy metals and other pollutants and found unsuitable for drinking water.
(3) Phillippines
Situated about 3,000 km southeast to Japan, the Philippines has a population of about 60,100,000 with its GNP coming to $42.8 billion in 1989. The average economic growth rate was 5.0% from 1985 to 1989. and efforts are being made for its economic development through industrialization.
a. Air
Table 1-1-19 Trends In Results of Monitoring of Suspended Particulate Matter in Metropolitan Manila
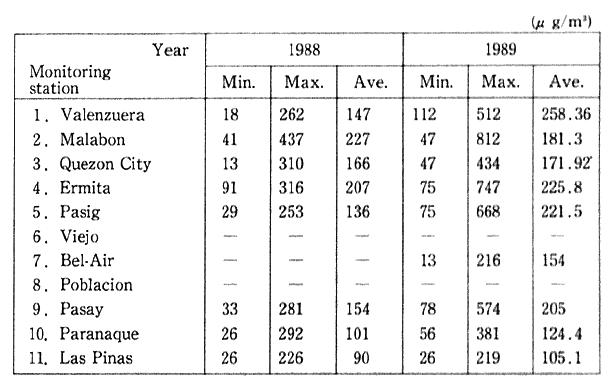
Source:EMB
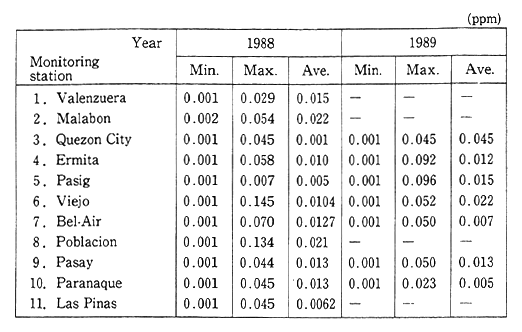
In Metro Manila, the Philippines' major urban area, total suspended dust and soot, sulfur dioxide and carbon monoxide were monitored at six stations as air pollutants, but the monitoring was suspended from 1983 to 1986 as the monitoring instruments were out of order. A comparison of the findings before 1983 with those after resump- tion of the monitoring indicate that the values of total suspended dust and soot monitored at four stations before 1983 had virtually leveled off, satisfying the Philippines' environmental quality standards. The Ermita and Pasay stations had done the monitoring befor l983, too, and the value monitored after resumption of the monitoring significantly soared from 93μg/m3 (the annual mean) in 1982 to 207 μg/m3 (the annual mean) in 1988 at Ermita and from 64 μg/m3 (the annual mean in 1982 to 154 μg/m3 (the annual mean) in 1988 at Pasay (Table 1-1-19). According to the data of monitoring stations which started monitoring in 1988, the values in the following year, or 1988, worsened at almost every monitor- ing station. The increase in the volume of autos on trips particularly in urban areas is pointed out as the primary cause.
When it comes to sulfur dioxide, there were signs of an improve- ment from the findings obtained before 1983, and in the surveys perfor- med in 1988 and 1989, signs of a deterioration were not observed (Table 1-1-20).
Table 1-1-20 Trends in Results of Monitoring of Sulfur Dioxide in Metropolitan Manila
Source:EMB
b. Water
The Philippines came out with environmental quality standards and drainage standards in 1978 and amended them in 1990 with a view to maintaining the water environment, but the development of the environmental monitoring system is not in progress due to the break- down of monitoring instruments and other factors. The survey perfor- med on Metro Manila's four main rivers in 1990 revealed that the Class C environmental quality standards for DO and BOD were not satisfied except the upstream of the Marikina River, and all that is possible now is ship trips. Lake Laguna with an area of 900 km3 is one the Orient's biggest lakes, but according to the survey performed from 1986 to 1987, is eutrophicating as the concentration of phosphate is on the upswing (Table 1-1-21). The Bay of Manila turns out to be the final place to take in pollutants generated in Metro Manila, and the water quality of the Bay of Manila is such that it does not satisfy the Class SC standard value of 5,000 MPN/100 ml, in terms of the number of colitis germ groups, with which to maintain the water quality fitted to the propaga- tion and growth of fish and other marine organisms. In recent years, the levels of pollution have been in excess of that standard value along the seacoast south to Metro Manila.
Table 1-1-21 Water Quality of Lake Lagna's Water Quality

Source:Environment Agency
That water pollution came out because there are increasing loads on the water quality due to miscellaneous household wastewater and other factors and to increased wastewater from factories and other facilities. A check of trends in the BOD load on the Pasig, the biggest of all rivers in Metro Manila, it began to rise in or about 1950 and the increase began to accelerate particularly in or about 1970.
(3) Other Asian Countries
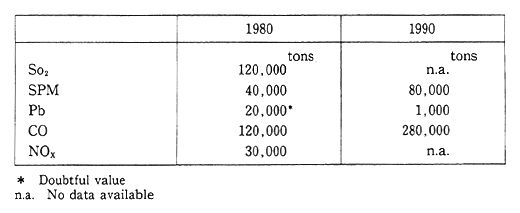
Table 1-1-22 Trends in Emission of Air Pollutants in Bangkok
Source:UNEP/WHO, Urban Air Pollution In Megacities of the World
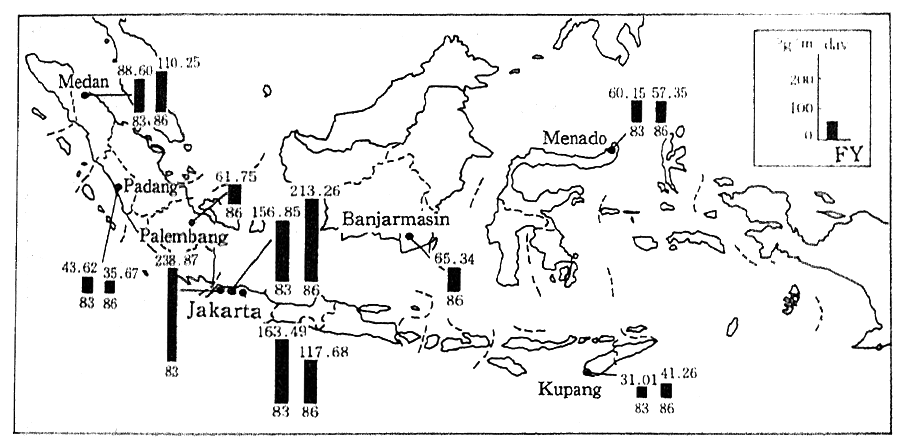
For Bangkok in Thailand, a serious problem is posed as urbaniza- tion has been stepped up in recent years without means of public transport and other social overhead capital developed. In Bangkok, the emission of carbon monoxide doubled from 1980 to 1990 and that of suspended particulate matter increased more than two times (Table 1-1-22). Indonesia's national dust and soot survey indicates that the concentrations of dust and soot are high in Jakarta, Bandoeng and Surabaja and in districts where industrial and other human activities are brisk (Fig. 1-1-39). The pollution of main Indonesian rivers by heavy metals has been. in progress in recent years, and a high concentration of heavy metals is detected from each river. In the 1981 survey, the high concentrations of a number of heavy metals were detected from the Sundar River.
As we have just seen., the deterioration of the environment is striking in particularly in. Asian developing countries and areas in conjunction with the evolution of industrialization. and urbanization. Indeed, the aggravation has become a serious issue. What those coun- tries are urged to do is to realize sustainable development. To support efforts to solve this question., Japan has been rendering various forms of cooperation, while making the most of the experience it had in working for the prevention of environmental pollution in the course of its eco- nomic development. In 9, Section 1, Chapter 4, we will see in detail the factors that deter the solution of environmental issues in developing countries and areas and the measures to overcome them.
Fig. 1-1-39 Trends in Concentration of Suspended Particulate Matter in Indonesia
Source:Vadan Metrorologi Dan Geofisika, 1988
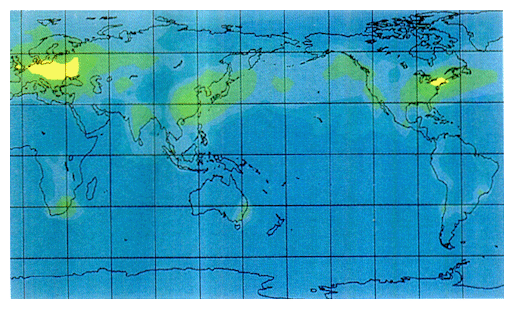
Fig. 1-1-29 Simulated Distribution and Quantities of Sulfurous Fall in 1985
Source:Yuzuru Matsuoka, associate professor, Kyoto University
Fig. 1-1-29 Projected Distributions and Quantities of Sulfurous Fall for 2100 If No Measures Are Taken
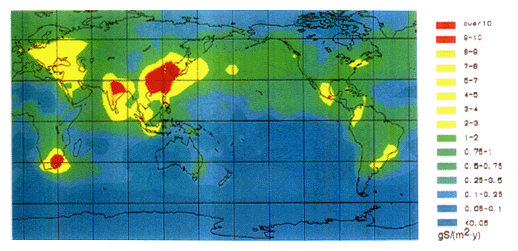
Source:Yuzuru Matsuoka, associate professor, Kyoto University
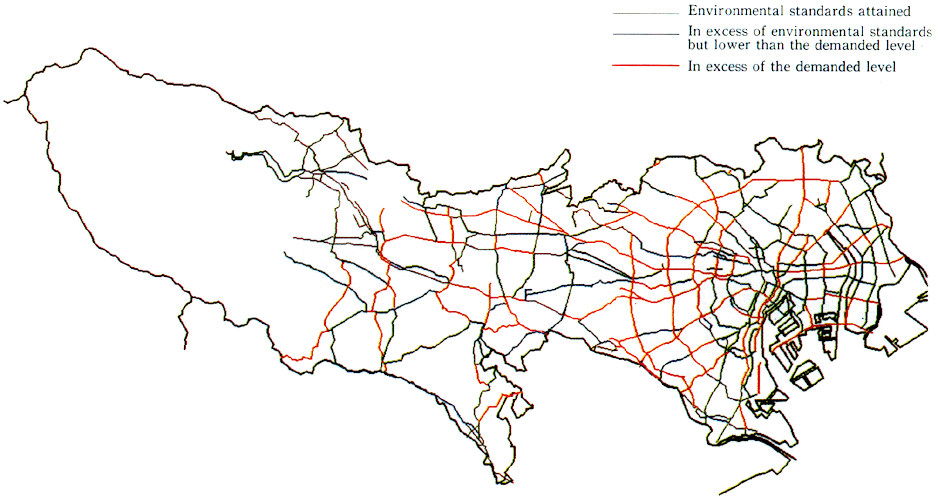
Fig. 1-1-34 Traffic Noise on Main Trunk Roads (Nighttime, 1991)
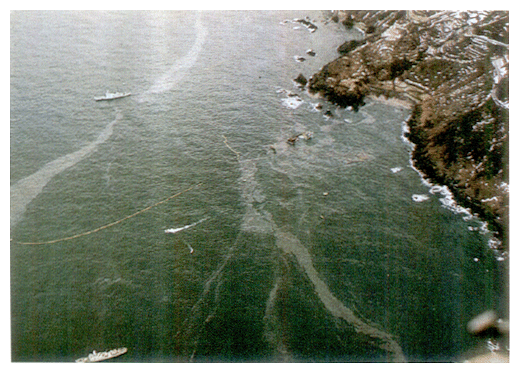
The tanker Maritime Gartynia was stranded off Kyougamisaki in Kyoto Prefecture
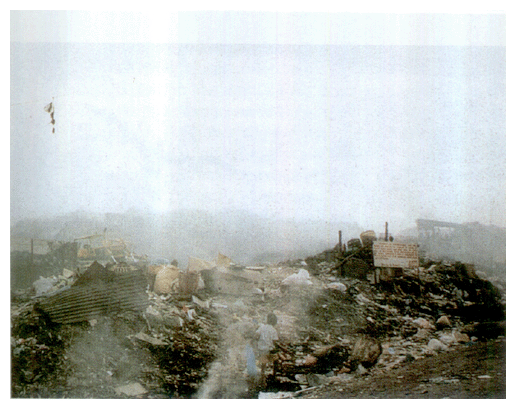
People living at a dumping ground
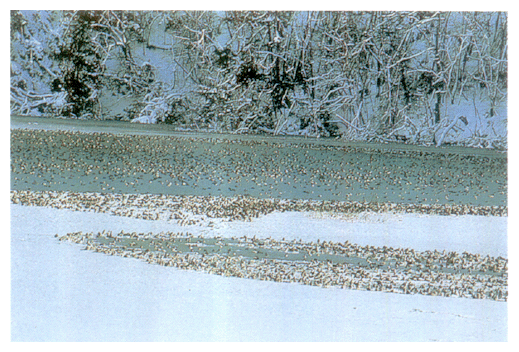
The precious wetland as a habitat of waterfowls (Katano duck pond in ishikawa Prefecture designated and registered as a Wetland of International Inportance under the Ramsar Convention)
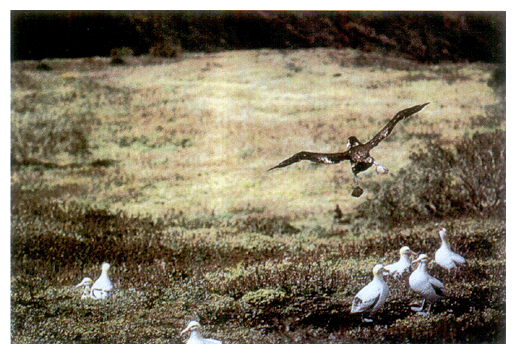
Operation for re-establishment of albatosses (Lured to a safe place with decoys. There are seven decoys on the ground.)
1-2 Natural Environment at Present
Nature is made up of non-biological elements, such as air, water, soil and climate, and biological elements, including fauna and flora, and formed on the basis of complicated and delicate relations between those groups and between elements. We, mankind, are part of the natural environment as one of its elements. We have taken in and used a wide variety of useful things in nature by means of cultivation, fishing and hunting, among others, while utilizing delicate relations between ele- ments in nature. Our life styles are significantly regulated by the natural environment, which forms the basis for our sensibility and the culture of communities. On the other hand, there are cases in which the district environment is regulated by the modes of our life, which center on agriculture, forestry and fisheries.
Nearly 200 years of industrialization since the Industrial Revolu- tion has drastically transformed our lives, the relations built between nature and us through historically long years of trials have changed, and the natural environment has metamorphosed. The plots used for com- merce and industry and leisure activities have increased and many lands have been exploited. With agriculture, forestry and fisheries incorpo- rated into the market economy, their dimensions rapidly expanded, leading sometimes to excessive yields.
Moreover, environmental pollution of the serious sort which was caused by industrialization has significantly scarred forests and wildlife. Developed countries have experienced them since the Industrial Revolu- tion. Poised to industrialize over short spans of time, developing coun- tries are to experience disruption of the natural environment in much severer forms, coupled with the leaving of many poor people behind. Such a deterioration of the natural environment will qualitatively and quantitatively lower the quality of food available from nature and other useful things and drastically change social culture and custom. A deterioration of the natural environment itself will dwindle nature's capacity of absorbing and purifying pollution and accelerate the expan- sion of pollution.
A check of conditions up to fiscal 1991. indicates that though the deterioration of wilderness nature was checked to some extent, it is necessary to take further measures in Japan so that nature in nearby areas may be conserved while giving life to its features. In developing countries, furthermore, there are signs that the disruption of nature will rather continue, and changes in the nature of those countries are becoming grave globally. It might be said that though he significantly affects nature, man is urged to think of himself as relying on a delicate balance of ecosystems to survive as part of nature, and to restructure relations between himself and nature by while taking account of eco- nomic and technological conditions in the contemporary era. With this in mind, we will make clear the conditions of nature and provide a general picture in this section, while taking up the natural environment in terms of ecosystems, first, and then, cast light on species, which are nature's components.
1-2-1 Natural Ecosystems at Present
(1) Natural Ecosystems in japan at Present
a. Climate and Topography
Japan is a long and narrow country which stretches from about 24 degree C to about 46 degree C in the north latitude east to the Eurasian Continent. The difference in latitude is virtually the same as that of the United States which has a vast expanse of territory from the Great Lakes in the north to Miami in the south. Japan is a seagirt country. The Pacific Ocean extends to the east of Japan, whereas the nation is hemmed in by the Japan Sea, the East China Sea and the Okhotsk Sea on the other sides. Off Japan in the Pacific, the Kuroshio current drifts in from the south and the Oyashio current from the north and bump against each other. In the Sea of Japan, the Tsushima current, coming from the East China Sea, goes north along the seacoast of the Hokuriku district. Japan is also a mountainous country. With 3,000-meters, including the Japan Alps, about 60% of the national land constitutes mountain.
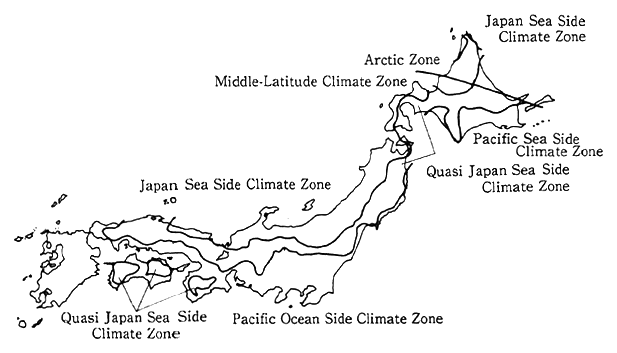
Partly because of such geographical features, Japan, situated from the subtropical zone to the subarctic zone, features a mild climate. Because of its diverse geographical features, Japan's climate is aiso diverse, though the area of the national land is limited(Fig. 1-2-1). As the temperature goes down by about 0.7 degree C at every 100 meters in altitude, the climate changes arising out of differences in altitude are significant, thereby bringing about aditional changes in an already complicated climate.
The climate is a significant factor which regulates the natural environment. The conditional changes artificially brought into the environment, such as global warming and ensuing rainfall changes, the increase in the radiation of ultraviolet rays due to disruption of the ozone layer, the urbanization-induced heat island phenomenon and drying in cities, might affect the natural environment as a matter of course.
Fig. 1-2-1 An Example of Climate Zone
Source:Hideo Suzuki 1962, Nakamura et al. 1986
b. Vegetation and Artificial Topsoil Land
According to the National Survey on the Natural Environment analyzing in 1988 the areas covered by some kind of plants, such as natural vegetation or cultural land account for 92.7% with the share of forest vegetation at 67.5% (Table 1-2-1).
Generally, vegetation changes with time, eventually forming stable ecosystems. They are ecologically known as climax. As typical climate climax vegetation in Japan, broad-leaved evergreen forests dominated by Machilus thunbergil, Castanopsis sp., Quercus sp. or others distribute from the southern part of Kyushu to that of Eokkaido, broad-leaved deciduous forests dominated by Fagus crenata or others distribute in colder areas than the former forests, forests composed of coniferous evergreen species and broad-leaved deciduous species distrib- ute in Hokkaido and coniferous evergreen forests distribute in subarctic zone. Besides, there are various other climaxes, depending on topo- graphical and geological features. In areas with an abundance of natural features which represent Japan, such climaxes of vegetation are obser- ved but their number is comparatively small.
Table 1-2-1 Degree of human disturbance of vegetation
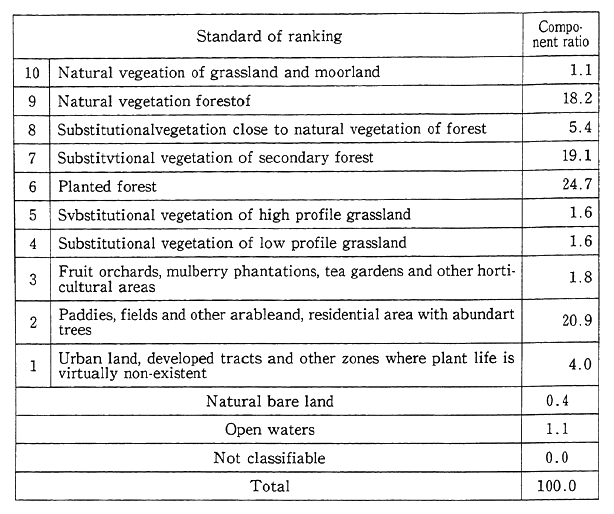
Source : Environment Agency, Vegetation Survey on the 2nd and 3rd National
Survey on the Natural Environment
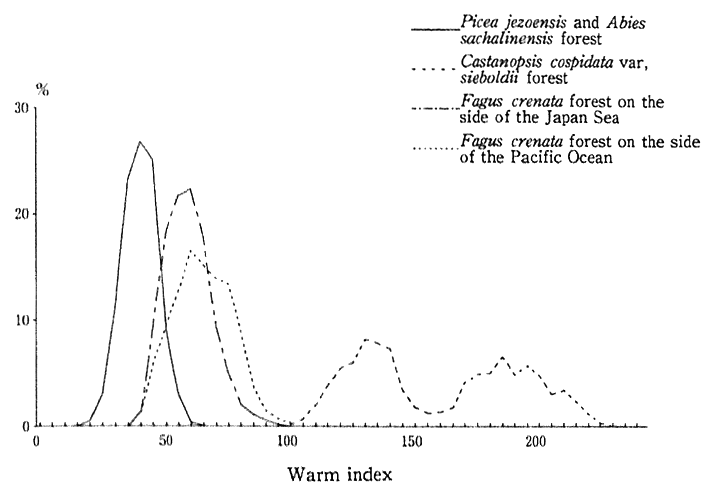
In Japan which features much precipitation, vegetation is signifi- cantly regulated by temperature. Fig. 1-2-2 illustrates relations between Japan's representative natural vegetation and indices of warmth (warm index: computed by adding the values gained by subtracting 5 from the average temperature of months when it exceeds it. Consequently, it follows that the higher the average temperature of each from 5 or the greater the number of months when the average temperature exceeds 5 the greater the index). Nonetheless, the figures show that Picea jezoensin and Abies sachalinensis forests, Fagus crenata forests and Castanopsis cuspidata var. sieboldii forests which represent forests of broad-leaved evergreen species are distributed in areas basically differ- ent in warmth.
Fig. 1-2-2 Distribution of Vegetation Types with High
Degrees of Naturalness by Warm Index
Source: Environment Agency, Comprehensive Report on the third National Survey on the Natural Environment
There is concern that changes in temperature by global warming and other factors significantly affect vegetation. According to an IPCC report, it is projected that the average temperature would rise by about it by 2025 and by about 3 degree C by the end of the 21st century. If it is simply hypothesized that the monthly average temperature would rise by 1 degree Cand 3 degree C respectively, the warm index of Sapporo, situated in the same climate conditions as along the southern borderline of the distribu- tion of Picea jezoensis and Abies sachalinensis forests, say, with the present warm index at 69.4 degree C/month, would rise to 76.7 degree C by 2025 and 92.7 degree Cby the end of the 21st century. That means that Sapporo would be detached by 2025 from the climate which made it possible for that forests to appear, and that by the end of the 21st century, the climate would be too inappropriately warm even for the appearance of Fagus crenata forests by the end of the 21st century. Naturally, it is presum- able that changes in temperature will greatly vary, depending on the region and the season, so that a simple conclusion may not be drawn, but the possibility is undeniable of climate warming producing a significant impact of Japan's vegetation.. Trends in the average temperature in Japan since the beginning of the 20st century reveals that there have been signs of a rise since the 1980s and that there have signs of a drop in precipitation since the 1970s (Fig. 1-2-3).
Fig. 1-2-3 Changes in Average Temperature and Annual Precipitation in Japan in 1898-1991
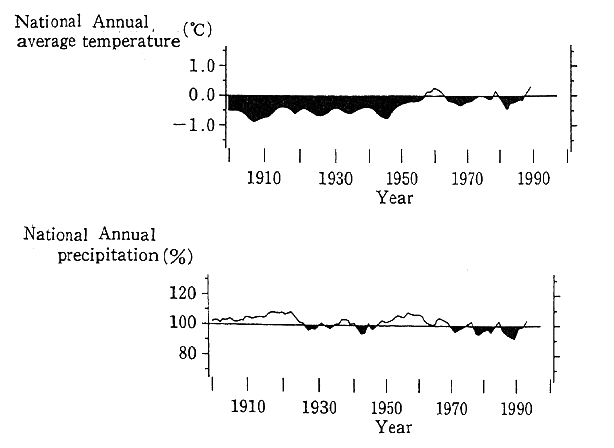
The means of those 16 points' values f or the whole nation.
Points:Northern Japan (Abashiri, Nemuro,Yamagata, Ishinomaki)
Eastern Japan (Fushiki, Mito, Iida, Hamamatsu)
Western Japan (Sakai, Hamada, Hikone, Izuhara, Miyazaki, Tadotsu)
Southwestern Islands (Naze, Ishigakijima)
Actual vegetation in Japan indicates that natural vegetation in Alpine Zone, Vaccinio-Piceetea Regior, Fagetea crenatae Regior, Camellietea japonicae Regior, River-side, Moor, Salt marsh and Dune cover 19.3% of the national land. Nearly 60% of such natural vegetation is distributed in Eokkaido.It is also distributed in limited areas, such as steep mountains, peninsulas and offshore islands. Forests are so capable of cultivating water sources that they are known as green dams, and natural forests are particularly invaluable for the habitat of numerous wildlife.
Areas close to our activities, such as flatlands and hills, there are many secondary forests as substitutional plant communities affected by the gathering of firewood and charcoal materials and other human activities, and reforested and cultivated areas with artificial vegetation. The secondary forests consist of Quercus mongolica forests in areas with Fagatea crenatae Regior Quercus serrata, and Quercus acutissima forests, pine forests, and oak sprout forests in areas with Camellietea japonicae Regior, and all of them account for about one-fourth, or 24. 6%, of the national land. Many of the second forests are those which have been maintained as they are by means of the gathering of firewood and charcoal materials, the collection of liters for fertilizer arid other uses and other activities for man's life. Close to our abode, they turn out to be invaluable green of the sort with which residents broadly have communion as familiar nature, but the decrease in the use of secondary forests and depopulation of villages in the mountains, among others, have led to a rapid decrease in intervention by people who have maintained them so that the secondary forests are being transformed.
While reforested and cultivated lands with artificial vegetation account for nearly half, or 47.4%, of the national land. Many of the ref orested areas are those of Cryptomeria japonica and Chamaecyparis obtusa rapidly replanted after World War II.
Trends in vegetation from the first National Survey on the Natural Environment performed in 1973 to the third Survey conducted from 1983 to 1986 indicates that though there was a little change in the total area of forests, primary and secondary forests decreased by 3..5 percent points and reforested areas increased by 41 percent point (Table 1-2-2).
On the other hand, artificial surface soil areas with scarce nature, such as plots for dwellings, buildings, factories and other structures, and roads increased by 1.5 percent points from 4.3% to 5.8%. In terms of the circulation of substances in nature, artificial surface soil lands are typical. For example, the permeating capacity of forest lands is 258.2 min/hr, about 20 times that of pavements suggesting that artificial surface soil lands are less penetrable by rainwater than forest lands. The transpiration capacit of tree serve to prevent a rise in temperature by means of heat consumption in evaporation supply moisture to the air and prevent desiccation. Besides, forests provide a wide variety of functions, such as sound arresting and the absorption of pollutants, but surface soil lands with few trees are not expected to provide those functions. By a wide variety of human activities, artificial heat is generated. Given those factors, there are signs that surface soil lands are higher in temperature and drier than the natural climate, so that there is concern that they might affect the natural environment of the national land.
Table 1-2-2 Changes in Vegetation by Degree of human disturbance of vegetation
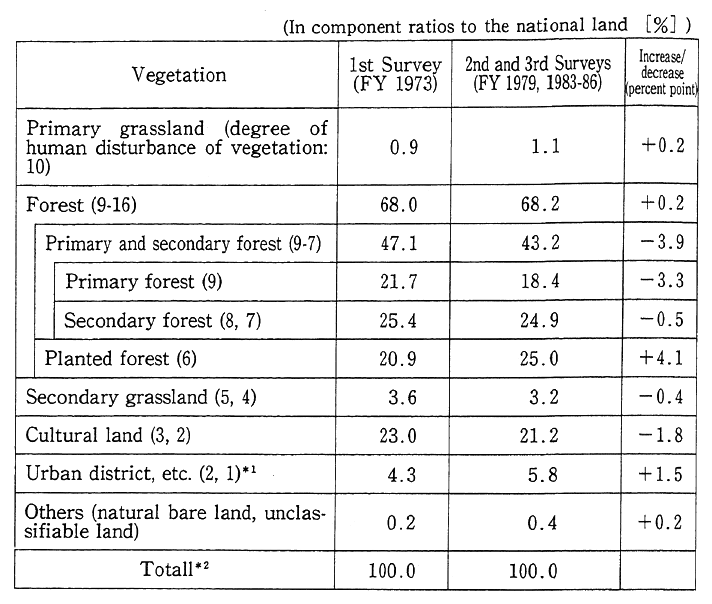
Notes:
*1 The urban district, etc., include residerntal area with abundant trees (degree:2)
*2 Excluding open water
As open water was not covered in the 1st Survey, the open water was excluded in calculating component ratios in this comparison of survey findings to check increases or decreases. Therefore, the component ratios of the degrees of human disturbance of vegetation in the 2nd and 3rd Surveys are different from the aforementioned national rates.
Source:Environment Agency, Vegetation Survey, on the 1st, 2nd and 3rd National
Survey on the Natural Environment
c. Fauna
The distribution of animals which constitute part of Japan's ecosystems is characterized by various conditions, including climate and vegetatiorn. For example, the Blakiston line which separates Honshu from Hokkaido, the Watase line which detaches Yaku Island from the Amami Islands and several other lines are known (Fig. 1-2-4).
Fig. 1-2-4 Animal Distribution Borderlines of Japanese Archipelago
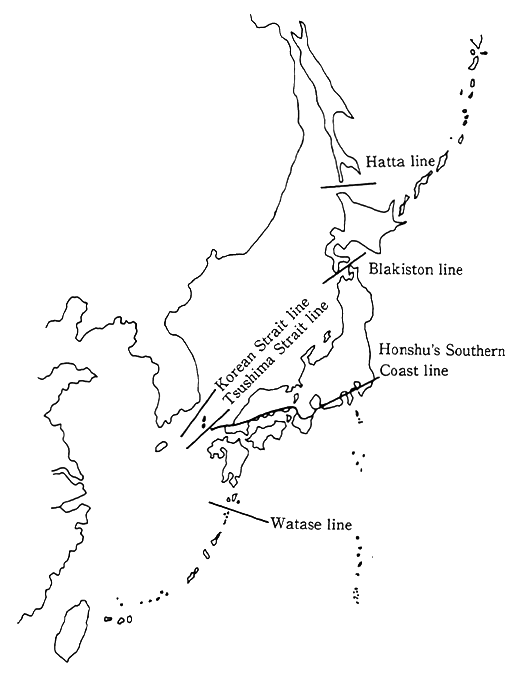
Source:Kawai et al. 1980
Vegetation is significantly affected by conditions for the habitat of animals as places for feeding and hiding and other places. For example, the habitat of many Asian black bears and Japanese serows (Capricernis crispus crispus) in broad-leaved deciduous. forests and particularly in Fagus crenata forests is confirmed, whereas that of many foxes (Vuqpes vulpes) in cultural lands and secondary forests is ascer- tained (Fig. 1-2-5). Those animal species are closely tied in with vegeta- tion.
Fig. 1-2-5 Vegetation Type on Habitat
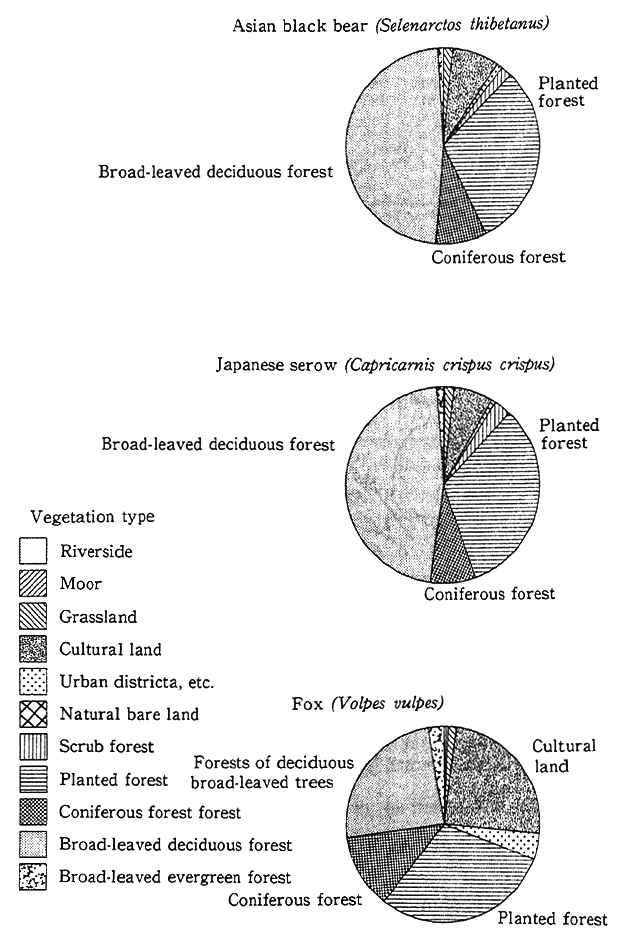
Note:Analysis in done in a unit of meshes. Therefore, there is the need to construe here that "the habitat of each species may readily be confirmed in areas where each vegetation is observed." For example, there is the need to construe that "habitat is confirmed in areas where much cultural land is observed," rather than that "habitat was confirmed on the culturalland."
Source:Comprehensive Report on the third National survey on the Natural Environment
Table 1-2-3 Distribution of Butterflies and Warm Index
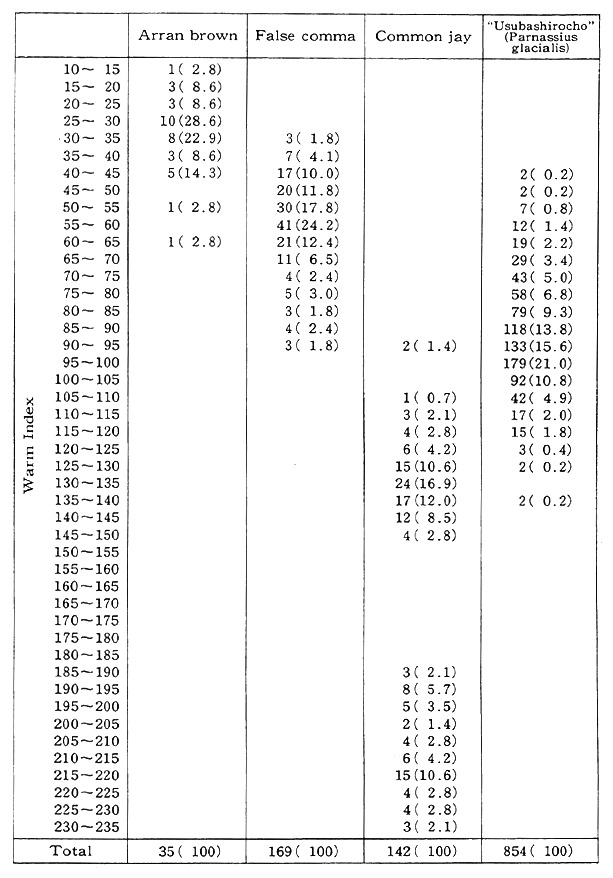
Notes:* The unit of the Warm index is degree C•month.
* The number of meshes is given at left; the rate (%) to the total of each species is given at right.
Source:Environment Agency, Comprehensive Report os the 3rd National Survey on the Natural Environment
The climate also significantly affects fauna. A comparison of the warm index to which we have referred earlier with the distribution of butterflies, which are familiar to people, reveals that the habitats of Elebia ligea, Nynphalis Vaualbum Samurai, Parnassius glacialin and Graphium dosor are closely tied with temperature, though there might be factors which regulate vegetation (Table 1-2-3). As is the case with vegetation, there is presumably the possibility that climate change by warming would produce grave impacts on the habitat of fauna.
d. Natural Landscape
The topographical, geological and natural features which excel as scenic beauty such as falls, valleys and mountains formed by the workings of nature have their own ecosystems and are valuable as local symbols, resources for tourism, learning and places for inspiration and a recovery of humanity. The findings of the National Survey on the Natural Environment which were compiled in 1988 indicate that there were 15,468 natural landscape resources across the nation. Falls (1,488 places) came on top of the list, followed by volcanoes (1,158), gorges and valleys (996), non-volcanic solitary peaks (993), lakes and marshes (871), sea-eroded cliffs (734), and sand beaches and shores (632), and those seven natural, resources constitute almost half of the total.
Of those natural landscape resources, natural parks, wilderness areas, nature conservation areas, natural monuments and other areas placed under some form of protection or the other accounted for 57.8%, and of other natural landscape resources, some are protected as protec- tion forests in scenic forest reserves and national forests and under the ordinances and other regulations of local governments. Nonetheless, about two-thirds of natural landscape resources are artificially affected, such as actions for development, and the greatest impact is brought about by the trespassing of people, followed by the development of agriculture and forestry and that of tourism.
(2) Ecosystems at Present by District
a. Mountain
Japan is a mountainous country. Accounting for 60% of the national land, the mountains, covered by forests, are places for the habitat and growth of wildlife and those which provide us with a wide variety of resources. They have also produced significant impacts on the Japanese people's spiritual lives as subjects of religion and tourism, among others.
Most of the mountains are covered by forests in the mountains play an important role in preventing the erosior of soil and other environmental damage. Of the forests which cover mountains, there are not a few artificial forests, and there are signs that the more steep the slant, the smaller their rate. Even in areas with a steep slant of more than 30 degree C, the rate of artificial forests exceeds 13%, suggesting that human activity has been done considerably deep in the mountains in recent years.
In the mountains, there exist many of the natural ecosystems that remain in Japan. The third National Survey on the Natural Environ- ment suggests that mountains accounted for most of the many areas where the distribution of highly natural Japanese beech forests is conspicuous, and that areas with a significant distribution of broad- leaved evergreen forests are maldistributed in the mountains of Kii, Kyushu and other districts. The mountains often have diverse eco- systems. A check of areas with many species of butterflies indicates, for example, that many of them inhabit the Chichibu and other mountains (Table 1-2-4). When it comes to high mountains, there remain atypical ecosystems in the cold and severe environment which are made up of alpine plants and butterflies.
Table 1-2-4 Areas with High Degrees of Naturalness
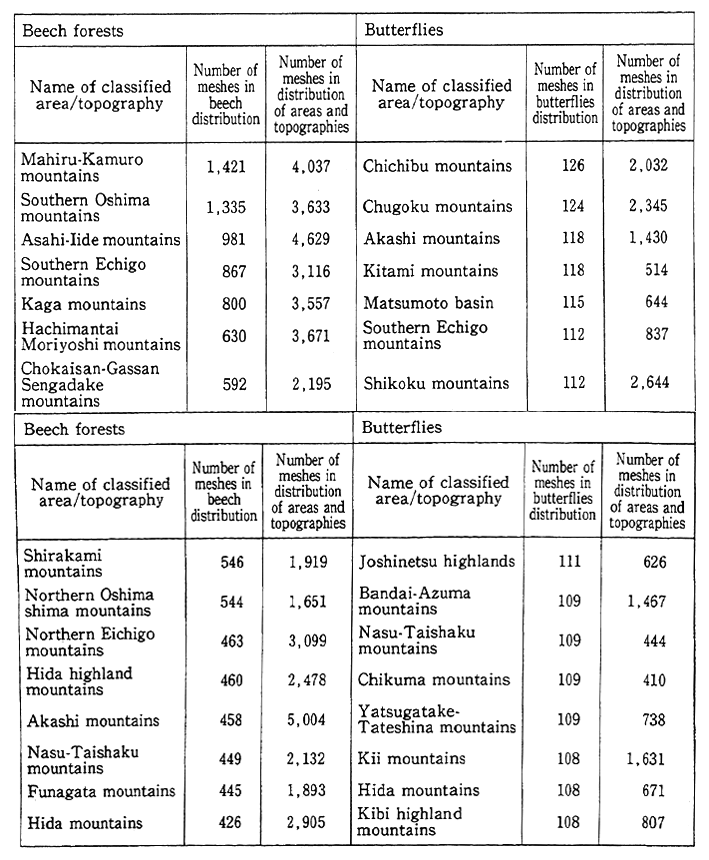
Source:Environment Agency Comprehension Report on the 3rd National Survey on the Natural Environment
Mountains have from old played an important role in our spiri- tual lives, such as religious subjects and community symbols. In recent years, they have also played an important role as places for tourism and recreation. In the Natural Landscape Resource Survey (referred to earlier), which constituted part of the National Survey on the Natural Environment the three top-ranking types often viewed as natural land- scape resources (falls, volcanoes, gorges and valleys) are those which are situated in the mountains.
With the depopulation of communities in the mountains in recent years, the utilization and control of the mountain environment have been on the decline, to say the least of the control of artificial forests which requires manual labor, and relations between the natural environ- ment of mountains and their utilization are to change at a rapid pace.
b. Lake and Marsh
A wide variety of lakes and marshes exists in Japan, ranging those in the mountains to those on the plains, such as inland sea-lakes created by the regression of seas, and to those which exist near the seacoast. The Environment Agency makes it a practice to survey lakes and marshes (natural lakes and marshes with an area of more than 1 hectare), and the total area of subject lakes and marshes is 2,380.08 km2, accounting for 0.63% of the national land.
Reflecting land utilization on the lakeshore, lakes and marshes are undergoing a broad variety of modification. In the Environment Agency's survey, the lakes and marshes with an artificial lakeshore rate of more than 50% and with the rate of lakeshore areas used for built-up urban and industrial areas standing at upwards of 30% are classified as "lakes and marshes with progress in transformation." The number of those classified as "lakes and marshes with progress in modification increased from 19 to 27 from 1979 to 1985. All of them are inland sea-lakes on the plains. The number of lakes and marshes where some form of inning and reclamation or the other has been done since 1945 is 57 with an aggregate area of about 344 km2, suggesting that about 13% of the aggregate area of lakes and marshes has shrunken due to inning and reclamation. Lakes and marshes have been converted for a broad variety of land uses, such as for industrial sites and built-up urban areas.
The lakes and marshes are important as a habitat of organisms. Lakes and marshes with the habitat of many fish species are given in Table 1-2-5, suggesting that the fish variety of inland sea-lakes are abundant. by intrusion of brackishwater and coastal fishes.
Table 1-2-5 Lakes and Marshes Inhabited by Many Fish Species
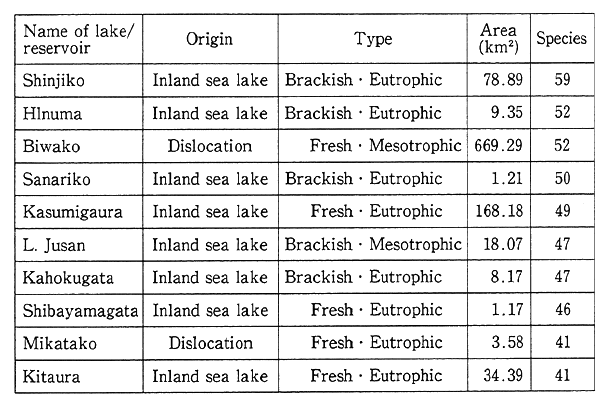
Source Environment Agency, Lake and Marsh Survey on the 3rd National Survey on the Natural Environment
On the other hand, black bass and other foreign immigrants are settling in many lakes and marshes so that it is necessary to watch their trends in the future as one of the factors which change the fish fauna of lakes and marshes.
c. River
As regards the natural environment of river, the Environment Agency surveyed 113 rivers, including the trunk rivers classified the 1st Class Rivers, in 1979 and 1985.
Of the surveyed riverbanks measuring 11,412.0 kin, the aggregate length of riverbanks with artificial structures (the riverbakns which are in contact with river walls and other artificial structures at the normal water level) was 2,441.5 kin, or 21.4% of the total length of riverbanks. In terms of length, artificial modifications have increased by 249.3 km from 1979, or up 2.2% in terms of the component ratio.
When it comes to the utilization of riverbeds, natural riverbeds account for one-third, and their uses are in the order of culturalland and sites for facilities. Here again, the number of natural riverbeds is on the decline, whereas the rate of riverbeds as culturalland and sites for facilities is on the rise.
Dams, weir and other across-the-river structures will sometimes cut habitats of fish into pieces, unless proper measures are taken to help them to go upstream. Of the 113 surveyed rivers, those without across- the-river structures or without factors to deter the going upstream of fish total 13, including Abashiri, Kushiro, Urauchi, Tokoro, Rumoi, Shiribeshitoshibetsu, Omono, Tenjin, Takase, Natori, Tokachi, Kuji and Toki (Table 1-2-6). Besides those 13 rivers, there are nine rivers where the section in which fish can go upstream from the estuary exceeds 90% of the total length, and they include Ibo, Hino, Iwaki, Nagara, Mar- uyama, Shimanto, Mogami, Yoneshiro and Naka to a total of 22 rivers. They account for 19% of the surveyed rivers. On the other hand, the rivers where the rate does not exceed 10% total six, including Ashida. The share of sections where fish can go upstream in the total length of the surveyed rivers averages 58.9%.
The rivers turn out to be the habitats of many organisms other than fish. The rivers with the habitat of many fish are shown in Table 1-2-7. Many of them are situated in the Honshu island.
In terms of the environmental conservation of rivers, a variety of projects and surveys are under way.
Table 1-2-6 Rivers Ascendable by Fish (with the ratio of ascendable section at 100%)
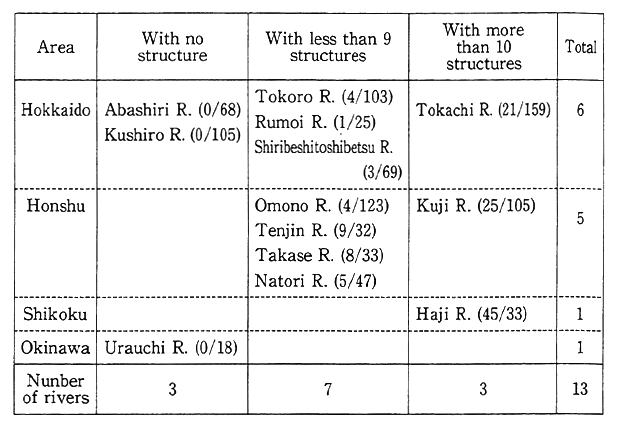
Note : The figures in brackets represent the number of river structures/that of surveyed sections.
Source : Environment Agency, River Survey (FY 1985), on the 3rd National Survey on the Natural Environment
Table 1-2-7 Rivers with abundant Fish Species
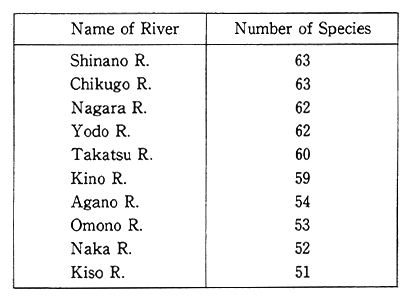
Note : Living species observed and heard about
Source : Enrironment Agency, River Survey on the 3rd National Survey (FY 1985) on the Natural Environment
d. Wetland and Tideflat
Wetland and tideflat have atypical ecosystems in the natural environment, important as the habitats of aquatic organisms and waterfowls.
Under the Convention on Wetlands of International Importance Especially as Wacterfowl Habitat (Ramsar Convention), wetlands are taken up according to a broad concept, encompassing lakes and marshes, rivers, wetlands and tideflats. On wetlands, the water quantity is larger than that of the general surface soil so that only those animal and plant species which like such an environment may be able to inhabit, thereby leading to the formation of atypical ecosystems and offering suitable habitats for aquatic organisms and waterfowls, among others. Particularly in recent years, attention has been focused on wetlands important to the habitation of waterfowls, and a conferences of the Ramsar Convention will be held in Kushiro City in 1993. For Japan, the Kushiro and four other wetlands are registered under the Ramsar Convention (as of the end of March 1993).
In the sea environment, the tideflats turns out to be an important ecosystem as the living environment for atypical ocean organisms, waterfowls and other organisms. In many tideflats, pollution generally tends to deteriorate, and as they are located in inland seas where purification is difficult to proceed, attention is focused on the water purifying capacity of tideflats. Some studies suggest, for example, that the water purifying capacity of natural tideflats is greater than that of artificial ones.
According to the survey performed by the Environment Agency from 1989 to fiscal 1991, there existed tideflats with an aggregate area of 51,462 hectares, and the biggest one is the Arao-Nagasu fore-beach situated along Ariake Sea at Kumamoto Prefecture measuring 1,656 hectares in area. There remain many tidelands along the Ariake Sea, and their aggregate area is 20,788 hectares, or 40.4% of that of the nation's existing tideflats (Table 1-2-8).
Table 1-2-8 Area of Existing Tideflats by Sea Region
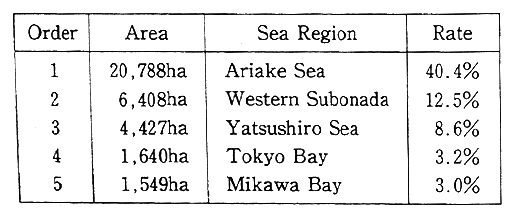
Note:The ratios represent the rates of existing tideflats across the nation.
Source:Environment Agency, Marine Biotic Environment Surrey cit the 4th National Survey on the Natural Environment
In some of the inland sea-facing districts where many tideflats exist, however, the socioeconomic activities are brisk, and their develop- ment has been made by means of reclamation, whenever necessary. The tideflats which have disappeared since 1978 across the nation measures 4,076 hectares, and the primary cause is reclamation, the share of which stands at 46.4% (Table 1-2-9).
Table 1-2-9 Reasons for Extinction of Tideflats (Replies Duplicated)
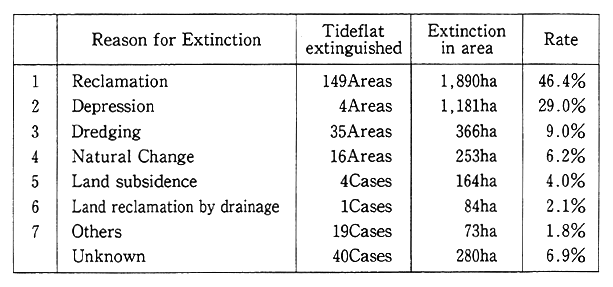
Source : Environment Agency, Marine Biotic Environment Surrey on the 4th National Survey on the Natural Environment
When it comes to the conservation of tideflats, it is stipulated that conservation and other measures be carried out under the Basic Program for the Environmental Conservation of the Seto Inland Sea, whereas restrictions on reclamation and other measures are done under the Special Measures Law for the Environmental Conservation of the Seto Inland Sea.
e. Coast Line
The total length of coast line in Japan is 32,472 km according to the survey performed in 1974. The coast line of the main island account for 58.3% and coast line in the insular areas have a share of 41.7%. Incidentally, the aggregate length of coast line has somewhat increased from 1978, when the previous survey was performed, as a result of reclamation. In ratio of each coast line types across the nation, natural coast line account for 56.7%, followed by artificial coast line with 28.6% and semi-natural coast line with 13.9%. A comparison only on the main island, which excludes the insular areas, the rate of natural coast line is 46.0% and that of artificial coast line 36.5% (Fig. 1-2-8). A check of changes from 1978 to 1984 indicates that natural coast line decreased by 565 km whereas artificial coast line increased by 696 km and semi-natural coast line by 171 km. A breakdown of those increases and decreases reveals that sand beaches and rocky seacoasts are on the downturn but reclaimed coast line on the upturn (Fig. 1-2-9).
Fig. 1-2-8 Alteration of Coast Line;
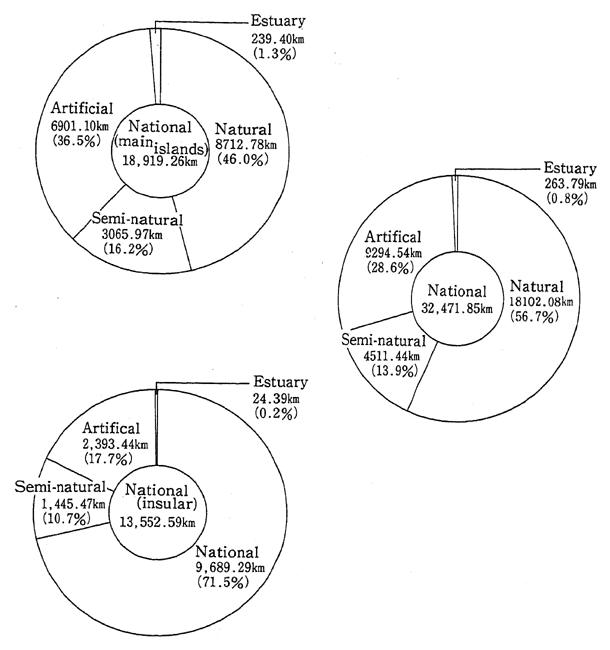
Notes:
1. Islands in this survey do not include those whose diameter is less than 100m. (Not including islands in the Northern Territories, either)
2. The main islands Hokkaido, Honshu, Shikoku and Kyushu.
3. The coast line are classified into:
Natural: Those which have no artificial construction in the shore.
Semi-natural : Those which have no artificial construction in the shore buthave some just above the shore (directly affected by the waves).
Artificial : Those which have artificial construction in the shore.
Source: Environment Agency, Coast Line Survey on the 3rd National Survey on the Natural Environment
Fig. 1-2-9 Changes in coast line
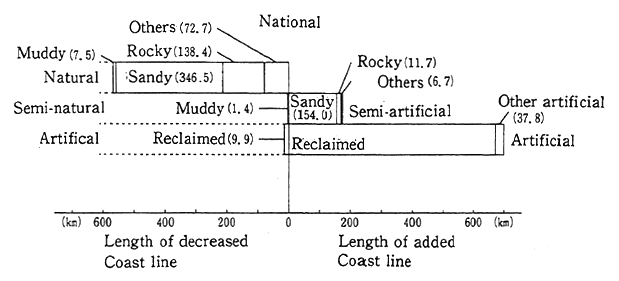
Source : Environment Agency, Coast Line Survey on the 3rd National Survey on the Natural Environment
The natural environment of coast line is conserved under the Natural Park Law and the Special Measures Law for the Environmen- tal Conservation of the Seto Inland Sea.
f. Area Around Citys
The existence of vegetation, animals and plants familiar to our lives tends to be overlooked, but they constitute part of the natural environment of the national land and an indispensable factor for every- day life of the sort which is in communion with nature. The natural environment of areas around cities serves to mitigate the heat island phenomenon and improve the climate conditions and environment of urban areas. They also play a role in showing the conditions of cities' air, water and soil environments (see 6, Section 1, Chapter 4).
In the National Survey on the Natural Environment, vegetation is classified into 10 types, depending on the degree of human impacts and surveyed. When it is classified into five types--natural vegetation, substitutional vegetation, planted forest, cultural land and others and urban district for an analysis of the National Capital Region (Tokyo, Kanagawa Prefecture, Saitama Prefecture and Chiba Prefecture), Aichi Prefecture and Osaka Prefecture, it comes to light that natural vegeta tion is extremely less available in those areas than the national average and that the rate of urban district with less vegetation cover is high (Fig 1-2-10). In suburban district, secondary vegetation forms familiar nature as grooves near communities and a habitat for wildlife, but such vegeta tion is less available as a whole. Fig. 1-2-11 illustrates the vegetation of the Kansai sphere which has been developed from old, suggesting that most of this region is made up of urban district and the areas covered by vegetation are available only in the Ikoma, Rokko and other mountains. The artificiality is more conspicuous than in the Tokyo sphere partly because the artificial pressure has been more powerful with this region as a political and economic center.
Fig. 1-2-10 State of Vegetation in Three Major Urban Regions
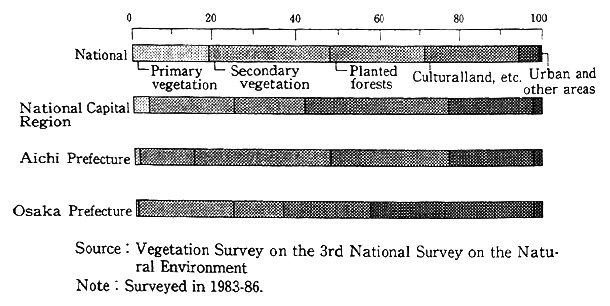
Source : Vegetation Survey on the 3rd National Survey on the Natural Environment
Note : Surveyed in 1983-86
Fig. 1-2-11 Distribution of Vegetation and slant condition in Area Around Osaka-Kyoto Area
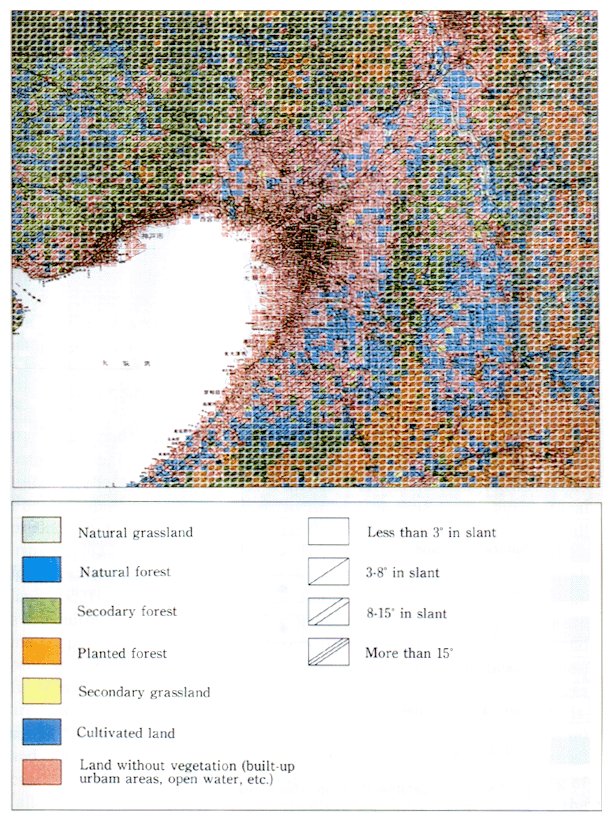
Fig. 1-2-14 Distribution of Vegetation and popular and familiar animal in Area Around Echigo-Plains, North-Central Japan.
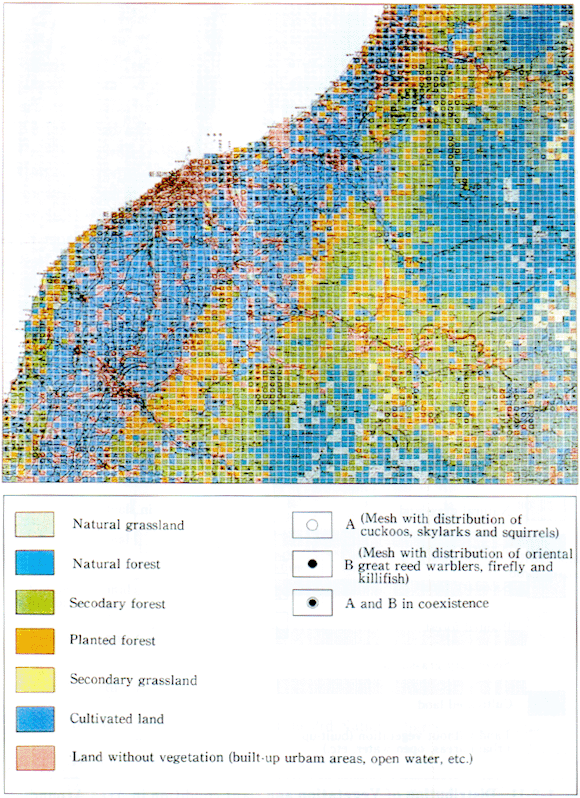
As regards conservation of the natural environment of urban district and their peripheries, natural parks, reserved forests, Green land conservation areas and so forth are designated. In those areas, environ mental alterations are regulated and public projects, such as the devel- opment of parks and other facilities, are carried out (see 6, Section 1, Chapter 4).
It is pointed out that urbanization leads to the heat island phe- nomenon and desiccation, as the surface soil is covered by concrete and other artificial substances and waste heat is on the rise to the increasing use of air-conditioning systems. As a result, localized climate changes take place, affecting ecosystems. For example, there are cases in Tokyo where the hemp palm (Psittacula krameri), essentially in the warmer area, grows wild. And the rose-ringed paraskeet (Trachycarpus fortunei), a tropical bird, propagates as a pet on the run. As an impact of desiccation, there is a phenomenon in which (Cryptomeria japonica) in the forests of Shinto shrines and Buddhist temples and those on farm- houses' compounds on the Kanto Plains are on the wane. It is pointed out that the reason is presumably because the desiccation gives rise to an atrophy of a Japanese cedar which is not good at absorbing water.
g. Rural Village
In agriculture, crops of the kind which is useful to us are culti- vated and harvested by adding human agency to nature's ecosystems, bringing about a wide variety of impacts on the natural environment. For example, materials and so forth are necessary for agricultural production, but there is concern that the excessive reliance on them will increase loads on the environment. In agriculture, which has been done for so many centuries, ecosystems of its own are formed on the cultural- land and its periphery. Paddy-field cultivation, which represents Japan' s agriculture, has traditionally formed ecosystems of its own which are made up of irrigation channels, reservoirs and ridges between fields and become habitats for organisms familiar to man, such as frogs, loaches, fireflies and dragonflies (Fig. 1-2-12). The grooves around rural villages are covered by the community grooves of "kunugi" (Quercus acutis- sima), "konara" (Quercus serrata), Japanese red pine (Pinus densif1ora) and other forests, while the gathering of firewood and wood for char- coal production, the cutting of brushwood for fuels and the gathering of fallen leaves for fertilizer are repeated. In those rural villages, the habitation of Chinese little bitterns (Ixobrychus sinensis), brown hawk owls (Ninox scutulata japonica) and other birds and butterflies, including "Gifuchou" (Luehdorfia japonica) and "usubashirocho" (Parnassius glacialis), and there are many cases in which their environment forms ecosystems of its own, which are made up of organisms familiar to us. Fig. 1-2-14 illustrates the vegetation confirmed in the Niigata Plains, one of Japan's representative rice growing belts. The figure shows that behind the expanse of cultivated plots (paddy rice fields), there lie secondary and primary forests and there live organisms familiar to us.
Fig. 1-2-12 Yatsu Fields and Places for Habitat of Dragonflies
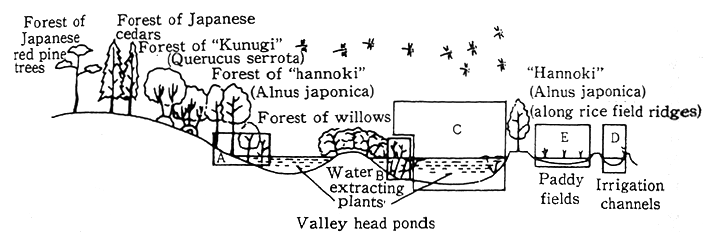
The Yatsu fields consist of paddy fields (E), irrigation channels (D) and valley head ponds. The ponds include the portions surrounded by forests (A), the shore where water extracting plants grow thick (B) and the vast central water, enabling a wide variety of dragonflies to reproduct.
Source Hiroshi Roriyama, Anima No. 220
The depopulation of rural villages and the progress of mechaniza- tion for labor saving are to significantly alter their natural environment. As firewood, charcoal and brushwood are no longer used as fuels, weeds under the trees are propagating. This phenomenon may be taken as part of succession to more highly natural vegetation, but in order to conserve brushwoods in communities the way it used to be, there is the need for the appropriate cutting of weeds under the trees. Of all paddy fields, those in the dales have affluent ecosystems like peripheral forests, but as many of them are situated in the mountains, they are apt to be abandoned in light of profitability and it is expected that they will undergo transformation Future changes in agriculture are likely to bring about significant impacts on the natural environment of rural villages.
Efforts for conservation of the natural environment of rural villages are being made in the promotion of the environmental conserva- tion type with the lessening of loads on the environment taken into account, beside the designation of natural parks, reserved forests and other areas.
(3) Natural Ecosystems in Developing Countries at Present
Many people in developing countries (roughly two-thirds of the population in terms of means for Asia and Africa) engage in the primary industry, such as agriculture, forestry and fisheries, and are living on resources in the natural environment. The natural environment includ- ing forests, wildlife and soils brings fuels, food, water, building mate- rials and cattle feeds, serves to prevent floods and adjust the climate, becomes a subject for economic activities and protects people's lives and environment. Moreover, many developing countries have affluent natural-environment resources, which turn out to be assets of global value. Nonetheless, while developing countries following the same process as developed countries have lost natural-environment resources in conjunction with industrial development and industrialization. In the process where natural-environment resources are excessively used against the backdrop of poverty and population increases in developing countries, the stock of natural-environment resources is being lost. In the following, let us see the conditions of natural-environment resources in developing countries, centering on those in Asia, in regard to forests and soils.
a. Forests
It is projected that 4,027,569,000 hectares of forests existed around the world in 1991. Of them, those which existed in the developing world totaled 2,127,730,000 hectares, or 52.3% of the world's forests, including 555,894,000 hectares in Asia, 892,806,000 hectares in Latin America and 635,093,000 hectares in Africa (Table 1-2-10).
Table 1-2-10 Present State of World's Forest Resources
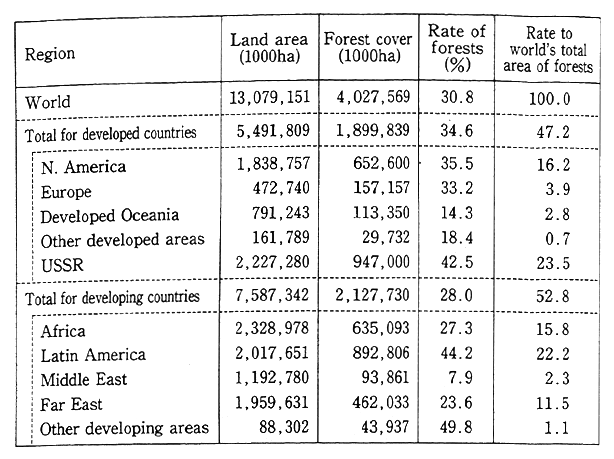
Note : The area of forests is for 1990.
Source : FAO, Production Yearbook 1991
Many of the forests in the developing world are tropical forests, and their depletion is now a matter of worldwide concern. In the report on the findings of the 1990 Forest Resource Assessment Project, released by the U. N. Food and Agricultural Organization in March 1993, the area of forests and the rate of forest depletion from 1980 to 1990 were assessed (Table 1-2-11). The report says that 15,400,000 hectares of forests were depleted in 90 surveyed countries on the average a year with 0.8% of the total area of forests lost every year. In the 1980 forest resource assessment made public by the FAO and the United Nations Environment Program (UNEP) in 1981, the forest depletion rate for the 1980-85 period. In regard to 76 countries which were subjects in the 1980 assessment and the latest assessment, or the one in 1990, the forest depletion ratio may be compared for the 1980-85 period. The rate stood at 0.6% in the 1980 assessment, but the in the phase of the latest interim report, it rose to 0.8%. The forest deteriora- tion in which the density of forests goes down though the density of forests does not drop is being studied in the FAO project to which reference has earlier been made. It is projected that the depletion of organisms in tropical forests by their deterioration goes on at a consid- erably faster pace than the decrease in the area of forests.
Table 1-2-11 Estimates of Forest Cover and Deforestation by Geographical Sub-region
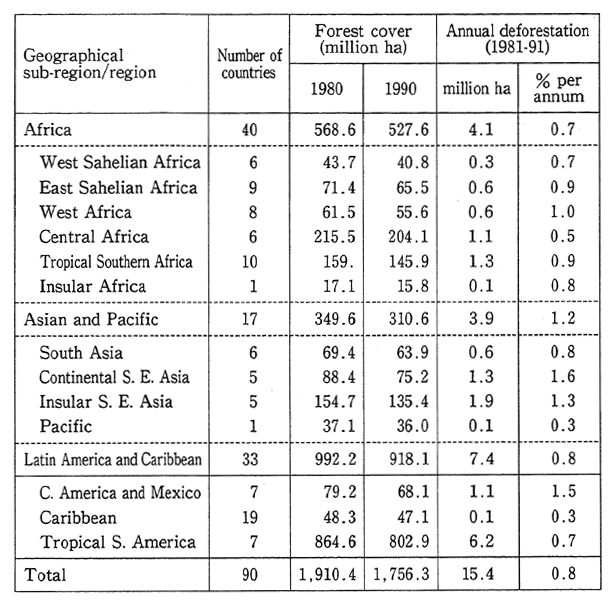
Source : FAQ, Final Report on 1990 Forest Resource Assessment Project (1993)
To cope with the depletion of forests--that of tropical forests, in particular, cooperation by the International Tropical Timber Organiza- tion (ITTO), the FAO and other international institutions and bilateral cooperation are being rendered.
b. Soils
Soils form the basis for agriculture, stock-farming and other economic activities. If their conditions are aggravated and soils are lost, not only will those economic activities be suspended, but significant impacts will be produced on man's life itself. In Sahel and other African areas, the gathering of firewood and stock-farming are done to the point where they exceed the regenerative power of tress and grass, and the cycle of migrant cultivation is often cut short, as measures to assure substitute fuels and increase yields are not available due to poverty and other factors. Given this picture, soil degeneration and loss tend to take place. People in those areas are not financially equipped to prepare for a drought, so that once it occurs, they will drift to other places or cities as "environmental refugees." It might be said that desertification is closely tied in with poverty.
The UNEP came out with the Report on the Status of Desertifica- tion and Implementation of the United Nations Plan of Action to Combat Desertification. On the basis of this report, let us see land deterioration in arid areas in the following.
There exists 6.1 billion hectares of arid land in the world, accounting for nearly 40% of the earth's land. Of this total, extremely arid areas measure 900 million hectares and constitute deserts. Some of the remaining 5.2 billion hectares is being desertified due to human activities. In those arid areas, about one-fifth of the world's population are living. The UNEP's 1991 assessment says that about 70%, or about 3,560 million hectares, of the farmland of arid areas is affected by desertification. By region, the degeneration rate is high in the order of North America, Africa and South America, but in terms of area, Asia comes on top of the list, followed by Africa (Fig. 1-2-15).
Fig. 1-2-15 World Drylands
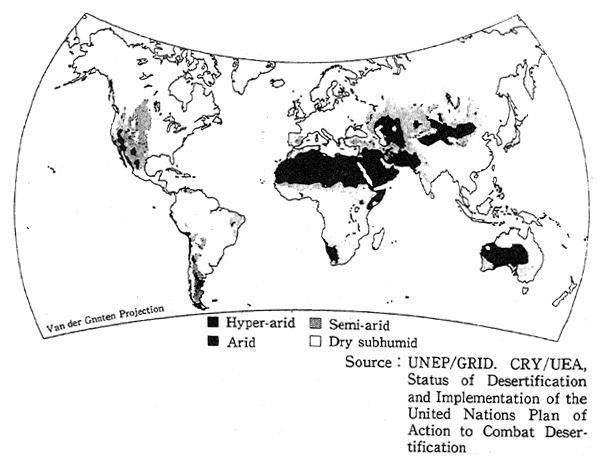
The areas which are exposed to soil deterioration measure 1,138, 200,000 hectares, or 18.3% of the total area of arid areas, including those extremely arid. The greatest form of soil deterioration is erosion by water, such as the washout of soils by rainfall, and it is followed by erosion by winds, such as the bl owing away of top soil; chemical deterioration, such as pollution by salinity and alkalifying; and the water-logging of soil and other physical deterioration. By continent, the region affected to the greatest degree is Asia, followed by Africa and Europe. A check of the rate of soil deterioration in the area of arid lands reveals that it is particularly high for Africa with 81.1%, suggesting that more than 80% of Africa's arid lands are being deteriorated.
Let us see the conditions of China as an example. The deserts and the areas which are being desertified in the northern part of China measure 1,496,000 hectares, 12% of which constitutes those which are in the process of desertification and 10.5% of which is in the process of mild desertification (Fig. 1-2-16). The washout of soils is yet another great problem. Particularly in the east, the erosion of soils by rainwater is serious, and it is projected that 8,000 tons/km2 of soils are washed out in 430,000 km2 of areas on the average a year. Presumably, the washout results from the increase in the area of bare lands due to deforestation and other factors.
Fig. 1-2-16 Denerts and Distribution of Desertification in China
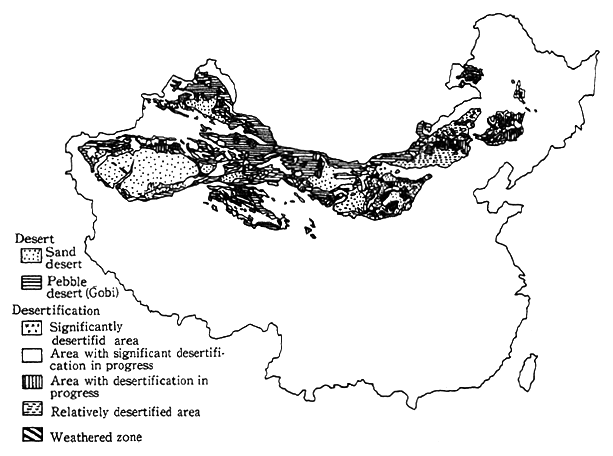
Source:China's National Environment Conservation Bureau, The Conservation Atlas of China, 1990
Source:Japan Environmental hygiene Center (commissioned by the Environment Agency), Survey on Support to Formulation of Environment Conservation Programs in Developing Countries
As regards desertification, agreement was reached at the Earth Summit for the formulation of an accord for the prevention of deser- tification, and preparatory work is under way. Cooperation is also rendered in the formulation of measures in bilateral cooperation for its prevention.
1-2-2 Present Status of Wildlife
Ecosystems hold good, depending on relations between air, soil and other non-biological factors and fauna, flora and other biological factors. In this section, an attempt will be made to analyze the condi- tions of nature with attention paid to species, which are components of ecosystems.
When the conditions of species are to be analyzed, it is important to pay attention to their diversity. The existence of a broad variety of species in an ecosystem is described as featuring a greater degree of responsiveness to changes in the environment than an ecosystem the species composition of which is simple. The species may be counted as an important component of the ecosystems which form the basis for mankind's existence. From old, mankind has selected useful species from the wildlife species and produced food and medicines. The remain- ing of many species on the earth signifies the fact that the possibility of such utilization exists both at present and in the future. From this perspective, the importance of the diversity of species was recognized, and the Biodiversity Convention was prepared in 1992 for signing at the Earth Summit held in the same year.
In the following, let us see the conditions of biological species in Japan and elsewhere in the world.
(1) Present Status of Wildlife Species
a. Present Status of Habitation and Growth of Endangered Wildlife Species in Japan
Reflecting its diverse climate, topography and geographical posi- tion, Japan's natural environment is affluent. Also reflecting the diver- sity of conditions for habitation and growth, wildlife comes in a broad variety.
The existence of wildlife species itself is an important source of information about the history of evolution. As ecosystem components, they take charge of the circulation of matter and the flow of energy and, their diversity makes it possible to retain the balance of ecosystems. Mankind has utilized, and coexisted with, wildlife species as food, as materials for various tools, and as subjects of science, education, recrea- tion and art. Such activities sometimes led to reckless hunting, and by the disruption of habitats due to the expansion of man's economic and social activities, the number of wildlife species in existence is depleted, and they are threatened to come to extinction. Nonetheless, man cannot create wildlife species, once they are gone. It is an urgent task to prevent the extinction of wildlife species not only for the conservation of ecosystems but for the protection of various values equipped to wildlife species as well.
(a) Fauna Species
The Environment Agency has carried out the Survey on Fauna and Flora Species Urgently Requiring Protection to select endangered fauna and flora species in Japan. On the basis of the findings, the agency has published the Red Data Book--Endangered Wildlife in Japan in regard to animals in 1991.
According to this book, the number of species (including sub- species) the existence of which is confirmed in Japan, including 188 in the mammals, 665 in the feather tribe, 87 in the reptiles, 59 in the amphibians, 200 in the freshwater fish class, 28,720 in the insects, 192 spiders and other decapods, 24 in the land-freshwater shellfish class and 4,040 in the invertebrates. Depending on the degree of danger for species, the "endangered species" which are on the verge of extinction, the "vulnerable species" which will be on the verge of extinction if the present conditions continue, and the "rare species" which will possibly be classified as "vulnerable species" or "endangered species," depending on changes in the conditions for habitation. There are 110 "endangered species, including Japanese otters, Iriomote wildcats and others in Mammlaia, albatrosses, "tanchou" (Grus japonensis), "noguchigera" (Sapheopipo noguchii), Blckston's fish owls and others in the feather tribe, Hokuriku salamanders, Kikuzato and others in the amphibians and reptiles, Ryukyu sweetfish, "miyakotango" (Acheilognathus morio- kae), Musashitromiyo" (Pungitius sp.) and others in the freshwater fish class, among others. The 114 "vulnerable species" include Tokyo shrew- mice, peregrines, Japanese marsh warblers, Yamal box turtles, Ishik- awa frogs, "itou" (Hucho perryi) and others. The 415 "rare species" include Erabuta flying foxes, dormice, sea otters, green sea turtles, Yuufutsuyatsume" (Lampetra tridentata) and others. The animal species the extinction of which is already confirmed total 22, including Japanese wolves, Japanese hair seals, Rofous night herons and "Minamitomiyo" (Pungitius kaibarae) among others (Table 1-2-12).
Table 1-2-12 Numbers of Endangered Species in Japan
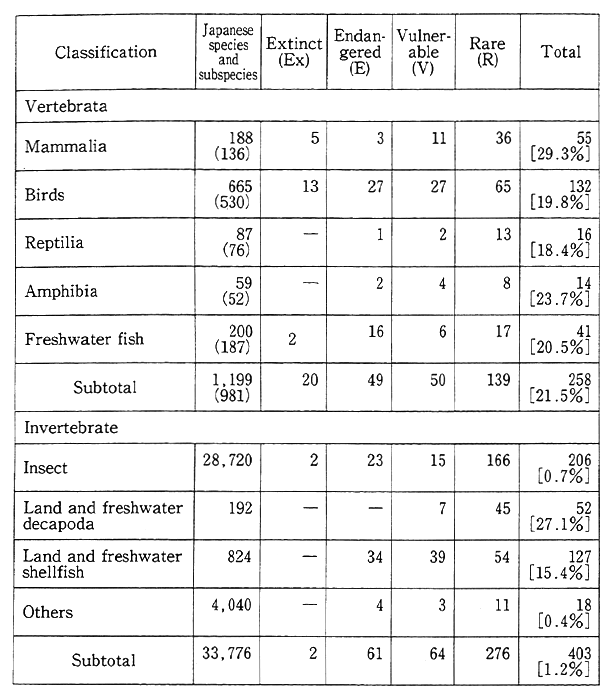
Note:The figures include those of specis and subspecies. The figures in parentheses represent those of species. The numbers of Japanese species and subspecies are those of scientifically named ones.
Extinct:Species or subspecies considered to have already extinguished in Japan.
Endangered:Species or subspecies on the verge of extinction
Vulnerable:Species or subspecies with an increasing danger of extinction
Rare : Species or subspecies for whose survival infrastructure is vulnerable.
A classified group-specific check of the total number of "extinct species," "endangered species," "vulnerable species" and "rare species" indicates 55 species in the mammals, 132 species in the feather tribe, 16 species in the reptiles, 14 in the amphibians, 41 species in the freshwater fish class, 206 species in the insects and 127 in the land freshwater fish class. The share of endangered, vulnerable and rare species in the total number of species in each category exceeds 15% for all except Insecta in which the number of species is overwhelmingly large. The aggrava- tion or extinction of habitats, such as by reckless hunting, changes in forests and vegetation and water deterioration, are pointed out as reasons for the extinction of wildlife species or for their being on the verge of extinction, suggesting that the habitats in Japan for wildlife are environmentally severe.
For endangered species, protection and propagation projects are under way in addition to restrictions on their capture and trade. For example, the habitation of only 33 "tanchou" (Grus japonensis) in the Kushiro wetlands was confirmed in 1952, but as a result of a subsequent protection and propagation project, the number of those whose habita- tion was confirmed increased to 179 in 1970 and further to 611 in 1992. As for Shelter's albatrosses, which were regarded for some time as having come to extinction, their habitation was confirmed on the island of Torishima in 1951, and it is estimated that about 600 Shelter's albatrosses are inbaiting there. The places for their propagation are endangered by the inflow of earth and sand and other factors, and the Environment Agency began in 1992 a project in which decoys would be used to induce them to safer places for their propagation.
(b) Flora Species
According to the Environment Agency's Selective Survey on Fauna and Flora Species Urgently Requiring Protection, the total number of flora growing in Japan includes 8,118 species in the vascular plants, 1,850 species in the algae, 1,516 species in the thistles, 535 in the moss, 2,295 species in the lichen and about 10,000 species in the fungi (including subspecies, variations and subvariations). According to the report prepared by the Japan Nature Protection Association and the Japan Committee of the World Nature Protection Fund on the Present Status of Flora Species Important in Terms of Protection in Japan, 147 species are on the verge of immediate extinction, 677 species are endangered, and 36 species are in a state of danger though their actual state is unknown. Then there are 36 species which have already come to extinction, according to the report. Those species account for 16.8% of about 5,300 wild plant species in Japan (this figure does not coincide with the figure given in the Environment Agency's Selective Survey on Fauna and Flora Species Urgently Requiring Protection, to which reference has been made earlier) (Table 1-2-13).
Table 1-2-13 Number of Endangered Plants
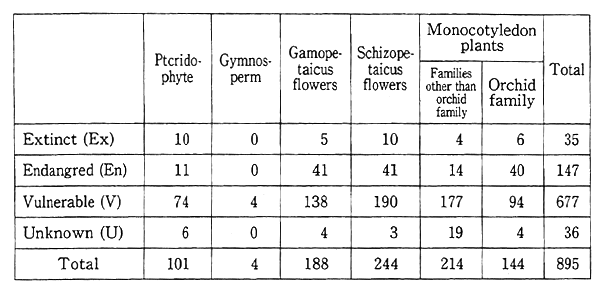
Source : Present Situation of Plant Species Important to Protection in Japan, 1989.
Edited by the Species Subcommittee of the Study Committee on Plant Species and Communities in Japan to Protect and published by the Japan Nature Conservation Association (NACS-J) of the worldwide Fund for Nature (WWF-J)
It is pointed out that so many species are endangered because of the environmental aggravation of their habitats due to development, extinction of places for their growth and reckless capture by fans and mountain grass dealers. Particularly when it comes to disruption of the growth environment, it is taken up as an issue, but not just the physical disruption, that full consideration is not given to the environment which encompasses places for their growth, or ecosystems.
b. Status of Habitation and Growth of Wildlife Generally Observed in Japan
As we have already pointed out, it is confirmed that the Japanese animals include 188 in the mammals, 665 species in the feather tribe, 87 species in the reptiles, 59 in the amphibians, 200 species in the fresh- water fish class, 28,720 species in the insects, 192 species in the spiders and decapods, 824 species in the land freshwater fish class and 4,040 species in the invertevrates (all those figures include those of sub- species), and that the Japanese plants include 8,118 species in the vascular plants (including subspecies, subvariations, kinds and sub- kinds), 1,850 species in the the algae, 1,516 species in the thistles, 535 species in the moss, 2,295 in the lichen and about 10,000 species in the fungi. It is discernible that those numbers are smaller than in countries of "mega-diversity" the number of wildlife species is greater as will be elucidated later, but that the biological species are more abundant than in other developed countries, particularly European countries. This is presumably because Japan's climate and topographical conditions make it possible for a broad variety of ecosystems stretching from the sub- tropical zone to the subarctic zone exist in the nation, and because the number of forests abundant with ecosystems is small in Europe as there is progress in the turning of the national land into farmland.
In order to make clear the environment with the habitation of many wildlife species, a check of the number of species in habitation in regard to broadly distributed species in the mammals, the feather tribe and the butterflies (nine species in the mammals, 55 species in the feather tribe and 258 species in the butterflies) indicates, as shown in Table 1-2-14 and Table 1-2-4, that many species are observed in the mountains, when it comes to the mammals and the butterflies, and in the mountains and on the plains when it comes to the feather tribe. There are signs that the habitation of many species in the mammals is found in the mountains broad in area and equipped with a wide variety of natural conditions, and that of species in the feather tribe is found on the plains and hills with a diverse environment, including a secondary environment ranging from waters to forests. When it comes to the butterflies, we have been able to know there are general signs that as they have a history of living peculiar to a special environment, the habitation of many species is observed in the mountains where the vegetation and forest structure are diverse.
Table 1-2-14 Classification of Landform and Areas with Diversified Fauna
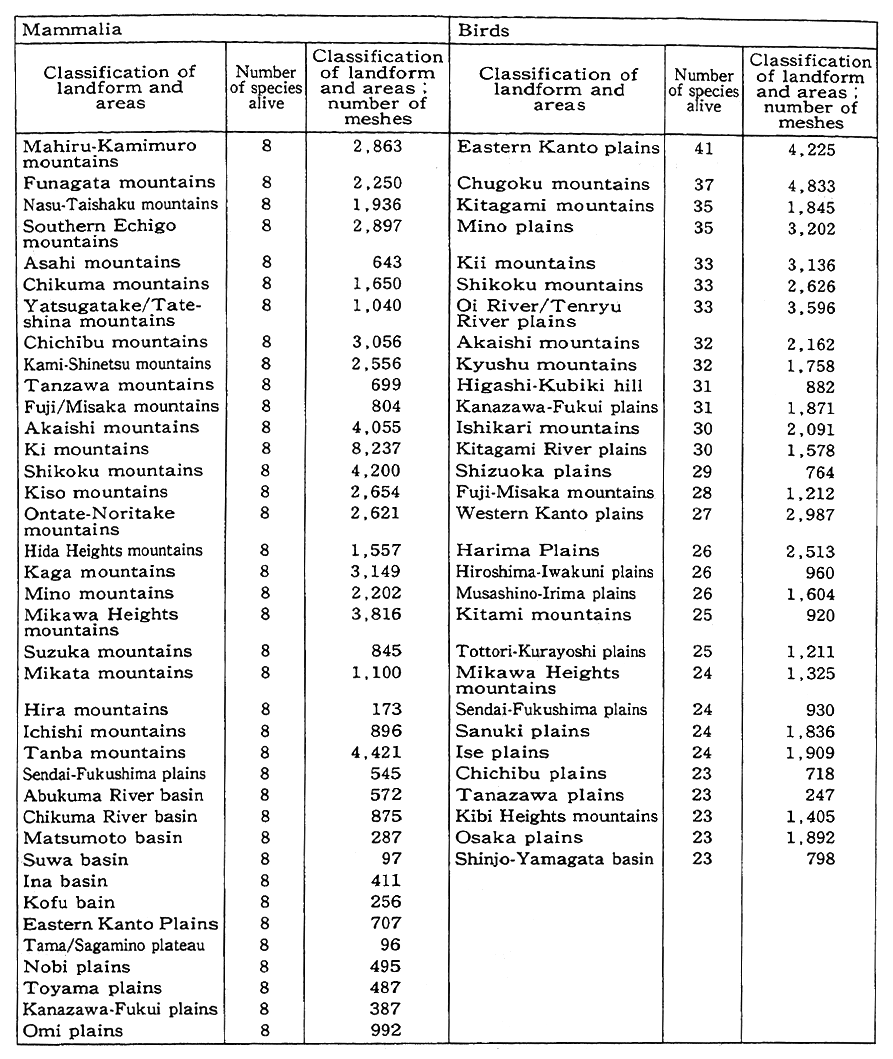
Notes : The classification of areas where many index animals (nine mammalia species and 55 bird species) are observed is indicated. As for mammalia, 38 areas where the largest number of species (eight species) are sampled. As regards birds, 30 areas where many species are observed are sampled.
The number of area and landform meshes serves as a yardstick for the width of the sampled areas.
Source : Analysis Section, Comprehensive Analysis Report, 3rd National Green Consensus
The habitation of species in Japan is not confined to Japan, some of them migrating across the national border. There is no national- boundary wall for the natural environment. Japan is important for the destination of migratory birds from Siberia and other places, and more than 60% of birds observed in Japan are migratory (including migration inside Japan). The survey conducted in January 1993 on the habitation of birds in the family of wild geese and ducks reveals that the total number of wild geese and ducks observed was 1,809,000 Of them, ducks account for 95.6%, followed by swans with 2.9% and geese with 1.6%. At 434 places in 30 prefectures, 52,037 swans in four kinds were observed, and almost all of them were found in each prefecture of the Tohoku region, Niigata Prefecture and Hokkaido. Observed at 61 places in 15 prefectures were 28,722 geese in four kinds, many in Miyagi Prefecture and Niigata Prefecture. Ducks were observed most frequently and in all prefectures, totaling 1,728,526 ducks in 30 kinds. By district, many of them were observed in the prefectures of Niigata, Yamagata, Aichi, Ibaraki and Shimane.
In order to contribute to international cooperation for the conser- vation of fly-in areas and the protection of migratory birds by casting light on their migration routes, band surveys and follow-up satellite surveys on migration routes are conducted. As a result, many migration routes have come to light, such as for Lathman's snipes from Australia and swallows from Southeast Asia. The route from Korea and China for white-naped cranes and hooded cranes and the route from Siberia for bewick swans were followed up on, thereby contributing to surveys and researches under the Bilateral Convention for Protection of Migratory Birds.
As migratory birds come and go across national borders, so that unless all countries with fly-in areas take appropriate protective mea- sures, the number of migratory birds will decrease with the availability of protective measures taken only by several countries. Therefore, the protection of migratory birds is an international obligation. Japan is making efforts under the conventions and so forth it has signed with the United States, China and Australia.
c. Present Status of Habitation and Growth of BiologicalSpecies in Foreign Countries
As regards the number of wildlife species, relatively much is known about the number of species in the vascular plants and verte- brates, but less findings are documented about that of insects and invertebrates, so that there is no choice but to rely on estimates. The total number of species around the world is projected at five million species at the smallest and 50 million species at the largest. The number of species confirmed at present is about 1.4 million species.
In the tropical forests, many biological species live and grow. In the tropical forests, which accounts for only 6% of the the total areas of lands in the world, more than half of all the species reportedly live and grow. In terms of the species the existence of which is already known, countries with many species in the mammals, the feather tribe, the amphibians and the reptiles, butterflies in the swallowrails and species in the angiosperms are enumerated in Table 1-2-15. There are many countries with tropical forests, such as southern African coun- tries, Indonesia and Zaire.
Table 1-2-15 Countries with Many Wildlife Species
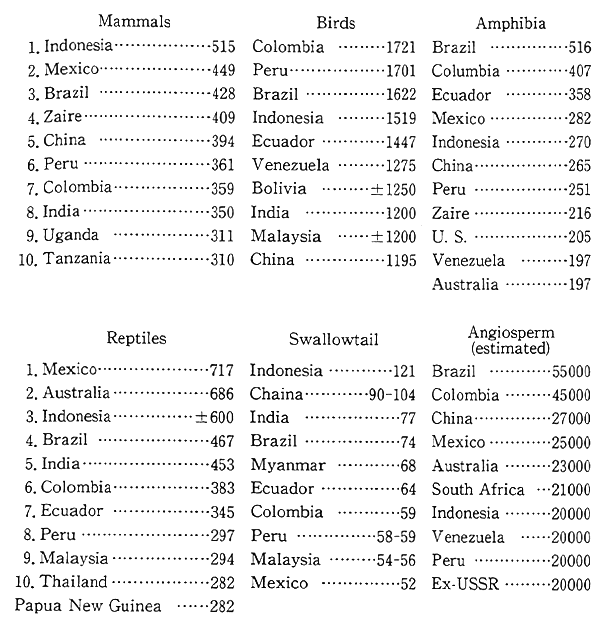
Source : IUCN, WRI, Conservation International, WWF-US and World Bank, Conserving World Biodiversity
Source : International and many others
Notes : 1. Collins and Morris, 1985
2. Davis et al., 1986
The countries with many biological species or with many inherent species are sometimes called countries of mega-diversity. If it is assumed that Brazil, Colombia, Ecuador, Peru, Mexico, Zaire, Madagas- car, Australia, China, India, Indonesia and Malaysia are countries of mega-diversity, for example, it is reported that 60% to 70% of the world's biological species may be found in those 12 countries. The number of species in Brazil, Colombia, Indonesia and Mexico is abun- dant, whereas in Australia and Madagascar, the number of species per se is not great but that of inherent species is large. There are countries, such as Brazil and China, where the national land is great in area and has many species, whereas there are countries, Ecuador, Madagascar and Malaysia, where the national land is small in area but the diversity of species is extremely high thanks to topographical and other factors. 'When it comes to those countries, it is necessary that not only should they make efforts but international cooperation should be rendered to protect the diversity of extremely abundant organisms.
Such abundant biota is to rapidly come to extinction as the places for their habitation and growth are disrupted. According to the 1990 IUCN Red List of Threatened Animals, the number of endangered species around the world is 2,250 in the imvertebrates and 2,751 in the vertebrates, suggesting that the habitation and growth of numerous species are threatened. Besides, it is to be noted that many unknown species are coming to extinction without man's awareness.
For the protection of those endangered wildlife, international efforts are being made, such as under the Convention on International Trade in Endangered Species of Wild Fauna and Flora (CITES), known also as the Washington Convention, and a biodiversity convention is being prepared, such as for the comprehensive conservation of biodiver- sity.