Quality of the Environment in Japan 1993
PartI
Chapter1. Present Status of Environment
In macroscopic terms, the Earth on which we are living is an ecosystem where components of nature, such as the atmosphere, water, soil and organisms maintain an intricate balancing act. Essentially, mankind has lived and developed with the various blessings of a well-balanced natural environment. With a remarkable broadening of socioeconomic actitivies around the world, man's behavior came to impair the healthy ecosystem of the Earth in terms of scale and sub- stance, and mankind's performances led to the danger that such changes in the global environment might jeopardize mankind's existence. Exhaust gas, wastewater, solid wastes and other substances discharged as a result of man's activities (hereinafter referred to as "wastes") have turned out to be a heavy load on the environment. giving rise to environmental issues by means of air and other pollution. Man's exces- sive consumption of natural resources is leading to a degeneration of the natural environment in the form of a depletion of biological diversity.
Up to now, there have been many cases in which environmental problems are taken up as regional ones and transitional phenomena arising out of specific activities, at present, there are also many such issues, but in addition to them, it has become a grave issue that the environment as a resource and as a whole is degenerating due to various changes in the world. A case in point is the progress of global warming with the discharge of greenhouse gas on the upswing. There is a danger that this might seriously impact the natural environment by dint of climate change and other factors. From another perspective, forest depletion increasingly accelerates global warming by reducing means for absorption of carbon dioxide. Discharged into the atmosphere, sulfur and nitrogen oxides move around in the environment and become acid rain to contaminating water and soil, thus bringing about grave impacts on forests and biota. Given those factors, it is necessary, when looking into environmental conditions, to take serious account of not just the atmosphere, water, organisms and other environmental components of each area but also the interrelations and the ecosystems of nature as a whole as well.
On relations between our activities and their impacts on the environment, there is the need to pay heed not only to the impact on a particular area of the environment but also the impact of man's activ- ities directly and indirectly affect the internal and external environ- ments by means of a supranational-boundary environment, through production and consumption patterns especially through global trade. In this light, it is necessary to pay attention not only to the domestic environment but also the global environment in stepping up environmen- tal conservation.
In the following, we will examine Japan's prevailing environmen- tal conditions, while taking note of the fact that Japan's environment forms part of the global environment. Wherever necessary, we will introduce the environmental conditions of foreign countries and the present status of efforts made by Japan and other countries for environ- mental conservation for a broader perspective of global environmental conditions.
1-1 Present Status of Environmental Pollution
Environmental pollution has emerged as man's activities strained the natural environment, thus damaging, in turn, his health and living environment. In Japan, industrial pollution of very serious proportions accompanying its high economic development became a grave social problem. However, this very serious industrial pollution has been mitigated thanks to continued efforts by the governmental and non- governmental quarters. When it comes to nitrogen oxides and noise, of which there are a wide variety of source, and water pollution by organic matter, there are signs of aggravation, or no signs of an improvement, in some cases. Moreover, no significant improvements were witnessed in fiscal 1991 to the extent that this tendency could be rectified. What might be called cumulative pollution, such as soil, groundwater and bottom pollution and land subsidence, are also at issue. Further, there are some substances, such as PCBs, which is no longer produced but has not decomposed and is therefore detectable in the environment. Unlike very serious industrial pollution in the past, such pollution will not immediately lead to health problems, but remains discernible in the case of acid rain and adversly impacts the living environment and nature's ecosystems. Worse, there are indications that it might accumulate in the future, bringing its impacts to the fore. In a global perspective, environ- mental disruption by means of air and water pollution is an issue for developing countries, as it is caused by reckless economic development and by poverty. Viewed as a whole, there are sure signs that the global environment is deteriorating with global warming by carbon dioxide and other greenhouse gases and the depletion of the ozone layer, such as by chlorofluorocarbon (CFC). Such a degeneration of the environment suggests that the well-being of the environment suffers as we pursue material affluence.
1-1-1 Atmosphere
In some cases, man's activities lead to the discharge of a wide variety of matter into the atmosphere, giving rise to air pollution in some cases. There occurs a broad range of health damage as man inhales polluted air. Besides, other problems crop up as substances in the atmosphere interact with one another. Pollutants in the atmosphere also impact nature's ecosystems on the ground surface, directly or through rain or other media. Thus, there are cases in which changes in the atmosphere complicate environmental issues. The following identifies the status of atmospheric pollutants, domestically and grobally, in fiscal 1991.
(1) Nitrogen Oxides
Nitrogen monoxide (NO), and nitrogen dioxide (NO2) and other nitrogen oxides (NOx) result primarily from the combustion of fossil fuels, generation sources including factories' boilers and other immobile generation sources, such as autos. High concentrations of carbon diox- ide produce undesirable effects on respiratory organs and represent one of the causes of acid rain and photochemical air pollution. When it comes to Japan's environmental quality standards by which to measure the concentration of pollutants in the atmosphere, something for which policy targets have to be set up, it was stipulated in 1978 that "the daily mean of hourly values should come between 0.04 part per million (ppm) and 0.06 ppm for carbon dioxide." Japan has subsequently surpassed other countries in terms of enforcement measures, including restraints on factories, individual autos and other generation sources, especially in heavily polluted districts and, conversely, in terms of projects which will contribute to cuts in the discharges.
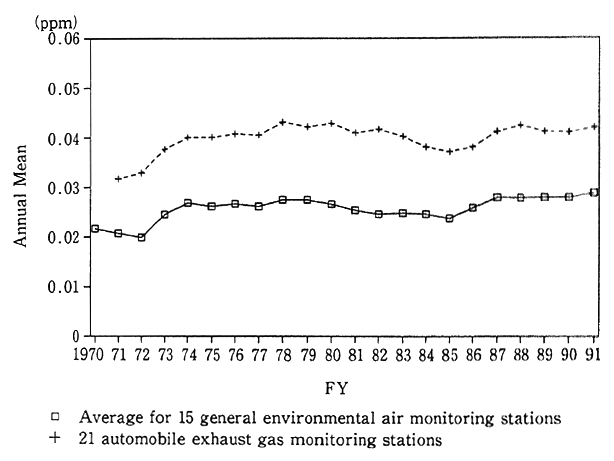
Talking about the concentration of nitrogen dioxide in fiscal 1991, the mean of annual average values registered at 15 of general environmental air monitoring stations--the 15 where monitoring had been uninterruptedly made since 1970--stood at 0.029 ppm. At 21 of automotive exhaust gas monitoring stations established to come to grips with roadside air pollution--the 21 where monitoring had been uninterruptedly made since 1971--the mean of annual average values was 0.042 ppm (Fig. 1-1-1). Those values were worse than in fiscal 1990 --in fact, the worst annual mean for general environmental air monitor- ing stations. The year by which the environmental quality standards set for nitrogen dioxide, the standard value of which was revised in 1978, was supposed to be 1985, but even in fiscal 1991, environmental quality standards were not satisfied primarily in major cities. A check of trends in the past reveals that there had been signs of an improvement in the mean of annual average values at general environmental air monitoring stations until fiscal 1985 following 0.028 ppm in fiscal 1978 and 1979, but with a bottom of 0.024 ppm in fiscal 1985, it began to worsen. Though there had also been signs of an improvement in the mean of yearly average values at automotive exhaust gas monitoring stations since fiscal 1980, coming to 0.043 ppm, it started to worsen with bottoming in fiscal 1985. In recent years, the value has leveled off.
Fig. 1-1-1 Secular Trends in Annual Mean of Nitrogen Diox- ide at Continuously Monitoring Stations
Source : Environment Agency
The Environment Agency has surveyed links between trends in air pollution and respiratory symptoms and diseases, including school- children's asthma. As the survey reveals signs of a rise in the new incidence of asthma-like symptoms in highly carbon dioxide-polluted areas relative to less polluted areas, prompt remedies are required for pollution which exceeds environmental quality standards.
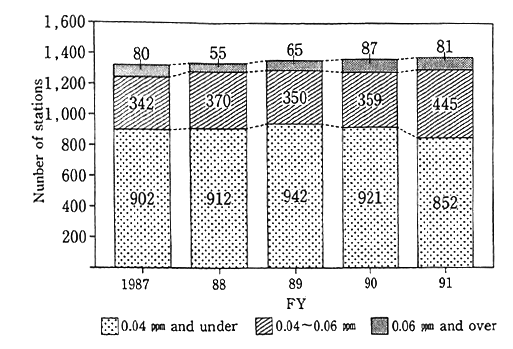
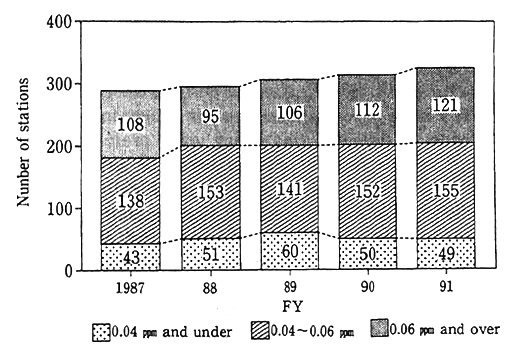
Fig. 1-1-2 Trends in Satisfaction of Environmental Quality Standards for Nitrogen Dioxide
Source:Environment Agency
Source:Environment Agency
A survey of responses to environmental quality standards across the nation reveals that of all valid monitoring stations across the nation (stations which did monitoring for more than 6,000 hours a year), 81 general monitoring stations (87 in fiscal 1990) registered upwards of the borderline figure of 0.06 ppm in fiscal 1991, and their rate stood at 6.4% (5.4% in fiscal 1990) of all valid monitoring stations. When it comes to automotive exhaust gas monitoring stations, the values of 121 valid stations in fiscal 1991 (112 in fiscal 1990) were in excess of the borderline value, and their rate came to 37.2% (35.7% in fiscal 1990)(Fig.1-1-2). A check of the attainment of environmental quality standards in three districts (Tokyo's 23 special wards and other districts, Yokohama City and other districts, Osaka City and other districts), where a system of areawide total pollutant load controls is enforced for industrial plant and other fixed generation sources, indicates that 59 of 112 general air monitoring stations (59 of 109 general air monitoring station in fiscal 1990) and 67 of 72 automotive exhaust gas monitoring stations(64 of 72 automotive exhaust gas monitoring stations in fiscal 1990) had yet to satisfy environmental quality standards.
The tasks of coping with nitrogen oxides and the direction in which measures should be taken are to be introduced in 2, Section 2. Chapter 4. With regard to nitrogen oxides discharged from automotive exhaust gas, the reductions of which is necessary for the attainment of environmental quality standards, the Special Measures Law for Reduc- tions in the Areawide Total Load of Nitrogen Oxides Emitted in Specified Districts (known also as the Automotive N0X Law) was enacted in June 1992, under which more powerful measures were im- plemented. This law is designed to specify areas where it would be difficult to achieve environmental quality standards m rely with the enforcement of conventional measures and for the central government to formulate a basic policy on measures for reduction in areawide total pollutant loads. In line with this policy, each prefectural government will work out a program for cuts in areawide total pollutant loads entailing a wide variety of measures. Specifically, restrictions are placed on the types of autos to be used, and the shift to types featuring lower emissions of nitrogen oxides is encouraged. With this law, it is expected that pollution by nitrogen oxides in major cities, such as Tokyo and its vicinity, will be mitigated.
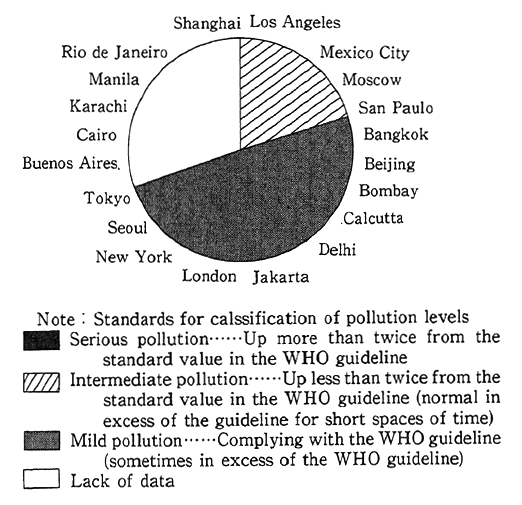
When it comes to foreign countries, the survey made by the United Nations Environment Programme (UNEP) and th World Health Organization (WHO) on Tokyo, New York and 19 other major world cities reveals that Los Angeles, Mexico City, Moscow and San Paulo were affected by medium degrees of pollution with nitrogen oxides. The survey also reported that pollution in those cities was in excess of the air quality guidelines (400 Jg/m2 in terms of one-hour values, equivalent to 0.21 ppm) specified by WHO/EURO (the Secretar- iat of the World Health Organization's European regional chapter) (Fig. 1-1-3). Western nations are striving to drastically reinforce measures to cope with nitrogen oxides--the areas in which they are behind Japan.
Fig. 1-1-3 Levels of Nitrogen Oxides in 20 Megacities of the World
Source:UNEP/WHO, Urban Air Pollution in Megacities of the World
(2) Sulfur Oxide
Sulfur oxide (SO2) comes out in the combustion of oil containing sulfur and coal, among others. Bringing about adverse impacts on the respiratory system, it is a causative factor for so-called environmental- pollution diseases, including Yokkaichi Asthma?? It is also a causative factor for acid rain which impact forests, lakes and reservoirs.
In Japan, fossil fuels were used in large quantities primarily in industrial zones without adequate measures against environmental pollution. Sulfur oxides gave rise to severe air pollution, eventually leading to the outbreak of Yokkaichi Asthma and other health prob- lems. To cope with those developments, a wide variety of measures have been in force since 1969 when environmental quality standards (under which the daily mean of one-hour values was set at downwards of 0.04 ppm and the one-hour value at less than 0.1 ppm) were formulated, including progressive emission controls on each soot and dust emitting facilities (K-Value Control), controls on sulfur contents in fuels (enfor- ced in 1971 and subsequently reinforced), and the controls introduced in 1974 on total emissions by each factory in designated areas. With those powerful measures, Japan took the lead in the world in the reduction of sulfur oxides emissions and the concomitant adoption by business and other establishments of flue gas desulfurization facilities. This made it possible to significantly improve sulfur oxides concentrations in the atmosphere with the mean of annual average values at 15 general environmental air monitoring stations (where the monitoring started in fiscal 1965), dropping to 0.0 10 ppm from a peak of 0.059 ppm in fiscal 1967. Favorable trends were also observed in fiscal 1991 with the mean standing at 0.011 ppm for general environmental air monitoring stations and also at 0.011 ppm for 16 automotive exhaust gas monitoring stations (where the monitoring started in fiscal 1973) (Fig. 1-1-4). In terms of percentage, the attainment of environmental quality standards came to 99.7% for general environmental air monitoring stations and 98.6% for automotive exhaust gas monitoring stations.
Fig. 1-1-4 Secular Trends in Annual Mean of Sulfur Dioxide (Average of Continuously Monitoring Stations)
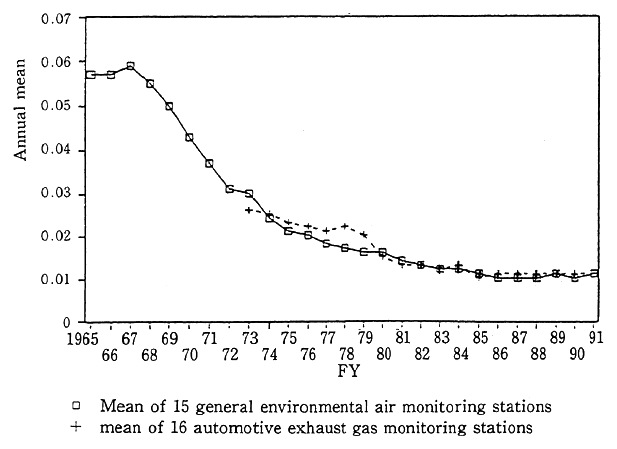
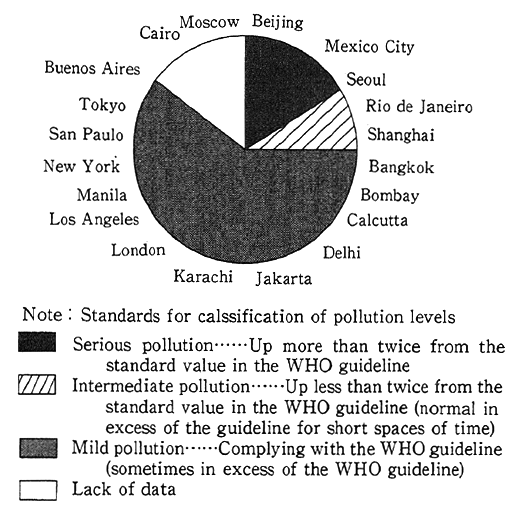
A check of foreign countries indicates that there have been significant improvements in OECD countries, but in developing and East European countries, where industrialization is being significantly stepped up or where fossil fuels high in sulfur content are used in large quantities, sulfur oxide concentrations have reached serious levels, particularly in major cities. According to the UNEP and WHO survey, Beijing, Mexico City and Seoul find themselves in serious condition, whereas pollution in Rio de Janeiro and Shanghai are rated middle, exceeding the guideline (350 Jg/m2 in terms of one-hour values, equiva- lent to 0.12 ppm) (Fig. 1-1-5).
Fig. 1-1-5 Levels of Sulfur Dioxide in 20 Megacities of the World
Source:UNEP/WHO, Urban Air Pollution in Megacities of the World
(3) Photochemical Oxidant and Nonmethane Hydrocarbon
a. Photochemical Oxidant
Photochemical oxidant is a substance which is secondarily gener- ated by a reaction of nitrogen oxides (NOx) and hydrocarbons (HC3) under the influence of solar rays and which has powerful oxidizing properties, such as ozone. Photochemical oxidant causes what is gener- ally known as photochemical smog, bringing about adverse impacts on man's health, including aggravation of membranes, and adverse effects on farm produce and other plants. Ozone is considered to have far more powerful greenhouse effects than carbon dioxide. Of hydrocarbons, various nonmethane hydrocarbons, or hydrocarbons devoid of methane less reactive to photochemical reactions, function as a causative factor for photochemical oxidant. They are emitted from autos like nitrogen dioxide and also from painting, printing and other plants and establish- ments which use solvents containing hydrocarbons. The central and local governments have provided guidance for curbs on the emission of those substances.
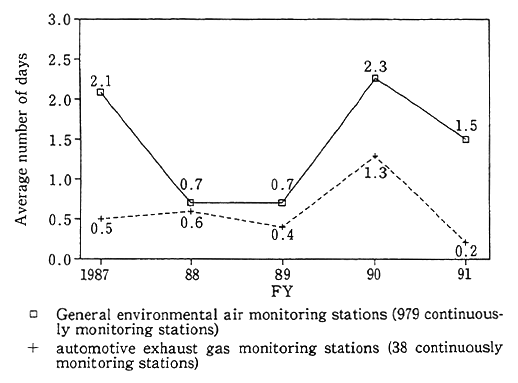
Fig. 1-1-6 Trends in Number of Days per Station with Appearance of Photochemical Oxidant Con- centrations of More Than 0.12 ppm
Source: Environment Agency
As regards photochemical oxidant, an environmental quality standard is formulated (less than 0.06 ppm in terms of one-hour values). Besides, in "situations where the one-hour value is in excess of 0.12 ppm and it is concluded in terms of meteorological conditions that this state of pollution will remain intact," it is stipulated that a photochemical oxidant warning be issued and various measures be taken to prevent health damage, such as not engaging in outdoor exercise. The average number of days per monitoring station in fiscal 1991 when the one-hour value exceeded 0.12 ppm was 1.5 for general environmental air monitor- ing stations and 0.2 for automotive exhaust gas monitoring stations, when it came to stations whose monitoring had been uninterruptedly done since fiscal 1987, suggesting that the values were lower than in fiscal 1990 (Fig. 1-1-6).
Talking of foreign countries, some data suggest that the volume of ozone on the ground in Europe has doubled in the last century indicating that the ozone level is on the upswing in conjunction with rises in the concentration of nitrogen oxides and other chemicals.
b. Nonmethane Hydrocarbon
No environmental quality standards are formulated for nonmeth- ane hydrocarbon. Instead, a guideline is formulated on concentrations (0. 20 ppmC to 0.31 ppmC from 6 to 9 a.m.; ppmC represents a concentration in terms of carbons contained in various hydrocarbons) to prevent the generation of photochemical smog, and various measures are taken to assure compliance with the guideline.
In recent years, there have been signs of a slight drop in the mean of annual average values at six general environmental air monitoring stations which have been uninterruptedly monitoring since fiscal 1978 from 6 to 9 a.m., and in fiscal 1991, it stood at 0.53 ppmC, virtually the same as in the previous fiscal year. At nine automotive exhaust gas monitoring stations whose monitoring has uninterruptedly continued from fiscal 1977, there have also been signs of a slight drop in the mean of annual average values from 6 to 9 a.m. with the fiscal 1991 mean registered at 0.51 ppmC, slightly lower than in the previous fiscal year.
(4) Carbon Monoxide
Carbon monoxide (CO) in the air comes out of an incomplete combustion of fuels, and autos may be considered the primary source of generation. Combining with hemoglobin in the blood, carbon monoxide affect man's health, such as impairment of the ability to carry oxygen. Besides, it is known for prolonging the life of methane in the atmo- sphere, a greenhouse gas. In Japan, an environmental quality standard (the daily mean of one-hour values should be less than 10 ppm and the eight-hour mean of one-hour values should be downwards of 20 ppm) was formulated in 1973, and automotive exhaust gas has since been controlled.
When it comes to carbon monoxide concentrations in fiscal 1991, the mean of annual average values at five general environmental air monitoring station whose monitoring had uninterruptedly continued since fiscal 1971 stood at 0.7 ppm, whereas the mean of annual average values at 14 automotive exhaust gas monitoring stations whose monitor- ing has uninterruptedly continued since fiscal 1971 came to 2.2 ppm. A check of trends in the past reveals that the situation has markedly improved since the first half of the 1970s period, when the mean of annual average values stood at 2.1 ppm for five general environmental air monitoring stations with their monitoring uninterrupted and 5.4 ppm for stations uninterruptedly monitoring automotive exhaust gas. Envi- ronmental quality standards have been consistently achieved for all monitoring stations since fiscal 1983, when the standars were met across the nation.
Talking of foreign countries, the UNEP and WHO survey sug- gests that Cairo, Jakarta and five other cities are affected by a middle degree of pollution in excess of WHO/EURO's guideline (with the one-hour value at 30 mg/m3, equivalent to 26 ppm).
(5) Suspended Particulate Matter
Suspended Particulate Matter (SPM) is a microscopic substance suspended in the atmosphere (atmospheric aerosol) with its grain diame- ter less than 10 microns. Suspended Particulate Matter is so microscopic that it stays in the air for so long and affects the respiratory system as it settles in the lung and trachea. The sources for the generation of Suspended Particulate Matter include soot and dust from the smoke- stacks of factories and business establishments, black smoke in the exhaust gas of diesel autos, and particulate matter by which nitrogen oxides, sulfur oxides and other gaseous matter are discharged in the atmosphere. Suspended Particulate Matter is also generated by the workings of nature, such as the creation of dust clouds. Though the generation sources are diverse, an Environment Agency survey suggests that black smoke, particularly from diesel autos, accounts for 20-40% at many places. In 1972, Japan came out with an environmental quality standard specifying that the daily mean of one-hour values should be less than 0.10 mg/m3 and the one-hour value should be downwards of 0. 20 mg/me). For the attainment of the standards, emission controls have been in force for factories, business establishments and autos.
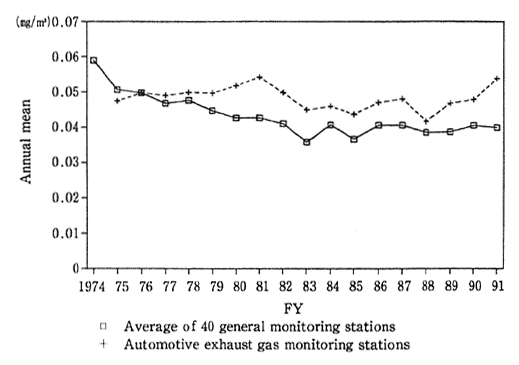
Talking of the concentration of suspended particulate matter, the mean of annual average values at 40 general environmental air monitor ing stations (monitoring uninterruptedly from fiscal 1974) was 0.040 mg/ m3 leveling off from fiscal 1990 (0.041 mg/m3). The mean of annual average values at six automotive exhaust gas monitoring stations (monitoring uninterruptedly from fiscal 1975) stood at 0.054 mg/m3, worse than in fiscal 1990 (0.048 mg/m3) (Fig. 1-1-7). In terms of percent-
age, the attainment of environmental quality standards rose from 43.1% in fiscal 1990 for 552 of 1,282 general environmental air monitoring station to 49.7% for 670 of 1,348 general environmental air monitoring stations in fiscal 1991. As regards automotive exhaust gas monitoring stations, th ratio also went up from 21.2% for 33 of 156 stations in fiscal 1990 to 30.1 % for 50 of 166 stations in fiscal 1991. Those values suggest that the attainment rates remained low. By prefecture, the attainment rate is low for the National Capital Region which centers on Tokyo.
Fig. 1-1-7 Secular Trends in Annual Mean of Suspended Particulate Matter
Source:Environment Agency
Of all particulate substances in the air, those which fall on the ground surface are known as dust fallout. In fiscal 1991, the mean of annual average values at 16 monitoring points, came to 3.5 tons/km2/ month, slightly larger than in fiscal 1990 with 3.3 tons/km2/month.
In snowy and cold areas, the fallout of dust caused by studded tires with metal rivets fitted on their surface was at issue in the snow season, as they scratched the roads surface. To cope with this damage, the Law for the Prevention of Studded-Tire Dust Generation was enacted, putting a ban on the use of studded tires in districts designated by the Director-General of the Environment Agency in April 1991. With such measures in force, there are signs of a significant drop in the volume of dust fallout in Sapporo, Matsumoto and other cities where the monitoring is performed (Fig. 1-1-8).
Fig. 1-1-8 Secular Trends in Volume of Dust Fallout

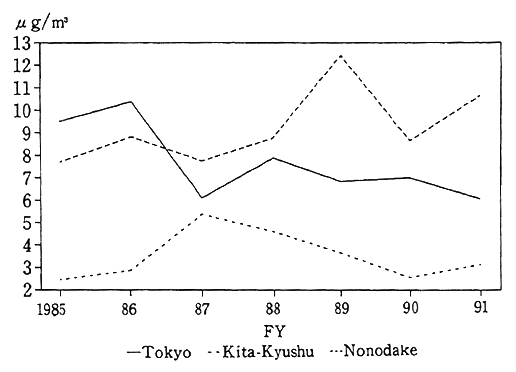
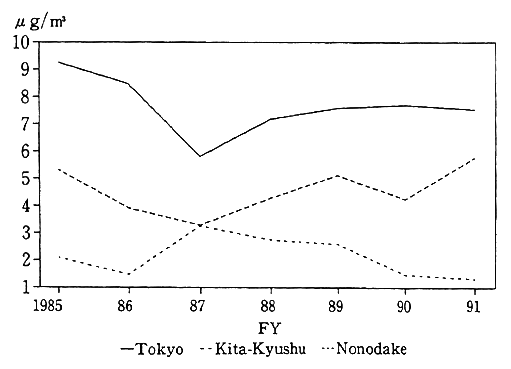
Fig. 1-1-9 Secular Trends in Concentration of Ion Sulfate and Ion Nitrate
Findings of observation of sulfurous radicals at State- established environmental air monitoring stations
Findings of observation of nitric radicals at State-established environmental air monitoring stations
Source:Environment Agency
In addition, monitoring stations are monitoring ion nitrate, ion sulfate and other components in aerosol and other suspended matter. No significant changes have been observed in the findings of the monitor- ing, as we will see in the figure (Fig. 1-1-9).
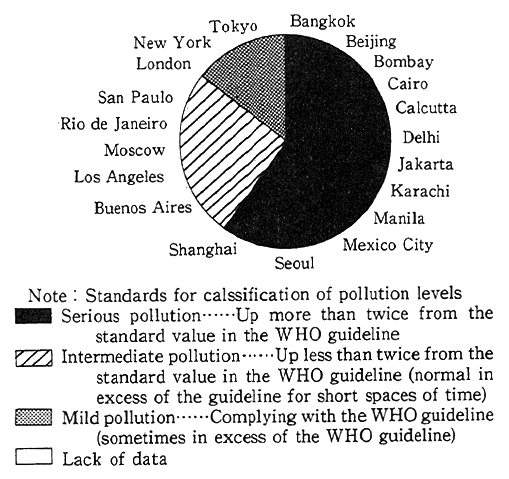
As regards the conditions of suspended particulate matter in foreign countries, the UNEP and WHO survey reports that the condi- tions in Bangkok, Beijing and 10 other cities are serious, and that the degrees of pollution in Buenos Aires, Los Angeles and three other cities are moderate (Fig. 1-1-10).
Fig. 1-1-10 Levels of Sulphur Dioxide in 20 Megacities of the World
Source:UNEP/WHO, Urban Air Pollution in Megacities of the World
(6) Stratospheric Ozone, Chlorofluorocarbon (CFC), Etc.
a. Stratospheric Ozone
The ozone layer which contains much ozone (O3) spreads over the stratosphere. The ozone layer absorbs most of the ultraviolet rays with hazardous wavelengths contained in the sunlight which drench the Earth That is why stratospheric ozone is likened to a space suit for the Earth. In recent years, however, experts have warned that the invaluable ozone layer is being depleted. In the stratosphere, ozone is generated from oxygen under intense sunlight, and the balance is normally maintained by a reaction in which ozone reverts to oxygen. In recent years, how ever, CFCs (short for chlorofluorocarbon, a kind of fluorocarbon), halon and other chemicals, discharged on the surface, have reached the strato sphere disrupting the natural balance with the atoms of chlorine and bromine contained in those substances.
Fig. 1-1-11 Southern Hemisphere's Distribution of Average Yzone Vol umes and Normal-Year Rates
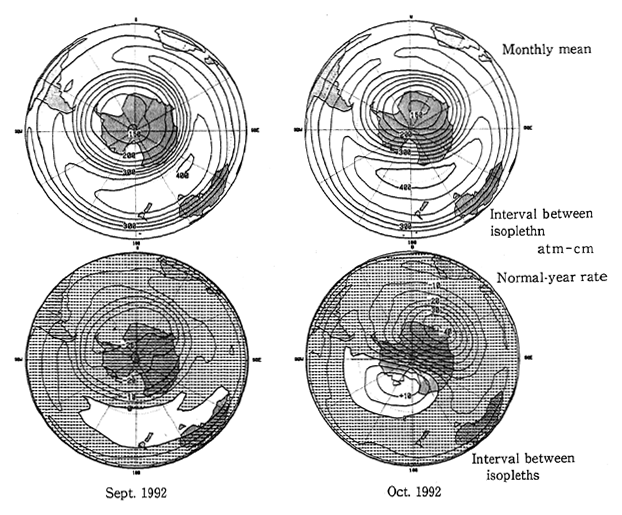
Note:The normal-year ratio is rate to the month-specific annual mean in 1979-91. Prepared after a comparison of the TOMS data offered by the NASA with the values monitored by Dobson's meter.
Source:Meteorological Agency, Global Warming Surveillance Report 1992
Fig. 1-1-12 Secular Trends in Ozone Hole Over Antarctic
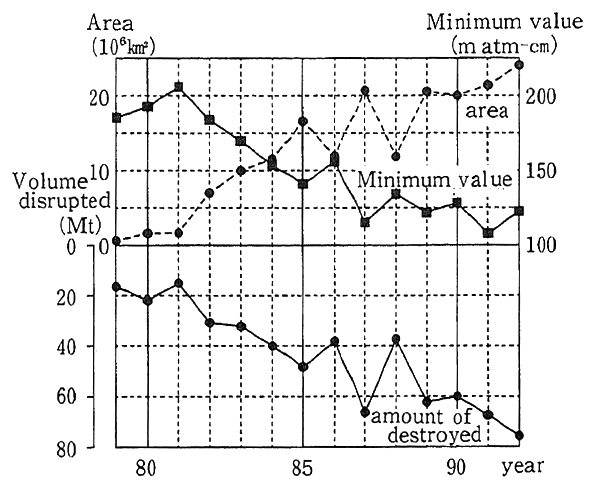
Notes:(1)Annual extremes are given for the area of the ozone hole, the minimum volume of ozone in all and the volume of ozone disrupted. The dotted line in the upper half denotes area, solid line represents the total volume of ozone at minimum (minimum val ue) and the solid line in lower half indicates the volume of ozone disrupted. Prepared in a comparative study on TOMS (6th eiition) offered by the NASA with values measures by Dobson's Meter.
(2)"m atm-cm"(short for milliatomcentimeter) is the unit which represents the total volume of ozone. By "total volume of ozone," it means the volume of ozone in the perpendicular air column of the atmosphere. For example, 300 m atm cm is equivalent to a thickness of 0.3 cm when all ozone in the column is compressed to 1 atmosphere at 0?
Source: Meteorological Agency, Global Warming Surveillance Report 1992
For example, the ozone hole, a phenomenon in which ozone concentrations are significantly depleted in the Spring season for the Southern Hemisphere (from September to October) comes out over the Antarctic. A huge ozone hole was observed for four consecutive years from 1989 to 1992 (Fig. 1-1-11). In particular, the area and volume of ozone disruption at the zenith of the ozone hole in 1992 were significant- ly greater than the all-time highs registered in the preceding year, up about 10% (Fig. 1-1-12). Over the Showa Base, the total volume of ozone significantly rose from a record low and a layer with virtually no ozone appeared at altitudes of 13-18 kilometers for more than one month. Over the Arctic, on the other hand, so significant a depletion of stratospheric ozone as in the Antarctic had not been observed, but the airborne survey conducted by the U.S. National Aeronautics and Space Administration (NAS revealed that the concentration of chlorine monoxide, powerful in depleting ozone, was extremely high. In the periphery of the Arctic, areas with large drops in the total volume of ozone were observed near the Scandinavian peninsula in February of 1989 and 1990 and over the Baltic in January of 1992.
Fig. 1-1-13 Distribution (Year-round) of Total Volume of Ozone over Japan
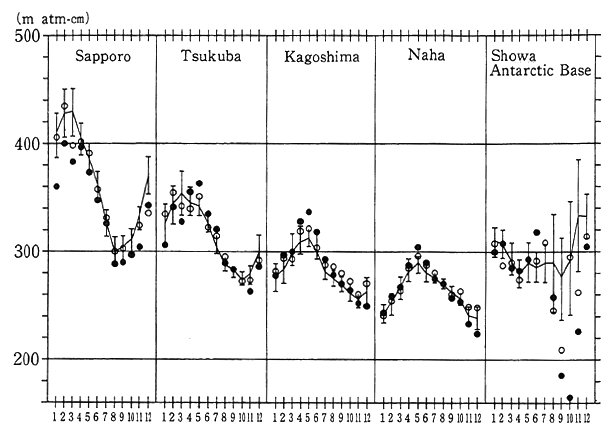
Notes:This figure indicates the means of the total volumes of ozone at four points in Japan (Sapporo, Tsukuba, Kagoshima and Naha) and the Showa Base in the Antarctic. The black dots represent monthly means in 1992, the white dots denote monthly means in 1991, the solid lines indicate annual means by month (1961-90; 1974-90 for Naha), and the vertical lines show standard deviations.
Source:Meteorological Agency, Global Warming Surveillance Report 1992
The total volume of ozone in 1992 featured smaller amounts in all months than in a normal year around the world and small values at high latitudes of the Northern Hemisphere in the wintertime.
In Japan in 1992, the total volume of ozone remained smaller in months, other than April and July in Hokkaido, than in the normal year, and in January, March and November, an all-time monthly low was registered. In Tsukuba, Kagoshima and Naha, it was roughly the same as in the normal year. In May, Naha chalked an all-time high, and Kagoshima also registered an all-time monthly high. The mean value for 1992 was 5.8% lower for Sapporo and 0.6% lower for Tsukuba than the mean of annual average values in the preceding years (Fig. 1-1-13).
In Sapporo, incidentally, a significant drop of 5.6% per decade was observed. Only in the wintertime, the rate came to about 12% per decade.
Fig. 1-1-14 Findings of Observation of Hazardous Ultraviolet Rays at 4 Points in Japan
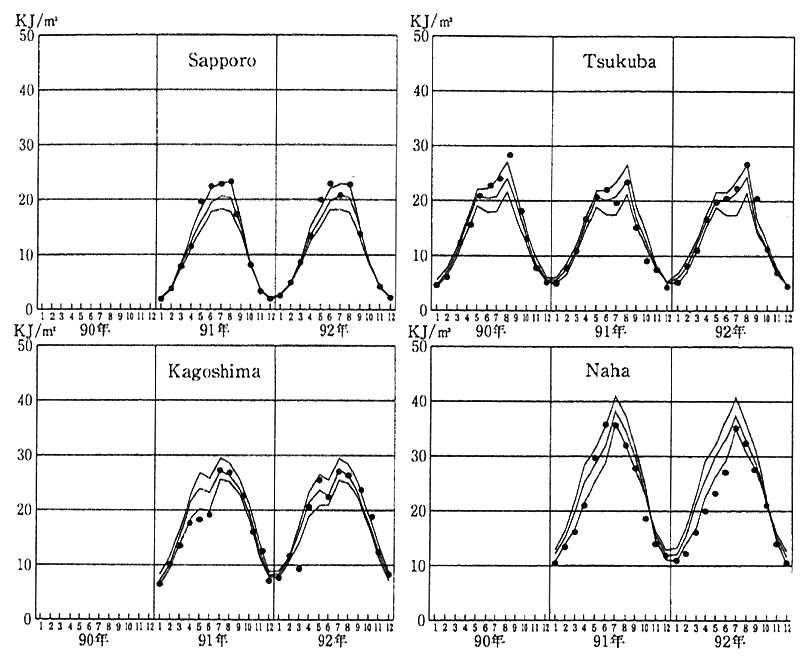
Notes:The black dots denote the values monitored in 1889-92. Of the three curves, the middle one represents estimated means in 1981-91, and the upper and lower ones show their standard deviations.
Source:MeteorologicalAgency, Global Warming Surveillance Report 1992.
With depletion of the ozone layer, there is concern about a rise in the volume of ultraviolet rays with hazardous wavelengths (called UV-B with wavelengths of 280-315 nm) reaching the earth. The increase of UV-B accelerates the incidence of skin cancer, cataract and other health damage for man, hampering the growth of plants and that of shallow- sea animal and plant plankton which form the basis for oceanic eco- systems. To maintain surveillance over changes in the volume of haz- ardous UV-B caused by a depletion of the ozone layer, Japan began to monitor hazardous UV-B in 1990. As a result of the observation done until December 1992, it was confirmed that the volume of UV-B reach- ing the ground increase with the a decrease in ozone, unless conditions other than ozone altered, though there were no signs of a rise in the observed value of UV-B from the estimated value for the normal year (Fig. 1-1-14). Thus, it is necessary to continue our observations.
b. Chlorofluorocarbon (CFC), Etc.
CFC is used in a broad range of sectors, such as cooling agents, detergents and foaming agents. Other ozone disrupters include carbon tetrachloride, 1, 1, 1-trichloroethane, hydrochlorofluorocarbon (HCFC) and methyl bromide, among others. Under the Law for Protection of the Ozone Layer With Controls on Specified Substances in line with the Montreal Protocol, an international arrangement for protection of the ozone layer, Japan is working for curbs on emissions and for a rationali- zation of uses, as a minimum of controls on the production of ozone- layer disrupters.
Japan is observing the concentrations of CFC and other gases in the atmosphere in areas at the middle range of latitudes in the Northern Hemisphere (Hokkaido and Ayasato, Sanriku Town, Iwate Prefecture) and in the Antarctic (Japan's Showa Base). As illustrated in Fig. 1-1-15, there were signs of a rise in the concentration of all those substances, but of late, rises in the concentration of CFC-11, 12 and 113 in areas at a range of middle latitudes in the Northern Hemisphere are virtually stable. Nonetheless, the concentrations of CFC and other chemicals in the atmosphere at present are far higher than in the 1970s when an ozone hole was observed over the Antarctic. For improvements in the conditions of the stratospheric ozone layer, it is necessary to reduce those concentrations to a significant extent.
Incidentally, CFC and other gases are closely tied in with global warming. The greenhouse effects of those gases are higher than those of carbon 'dioxide, but it is pointed out in recent findings that they have reverse effects on indirect warming, as they disrupt the ozone layer of the lower stratosphere.
Fig. 1-1-15 Transition of Average Atmospheric Con- centrations of Controlled Halocarbons such As CFC in the Mid-Latitude Northern Hemisphere (N:Hoppaido) and in the Southern Hemisphere(S.Antarctic Syowa Station)
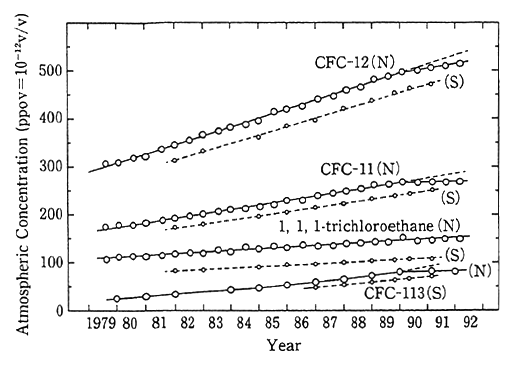
Note:"N" denotes Hokkaido; "S" stands for Showa Base in the Antarctic.
Sources:Takeshi Tominaga and Yoshihiro Makide, Nihon Kagaku Kaishi, p 351, 1991; T. Tominaga, Pure and Applied Chemistry. pp 64 and 529, 1992; Yoshihiro Makide, RitsuminChin, Tohjima Yasunori and Ta keshi Tominaga, Presented at the 65th Spring Annual Meeting of the Chemistry Society of Japan (1993, Tokyo). "Ppt" represents one-one millionth of ppm in concentration.
Reference:According to the observation done by the Meteor ological Agency at Ayasato, Sanriku Town, Iwate Prefecture, the concentrnation of CFC 11 and 12 stood at 310 ppt and 520 ppt, respectively.
(7) Carbon Dioxide
On the earth, carbon dioxide (CO2), methane (CH4) and other greenhouse gases shield the infrared rays radiated from the ground surface, thus making it difficult for heat to escape into space. By this mechanism, the temperatures suitable for the survival of organisms are maintained. In global warming, the concentrations of those greenhouse gases in the atmosphere rise due to man's various activities, thereby leading temperatures to rise at paces man has never experienced. There is concern that rises in temperature will change the climate, raise the sea level, change the rainfall and bring about structural changes in the ecosystems, thus producing significant impacts on the living environ- ment of man and organisms, agriculture and forestry.
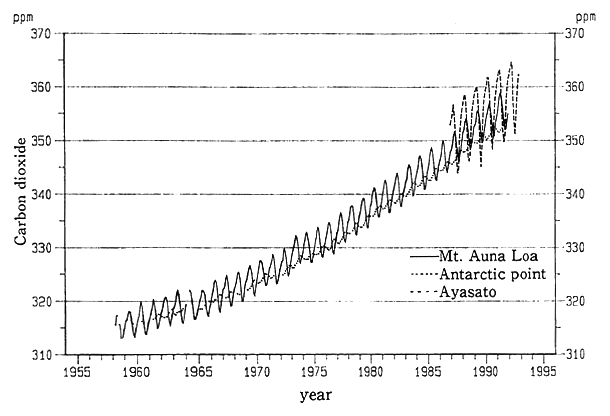
Of all greenhouse gases, a check of carbon dioxide indicates that the degree to which they contribute to global warming accounted for about 55% of the total effects caused by various greenhouse gases in the 1980s, according to a report (1990) of the Intergovernmental Panel on Climate Change (IPCC), which gathers global findings. In terms of greenhouse effects by identical amounts of gas, the contributions made by methane are far greater, but the emissions of carbon dioxide are so greater that it is assumed that the contributions made by carbon dioxide in the atmosphere to global warming are greater. The concentration of carbon dioxide in the atmosphere, which had stood at 280 ppm or so before the Industrial Revolution, is now in excess of 350 ppm, and it is surmised that they are increasing at an annual rate of 0.5%. When it comes to Japan, observation began in Ayasato, Sanriku Town, Iwate Prefecture, in 1987, and the annual average concentration in 1992 came to 359.6 ppm, increasing at an annual rate of 0.5% as elsewhere in the world (Fig. 1-1-16). The IPPC reports that should no measures be taken against the upturn of those greenhouse gases, the average temperature for the whole earth will rise by about 1 degree by 2025 and about 3 degrees by the end of the 21st century. It also projects that the sea level will be about 20 centimeters higher by 2030 than at present, and about 65 centimeters (1 meter at the most) by the end of the 21st century.
Carbon dioxide is generated mostly from the combustion of fossil fuels, associated with man's broad range of socioeconomic activities. Various measures have already been taken, primarily by developed countries. However, decisive remedies have yet to be worked out. As a project of international collaboration for the prevention of global warming, the U.N.Framework Convention on Climate Change, was adopted in May 1992 to stabilize greenhouse gas concentrations in the atmosphere, and international work is now under way for its enforce- ment. Under the Global Warming Prevention Action Program (1992), Japan is making efforts, such as for reductions in the emission of carbon dioxide and other gases, as you will see in 8, Section 1, Chapter 4.
Fig. 1-1-16 Trends in Carbon Dioxide Concentrations at Mt. Auna Loa, Hawaii, Antarctic Point and Meteorological Agency's Meteorological Observation Station at Ayasato, Sanriku Town, Iwate Prefecture
Note:Prepared by the Meteorological Agency's Warming Information Cen- ter (WMO's World Data Center on Greenhouse Gases).
Source:Global Warming Monitoring Report 1992
(8) Methane and Other Greenhouse Gases
Beside carbon dioxide, the greenhouse gases include methane, nitrous oxide (nitrogen suboxide, N2O), tropospheric ozone and chloro- fluorocarbon, among others.
In terms of a time span of 100 years or so, methane is considered as having about 21 times as many greenhouse effects as carbon dioxide. When methane is dissolved in the atmosphere, carbon dioxide, green- house gas and stratospheric vapor increase, thereby stepping up global warming. Their generation sources include natural generation sources, such as marshes, lakes and reservoirs, and artificial generation sources, including the leak of natural gas, paddy rice fields and reclaimed lands for waste dump areas. With the progress of warming, there is concern that methane fixed in the ground and sea is released, further accelerat- ing warming.
According to the analyses of the atmosphere in the last 3,000 years, the concentrations of methane in the atmosphere had been almost constant until 250 years or so ago, but it is surmised that they have roughly doubled in the last 200 years or so (Fig.1-1-17). In Japan, observation has been made at Ayasato, Sanriku Town, Iwate Prefec- ture, since 1991, the annual average concentration in 1991 and 1992 stood at 1,790 ppb (one thousandth of 1 ppm). The Environment Agency monitored methane concentrations over Siberia in 1992 to make clear phenomena in which methane will increase, as organic matter on the frozen ground tends to be dissolved by warming. The findings on the high-altitude distribution of methane indicates that the closer to the ground, the higher the concentration, and that the concentration were low at high altitudes.
Fig. 1-1-17 Trends in Concentration of Methane in Ancient Atmosphere
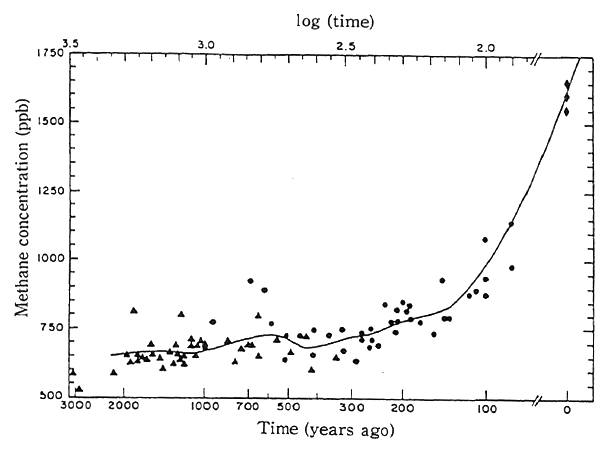
Note:Concentration of methane in the ancient atmosphere as obtained from the ice sheet cores of Greenland (●) and the Antarctic (▲). (◆) at right denotes the concentration of methane at present The solid line represents the upper scale. or the moving mean concentration. "Ppb" is equivalent to one-10,000th of ppm.
Source:Rasmussen et al.
In terms of a time span of 1.00 years or so, it is thought that nitrous oxide has about 200 times the greenhouse effect of carbon dioxide, provided that the amount is the same. The generation sources include oceans and soils as natural generation sources and the combus- tion of the biomass, including fossil fuels, firewood and manured farm- land, as artificial generation sources. It is known that th life of nitrogen oxide in. the atmosphere is long, or 150 years or so, but many points have yet to be made clear about its dynamics in a global dimen sion. The mean concentration of nitrous oxide in 1990 stood at about 310 ppb, increasing at an annual rate of 0.2-0.3% (Fig. 1-1-18). In Japan, observation has been made at Ayasato, Sanriku Town, Iwate Prefec- ture, since 1990, and the average concentration. in 1991 and 1992 came to 309 ppb and 313 ppb, respectively. Besides, it is thought that tropospher- ic ozone has fairly greater greenhouse effects than carbon dioxide, and it is known that tropospheric ozone is generated in a photochemical reaction of nitrogen oxide and hydrocarbon emitted from auto and factories. Nonetheless, it is difficult to come to quantitative grips with the present state of tropospheric ozone, and it is necessary to accumu- late scientific findings.
Fig. 1-1-18 Concentrations, Increase Rates and Warming Effects of Greenhouse Gases
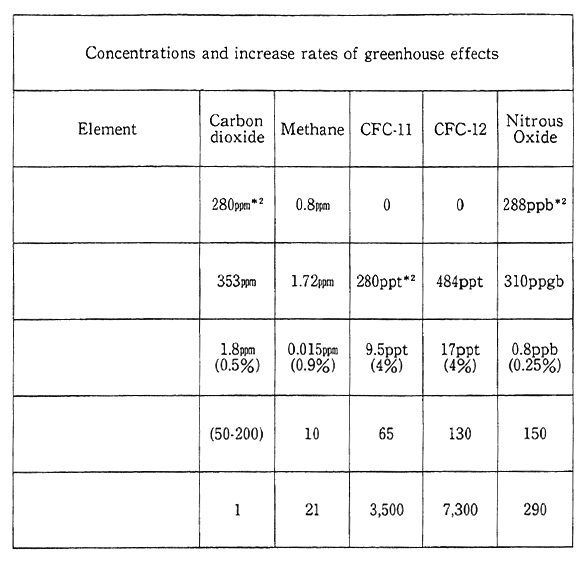
Notes
*1 Ozone is not included in this table due to a lack of accurate data.
*2 ppmv=parts per million by volume
ppbv=parts per billion by volume
pptv=parts per trillion by volume
*3 Concentrations at present (1990) are projected on the basis of the values monitored and reported in the last several years on the assumption that the latest trend of changes is virtually the same.
*4 As for the gases enumerated in the table other than CO2, the "life span here is the rate which is required to remove the total volume in the air. The time scale also characterizes the rate at which the concentration in the air is made appropriate, no matter how the release changes in volume. CO2 is an uncommon case for which there is no absorpotion source and only moves among various storages (the air, oceans and organisms). The "life span" of CO2 indicated in the table is a general yardstick for the span of time required by the concentration of CO2 to respond to changes in the volume of release.
Source:IPCC Report
(9) Other Air Pollutants
In regard to cadmium, chlorine and other matter which are regulated as hazardous substances under the Air Pollution Control I emission standards are formulated for factories or business establish ments, which are their generation sources, emission controls and other measures are in force.
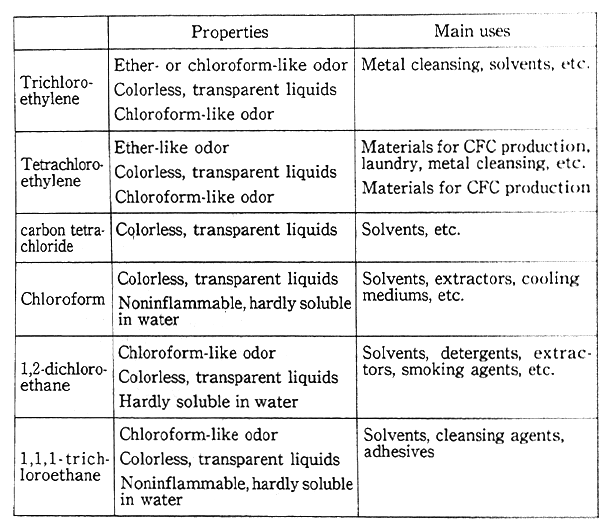
Table 1-1-1 Properties, Etc., of Various Organic Chlorine Solvents
Source:Enviroment Agency
In addition, monitoring has been performed since fiscal 1985 on substances whose concentrations have to be checked over a long span of time, even if not in levels where issues may immediately be posed for atmospheric concentrations. In fiscal 1991, as in fiscal 1989 asbestos, mercury and organic chlorine solvents (trichloroethylene and 1, 1, 1-trichloroethane, among others) were surveyed, detecting no particular substances which might pose problems (the properties of main organic chlorine solvents and so forth are given in Table 1-1-1). In fiscal 1992, as in fiscal 1990, formaldehyde and dioxins were surveyed.
Several different types of chemicals are surveyed every year to come to terms with their residue in the atmosphere of the general environment which is not directly affected by specified emission sources. In the fiscal 1991 survey, which covered 16 substances, nitroben- zene (used mainly as mediums for dyestuffs and spices) and 11 other substances were detected in the air, but there was no question, in particular, about them, when their detected concentration and frequency were taken into account.
Furthermore, as regards the chemicals specified under the Law Concerning the Screening of Chemicals and Controls on Production, Etc., and the Category 2 chemicals, their residue in the general environ- ment was surveyed to detect trichloroethylene and other substances in the atmosphere. As a result, trichioroethylene and other matter were detected in the atmosphere, and it was concluded that there was the need for further surveys and surveillance on their environmental pollu tion. As part of the studies and surveys performed on specified chemi- cals, yet another survey was started in fiscal 1990 on the medium- specific amounts of chemicals to which man has been newly exposed in his everyday life.
1-1-2 Water
Water, an important component of the environment, evaporates from the ground surface, moves along flows of air and returns to the ground surface in the form of rain or snow in a repeated major cycle. Where this water cycle is artificially changed, significant impacts will be produced on man's health and living environment and the ecosystems of nature. The major cycling of water is closely tied in with global warming as we have seen earlier.
(1) Heavy Metals, Hazardous Chemicals, Etc.
In order to prevent the pollution by hazardous matter of sea regions, rivers and other waters for public use and protect the people's health, desirable standard values for the protection of man's health were set long ago in. regard to nine items under environmental quality stan- dards for water (cadmium, cyanogen., organic phosphorus, lead, chrome (sexivalent), arsenic, total mercury, alkyl mercury and PCB) in Japan. A wide variety of health disorders will sometimes come out in situation where those substances are taken. in and accumulated in the human body in excess of certain levels. The past examples include, among others. Minamata Disease, caused by organic mercury (methyl mercury), and Itai-Itai Disease, resulting from cadmium pollution. When it comes to trichloroethylene and tetrachloroeythlene, widely used as organic sol- vents, environmental quality standards for water were formulated in April 1989 from a perspective of health protection. For the achievement and maintenance of those environmental quality standards and for the prevention of water degeneration and ensuing pollution, controls are being exercised, such as under the Water Pollution Prevention Law. For surveillance over the water quality, a continuous monitoring is done over waters for public use across the nation.
Table 1-1-2 Comparison of New and Old Health Items in Environmen- tal Quality Standards for Water
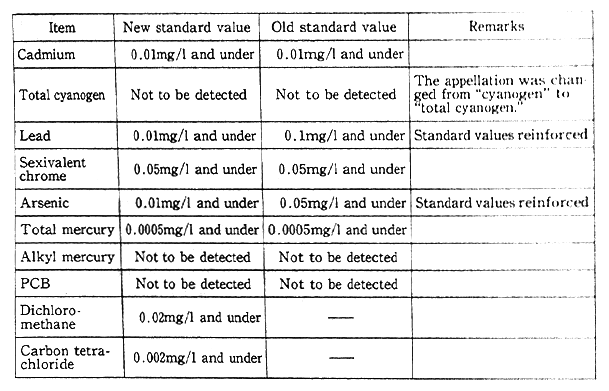
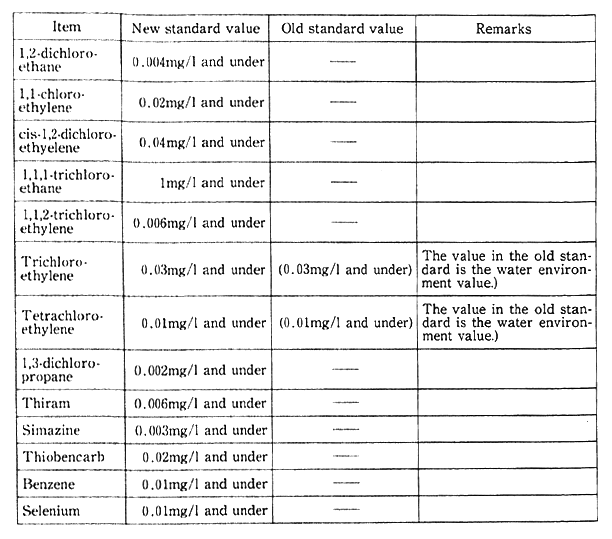
Notes:1. The standard value was changed from the maximum value (the annual mean for total mercury) to the annual mean (the maximum value for total cyanogen).
2. Organic phosphorus (Parathion, methyl Parathion, methyldemeton and EPN) was removed from the environmental quality standards.
Source:Environment Agency
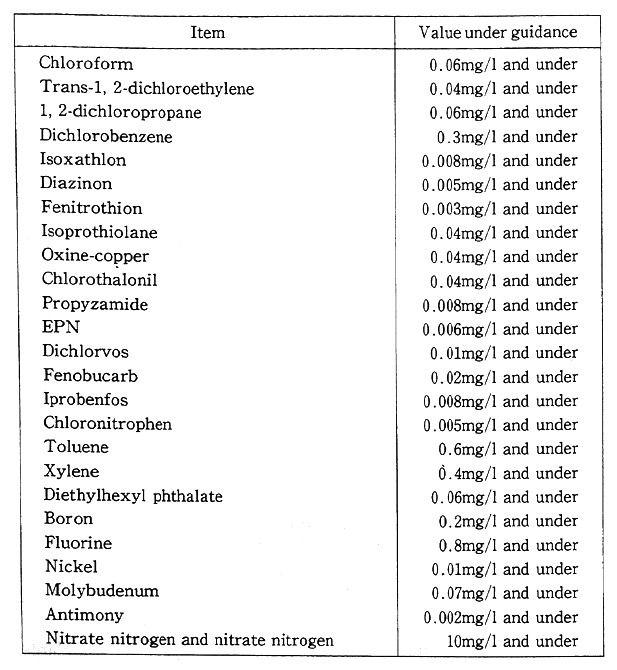
Regarding health items under environmental quality standards for water, a total of 1.5 items was added under the notification of March 1993, including trichloroethylene, tetrachloroethylene and seven other organic chlorine compounds and Simazine and three other pesticides. The total of items was set at 23 by excluding organic phosphorus from the environmental quality standards (Table 1-1-2). Plans are afoot to promote the surveillance of waters for public use and groundwater and other necessary measures from fiscal 1993. From the standpoint of preventing water pollution, it has been decided to designate chloroform, toluene and 23 other items as those requiring surveillance, continuously monitoring water to cope with future pollution in a flexible manner (Table 1-1-3).
Table 1-1-3 Items Requiring Surveillance and Values Under Guidance
Source:Environment Agency
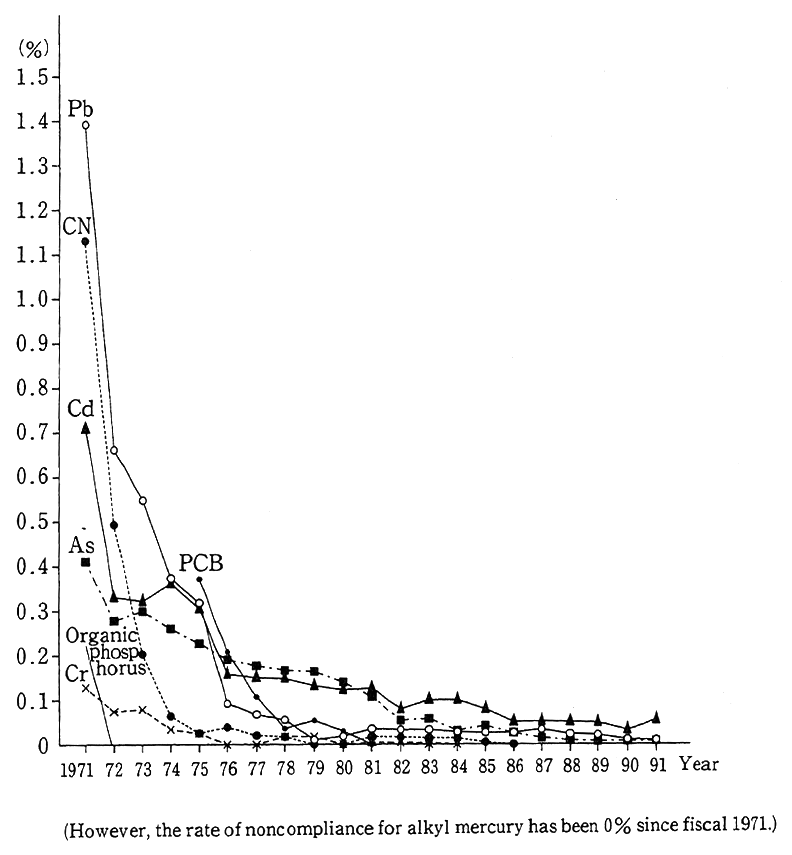
The findings of surveys on the quality of waters for public use in fiscal 1991 indicate that the rate of failure to satisfy environmental quality standards for all health items (the rate of samples in excess of environmental quality standards to the total of samples in the survey) came to 0.02% (0.10% in fiscal 1991), leveling off in recent years. The ratio stood at 0.63% in fiscal 1971 and 0.28% in fiscal 1972 (Fig. 1-1-19), but significant improvements have been made thanks to the strengthen- ing and comprehensive orientation of controls and the implementation of projects for the prevention of mining pollution. The rate of trichlor- oethylene and other items which exceeded environmental target values for water came to 0.03% in fiscal 1991 (0.04% in fiscal 1990), virtually leveling off.
Fig. 1-1-19 Treds in Item-Specific Rate of Noncempliance in Rela- tion to Health Items Under Environmental Quality Stan- dards for Water
Source:Environment Agency
As regards various chemicals not controlled under the Water Pollution Prevention Law, the residue of different chemicals in the water is monitored every year for the prevention of environmental pollution. Of 24 survey subjects, including acryloyl amide and nitroben- zene, used for dyestuff production and other purposes, six items--p-nitro- toluene used for organic synthesization, N, N-dimethylformamide used as solvents for organic synthesization, pyridine used for medicines and other purposes, and triethylamine also used for medicines and other purposes--were detected in the fiscal 1991 survey (an across-the-board survey on environmental safety to chemicals) in addition to the two aforementioned chemicals. In terms of the frequency of detection and the detected concentration, none of them was considered immediately poising a particular problem. Besides, a continuous survey (water monitoring) is made on the substances which are considered requiring independent surveys for possible environmental pollution. Dichloroben- zene, used for insecticides and other purposes, and other chemicals were detected, as in the preceding fiscal year, and though there were levels of pollution where problems would immediately be posed, it was decided to continue the monitoring.
In surveys of the residue of chemicals in water designated under the Law Concerning the Screening of Chemicals and Controls on Pro- duction, Etc., all five survey items, such as 1, 2-dichloroethane widely used as compound materials, were detected, and it is considered neces sary to continue those surveys. As regards pollution by organic tin and other chemicals used for ship bottom paints and so forth, there are signs of a level-off or a slight decrease, given guidance on a constraint from their use.
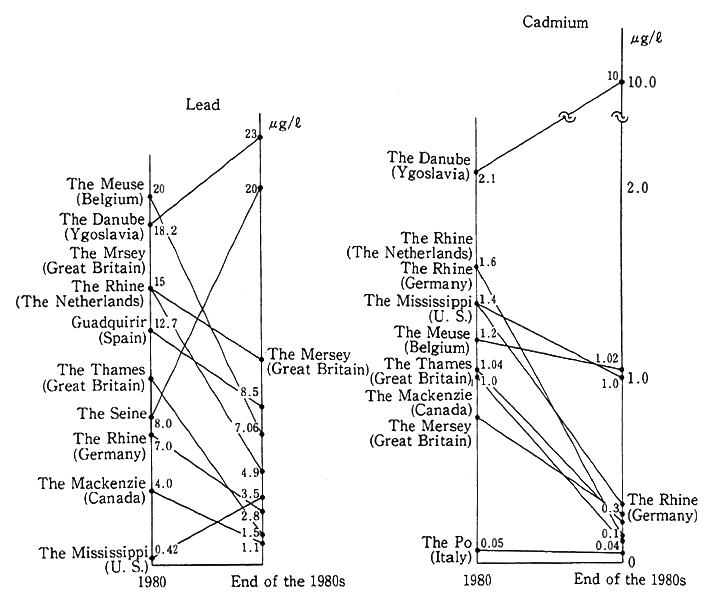
Trends in the pollution of main rivers in foreign countries by lead and cadmium are illustrated in Fig. 1-1-20, and there are signs of an improvement in many developed countries. It is pointed out, nonetheless, that pollution by hazardous heavy metals in some developing countries are serious.
(2) Organic Pollution, Etc.
Fig. 1-1-20 Trends in Concentrations of Lead and Cadmium in Devel oped Countries' Main Rivers
Source:Prepared on the basis of OECD Environmental Data 1991.
Notes:*The value represents that of the estuary of each river or its most downstream part within the national border.
*As each country has its own sampling method, care must be exer- cised about interpretation. Secular trends in the water quality should be compared, rather than the absolute pollution value, for each river.
When it comes to the water quality tied in with the living environ- ment in Japan, environmental quality standards are formulated as environmental conditions, the maintenance of which is desirable for conservation of the living environment, for the concentrations of five items--biochemical oxygen demand (BOD), hydrogen iron concentration (pH), quantity of suspended substances (SS), quantity of dissolved oxygen (DO) and number of colitis germ legions--in rivers, a total of seven items--chemical oxygen demand (COD), the last four items in the case of rivers, total nitrogen. and total phosphorus--in lakes and reser- voirs, and a total of five items--COD, pH, DO, number of colitis legions and n-hexan extracts (oil, etc.). For those items of the living environ- ment, types are specified for each water on the basis of the use of water, such as tap water intakes, The system is such that environmental quality standards are formulated for each water with its features taken into account by designating an appropriate type for it.
As regards the attainment of environmental quality standards for conservation of the living environment, pollution by organic matter produces the greatest impact on the living environment around waters. With this in mind, BOD (rivers) or COD (lakes, reservoirs and sea regions) which are closely tied in with organic pollution are assessed as representative items throughout the year, with the following findings. The projection made on the water quality of waters for public use in fiscal 1991 suggests that the attainment of environmental quality stan- dards (the rate of waters satisfying environmental quality standards to the total number of surveyed waters) stood at 75.4% (73.1% in fiscal 1990) for rivers, 42.3% (44.2%) for lakes and reservoirs, 80.2% (77.6%) for sea regions and 75.0% (73.1%) for all (Fig. 1-1-21). The rate for total nitrogen and total phosphorus was 31.3% (42.6% in fiscal 1990). A check of long-term trends indicates that the controls specified in the Water Pollution Prevention Law, and those added to them by prefectures, have made it possible to gradually improve the attainment rate for rivers though it stood at about 50% in or around 1975. The attainment rate for sea regions has stayed in the neighborhood of 80% in years other than fiscal 1983 and 1990, whereas the attainment rate for lakes and reser- voirs remains low as in the past.
Fig. 1-1-21 Trends in Achievement Rate of Envi- ronmental Quality Standards (BOD or COD)
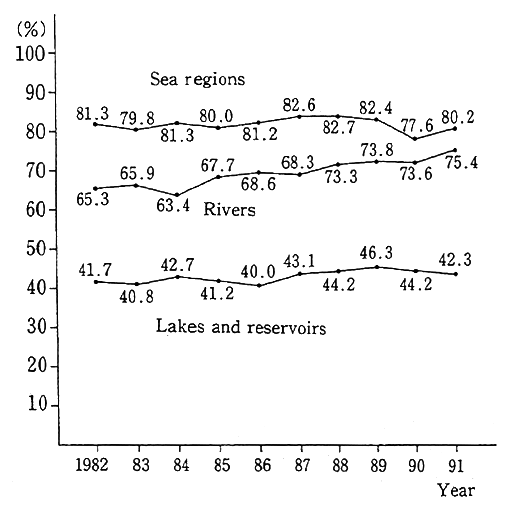
Source: Environment Agency
In lakes and reservoirs, inland seas, bays and other closed waters, the exchange with outside water is so poor that pollutants tend to accumulate, making it difficult to improve or maintain the water quality. The ongoing eutrofication of lakes and reservoirs gives rise to such issues as tap water with offensive odor, impacts on fishery and a drop in transparency, making improvements in the water quality an urgent task. For Lake Biwa, Lake Suwa, Kasumigaura and six other lakes for which a lake water quality conservation program is formulat- ed under the Special Measures Law for Conservation of the Lake and Reservoir Water Quality, special measures are in force according to the program, in addition to the controls specified in the Water Pollution Prevention Law. However, environmental quality standards have yet to be achieved.
Fig. 1-1-22 Trends in Achievement Rates of Envi- ronmental Quality Standards (COD) in 3 Sea Regions
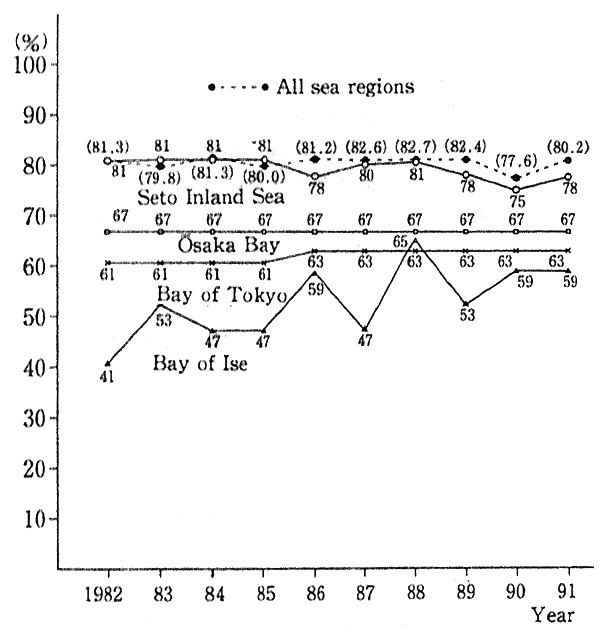
Source:Environment Agency
As regards closed sea regions, COD-associated areawide total pollutant load controls are exercised for the Bay of Tokyo, the Bay of Ise and the Seto Inland Sea under the Water Pollution Prevention Law and the Special Measures Law for the Environmental Conservation of the Seto Inland Sea. A check of the attainment rate of environmental quality standards (COD) for the three sea regions shows that the ratio is moving at lower rates in the Bay of Tokyo than in all sea regions and that it remains at a low rate for the Bay of Ise, though there has been some improvement (Fig. 1-1-22). For the Seto Inland Sea, the rate remains virtually at the same level but when it comes to the Bay of Osaka and other sea regions, it is changing slowry. Into those closed waters, nitrogen, phosphorus and other eutrophic salts, mingled with residential and industrial wastewater, flowing from major cities which form the hinterland creating eutrofication. For this reason, red and blue tides are generated, posing such threats as damage to fisheries, offen- sive odors, hazards to the use of sea-bathing resorts and beach pollution. Incidentally, the descriptions in 3, Section 1, Chapter 4, provide details on the direction of measures for lakes and reservoirs, bays and other closed waters.
The conditions of heavily polluted urban rivers have not been improved in recent years as in the past (Fig. 1-1-23). This is because the loads on rivers have soared due to urban sprawls and other factors. Depending on local conditions, measures to cope with residential waste, including the development of additional combined treatment-purifica- tion tanks and other residential wastewater treatment facilities, are in force in addition to the development of sewage systems.
Fig. 1-1-23 Conditions of Riparian Water Quality
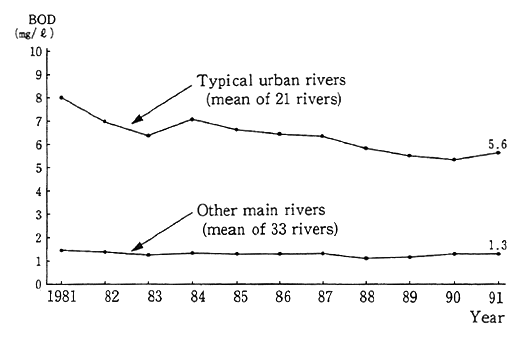
Source: Environment Agency
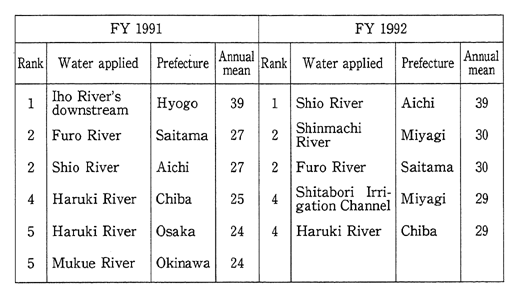
The fiscal 1991 survey reveals Japan's top-ranking rivers in terms of BOD concentrations as indicated in Table 1-1-4. The principal reasons for the pollution are industrial wastewater for the Iho River which ranks first, livelihood wastewater for the Furo River which ranks second, and the livestock industry's wastewater for the Shio River which ranks third.
Table 1-1-4 Rivers at Highest BOD Concentration Level
Source:Environment Agency
While the people's calls for better-quality drinking water are mounting, problems are pointed to, such as offensive tap water in urban areas due to the pollution of lakes and reservoirs and the generation of trihalomethane from a reaction of organic matter, contained in the tap water, with chlorine for sterilization, so that there are calls for more powerful measures.
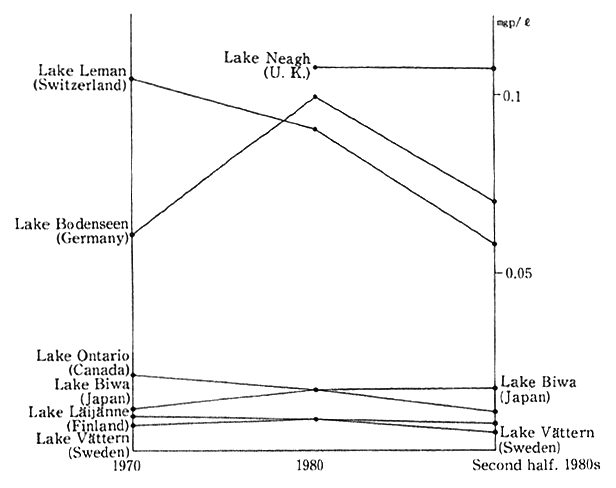
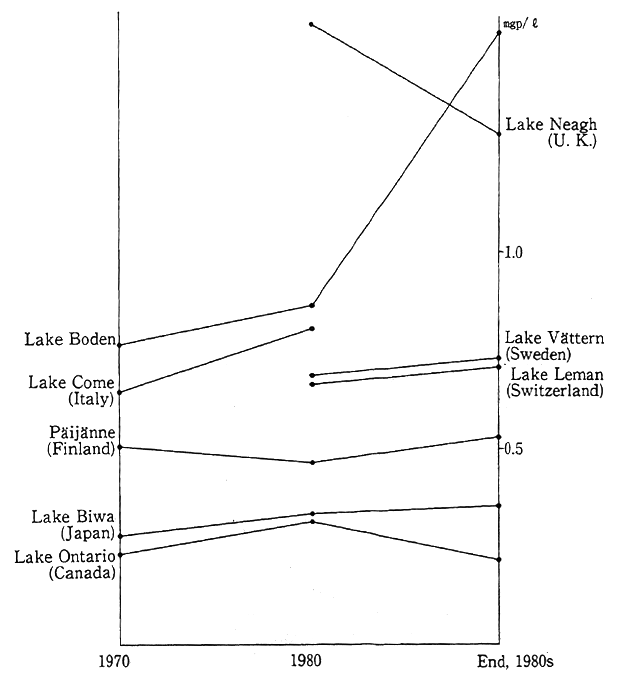
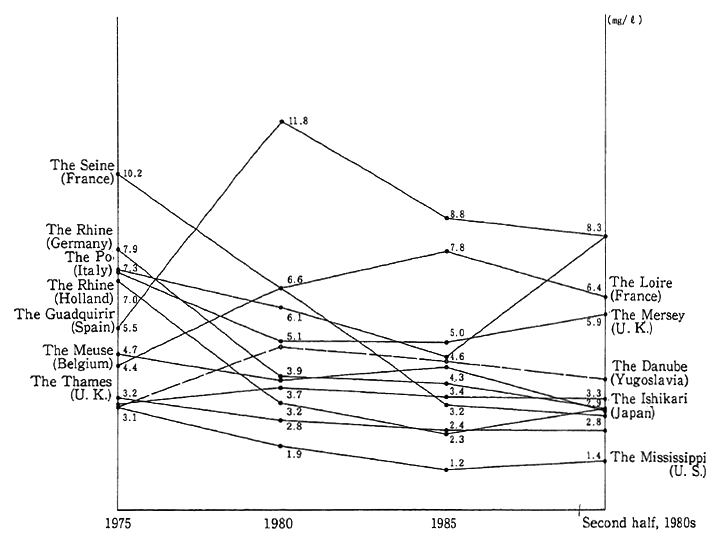
The water conditions of major rivers, lakes and reservoirs in developed countries are illustrated in Fig. 1-1-24. In broad terms, there are signs of an improvement but in some rivers, lakes and reservoirs, the conditions are leveling off or worsening.
Fig. 1-1-24 Water Quality of Main Rivers, Lakes and Reservoirs in Developed Countries (Total Phosphorus)
Source:OECD Environmental Data 1991
Notes:*The values for rivers are those at their estuaries or lowest stream.
*As each country has its own sampling method, it is necessary to exercise care in interpreting the values. It i advisable to compare secular changes in the water quality, rather than the absolute values of pollution for each river, lake and reservoir.
Fig. 1-1-24 Water Quality of Main Rivers, Lakes and Reservoirs in Developed Countries (Total Nitrogen)
Source:OECD Environmental Data 1991
Notes:*The values for rivers are those at their estuaries or lowest stream.
*As each country has its own sampling method, it is necessary to exercise care in interpreting the values. It is advisable to compare secular changes in the water quality, rather than the absolute values of pollution for each river, lake and reservoir.
Fig. 1-1-24 Water Quality of Main Rivers, Lakes and Reservoirs in Devel- oped Countries (BOD)
Source:OECD Environmental Data 1991
Notes:*The values for rivers are those at their estuaries or lowest stream.
*As each country has its own sampling method, it is necessary to exercise care in interpreting the values. It is advisable to compare secular changes in the water quality, rather than the absolute values of pollution for each river, lake and reservoir.
(3) Seas
The sea often turns into the final destination for pollutants, as pollution on the land is moved by water and accumulated. There is concern about the pollution of seas, vast though they are.
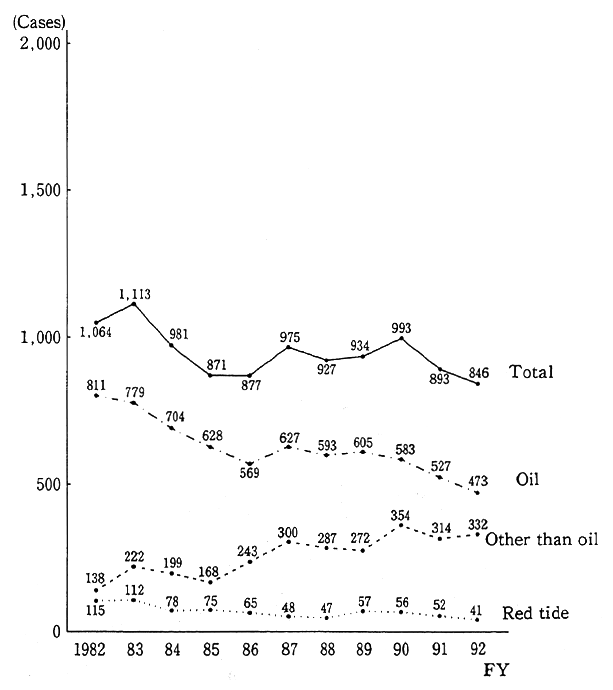
The number of cases in which sea pollution was confirmed in sea regions around Japan in fiscal 1992 was 846, down 47 from 893 in fiscal 1991, and marked an all-time low since the taking of statistics began in 1971 (Fig. 1-1-25). This is because the number of cases of pollution by oil, which accounted for about 60% of the total number, dropped from 527 to 473. On the other hand, the number of cases in which pollution was caused by wastes rose from 267 in fiscal 1991 to 287 in fiscal 1992.
Fig. 1-1-25 Trends in Number of Cases with Genera- tion of Sea Pollution Confirmed
Source:Environment Agency
Under the Law for the Prevention of Sea Pollution and Maritime Disasters, a ban is put on the dumping of wastes in the seas, in principle, and when it comes to specified wastes, their dumping is authorized in the seas (for example, the seas off Boso, Shikoku and Sanriku and the Sea of Japan), depending on their properties, in accordance with the standards set on dumping methods. According to the survey performed by the Maritime Safety Agency in fiscal 1991 on the pollution of waste-dumped sea regions and their peripheries indicate that the levels of pollution remained virtually the same for oil and there were signs of a drop for PCB and heavy metals.
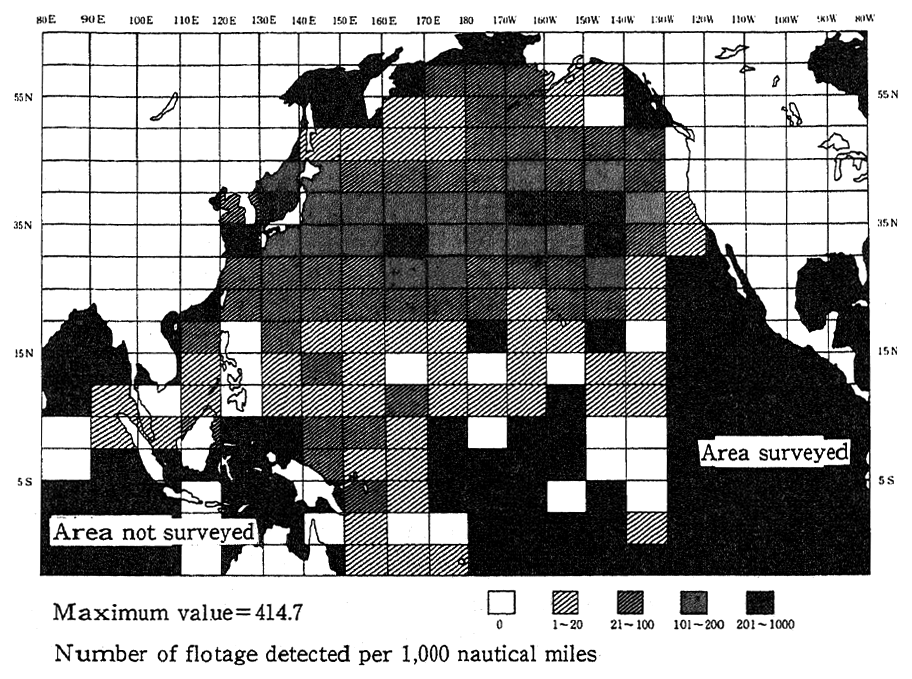
In the fiscal 1991 survey on suspended wastes, relatively large amounts of suspended wastes were detected in seas close to Japan in the southwestern part of the Sea of Japan, many of them consisting of foaming polystyrol and other oil products and almost all of them being less than 50 cm in size. As for wastes drifting on the sea surface, there is concern that marine organisms, such as sea birds and animals might mistake resin pellets (tiny grains for plastics production) and other plastics for feed and suffer from disorders, and that they might die as they are caught by discarded fish nets and ropes. The Fishery Agency performs a fact-finding survey on the distribution of discarded and floating nets, in which the distribution of wastes on the sea surface is surveyed by the eye. In the fiscal 1991 survey, it was found that plastics were extensively distributed east to west between 30 and 40 degrees, N. (Fig. 1-1-26)
Fig. 1-1-26 Findings of Surveys on Floatage in the Entire Pacific
Source: Fishery Agency
The survey conducted by the Maritime Safety Agency reveals that the distribution of waste oil balls has sharply dropped since the middle of the 1975-84 period. Many waste oil balls were found afloat along the main routes for tankers near the Nansei Islands and along the southern coast of the Honshu Island. Many of them were also found coming ashore on the Nansei Islands, the southern cost of the Honshu Island and the western coast of Kyushu.
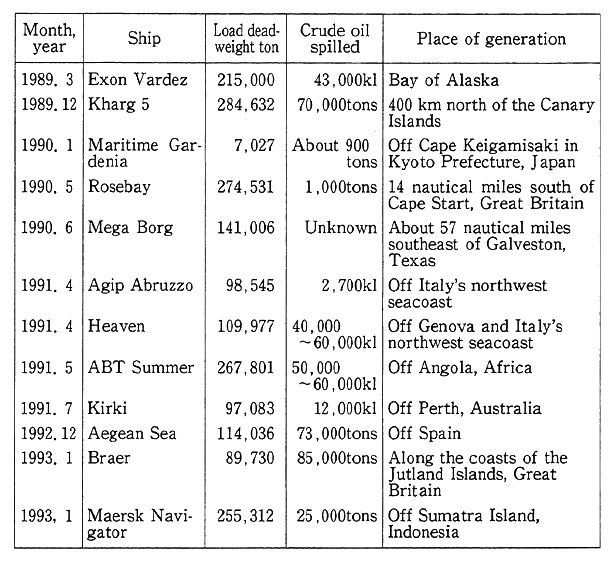
Table 1-1-5 Major Tanker and Other Accidents in Recent Time
Source:Environment Agency
Most of the causes to sea pollution. by oil are deliberate and careless spills from ships, as well as maritime accidents. Pollution in maritime accidents will sometimes produce large-scale damage. Acci- dents were caused by the Aegean Sea, a tanker of Greek registry, off Spain in. December 1992, the BLAIR, a tanker of Liberian registry, near Britain in January 1993 and the MERK Navigator, a tanker of Singapor- ean registry, off the Indonesian island of Sumatra also in January 1993, spilling huge amounts of loaded crude oil (Table 1-1-5). It takes many years for such spilled crude oil to be dissolved in the natural environ- ment, and the possibility is high that they would produce significant impacts on marine fauna and flora and other ecosystems of nature. In that series of maritime accidents, significant damage to nature's eco- systems was not reported, but in the grounding of the Exon Valdez off Alaska in March 1989, about 40,000 kiloliters of crude oil was spilled, causing huge damage with about 30,000 sea birds killed and the fishing of herrings abandoned. With this calamity as a turning point, agreement was reached on double hulls for tankers in the International Maritime Organization (IMO), and this accord is to be put into force in July 1993. As is discernible from this pact, international efforts are being made for the prevention of oil pollution, centering on measures for the prevention of pollution by ships.
(4) Bottoms
It is conceivable that many kinds of pollutants, brought in through a wide variety of channels, are accumulated on the bottoms of rivers, lakes and reservoirs and the seabeds. In Japan, pollution by mercury-containing sludge came to light in the past cases of severe industrial pollution, and bottoms have been dredged across the nation at amounts of about 28,130,000m3.
In the across-the-board survey of environmental safety from chemicals, different chemicals are surveyed annually to come to grips with their residue on the bottom. In fiscal 1991, acrylamide, used for soil improvement and other purposes, and six other chemicals of 24 survey subjects were detected. But when the detected concentrations were taken into account, there were no chemicals which had to be called to special account. Of the chemicals detected in the environment, when across-the-board and other surveys on environmental safety from chemi- cals were performed, those whose trends required special surveillance are taken up in a bottom monitoring survey which is designed to do secular surveillance on environmental pollution. In the fiscal 1991 monitoring of 20 chemicals in the estuary of the Sumida River, the Bay of Osaka and 16 other places, dichlorobenzene and 19 other chemicals were detected. A check of the areas where a high level was detected for each survey subject indicates that the high levels are registered for seven chemicals in. the Bay of Dokai, six in the estuary of the Yamato River, five in the estuary of the Sumida River and one each in the Bay of Sendai and the estuary of the Shinano River, suggesting that the degrees of pollution in closed bays were high.
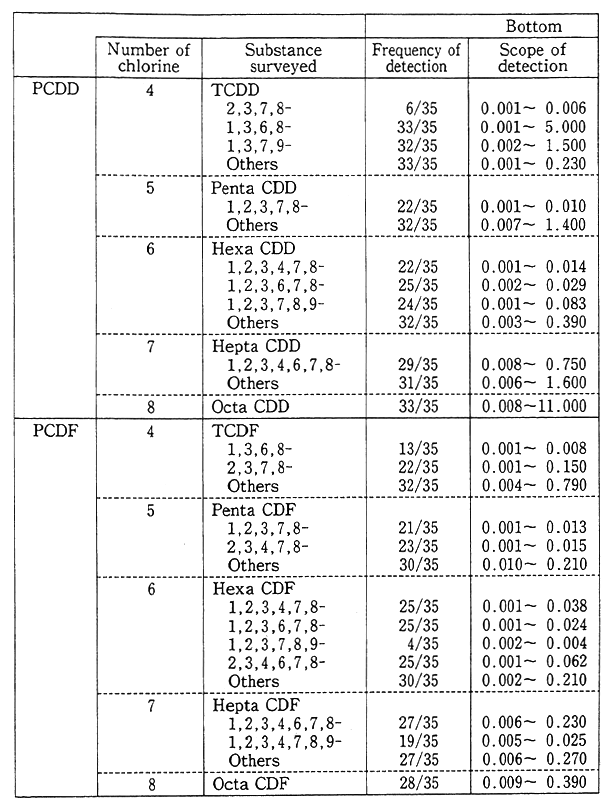
Besides, in order to come to grips with the environmental residue of chemicals (inadvertently generated chemicals) in the processes in which they are synthesized and burned, such as dioxins, a fact-finding and follow-up survey is conducted on pollution by hazardous chemicals. In the findings of the fiscal 1991 survey, the pollution of the general environment by dioxins could not be considered at this juncture to affect man's health, but it was detected, albeit low in concentration, and it is necessary to carry on surveillance (Table 1-1-6).
Table 1-1-6 Bottom Survey on Dioxins
Source Environment Agency
(5) Groundwater
Groundwater has long been highly rated as a source of good quality water and constant in temperature. At present, it accounts for about 30% of water for use in urban areas. In the latter half of the 1975-84 period, groundwater pollution, such as by trichloroethylene, came to the fore and widespread groundwater pollution was confirmed in fact-finding and other surveys. Given this situation, the Water Pollu- tion Prevention Law was amended in June 1989 to control the under- ground penetration of water containing hazardous matter and f r the central and local governments to carry out surveillance continuously.
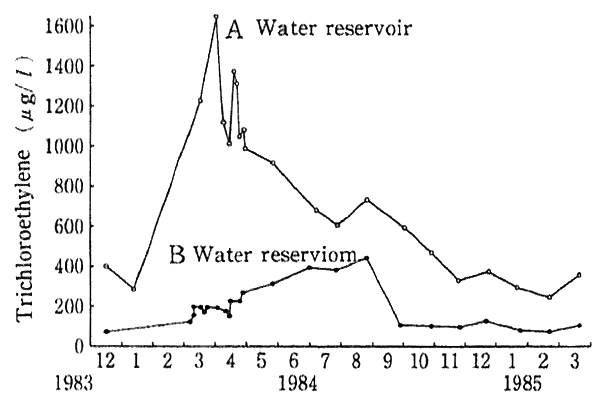
In the fiscal 1991 general survey (a groundwater survey designed to come to grips with the general conditions of local groundwater), the rate of wells in excess of assessment standards and other criteria stood at 0.03% for sexivalent chrome, 0.1% for arsenic, 0.1% for total mercury, 0.4% for trichloroethylene and 0.7% for tetrachlorothylene, but no wells in excess of those standards were observed or other cyanic compounds and POB. In surveys on. the peripheries of polluted well for confirmation of the ranges of pollution and in regular monitoring surveys for a continued surveillance over pollution detected earlier, higher levels of pollution were detected. As the wells which were found to exceed assessment and other standards include those for drinking purposes, measures against pollution are in effect. Nonetheless, it is difficult to recover groundwater, once it is polluted. For example, trichloroethylene was detected in some reservoirs in Taishi Town, Hyogo Prefecture, in December 1983. Follow-up surveys revealed that groundwater and wells for use by general households in the town were polluted. As the pollution source turned out to be an IC plant in the town, measures, such as the shift to different solvents and the replace- ment of polluted soil, were taken with the consequence that the concen- tration of trichloroethylene in the reservoirs rapidly dropped and the concentration subsequently went down with time. Nonetheless, when the concentration of trichloroethylene stopped declining, after coming down to several hundred,u g/l, and two years later, it was found virtually leveling off. In the wells located in the compound of the polluted reservoir, the concentration of trichloroethylene stood at about 5,000オ g/l even five years later, or in 1988, suggesting that the conditions remained the same as in the year when the pollution had been detected (Fig. 1-1-27). Given this example, it is necessary to make preventive measures thoroughgoing so that yet another episode of pollution may not take place.
Fig. 1-1-27 Secular Trends in Teichloroethylene in Ooshi Town's Water Reservior
Source:Quoted from Groundwater Problem Research Group, ed., Theory of Groundwater Pollution
(6) Acid Rain
Acid rain is rain of under of pH 5.6 as sulfur and nitrogen oxides emitted from factories and autos turn in complicated chemical reactions into sulfur ion and ion nitrate and are dissolved into it, In some cases, the acidity of acid rain is high. The impacts brought about by acid rain include the atrophy of trees directly exposed to acid rain, impacts by soil acidification on ecosystems and forests, acidification of lakes, reservoirs and rivers by the inflow of acid rain, and impacts on the ecosystems of organisms in those waters. In particular, there also are impacts on urban structures and cultural assets made of marble and metal. Thus acid rain has become a complicated issue tied in with a wide variety of environmental components.
Fig. 1-1-28 Status of Acid Rain (2nd Survey on Acid Rain Measures)
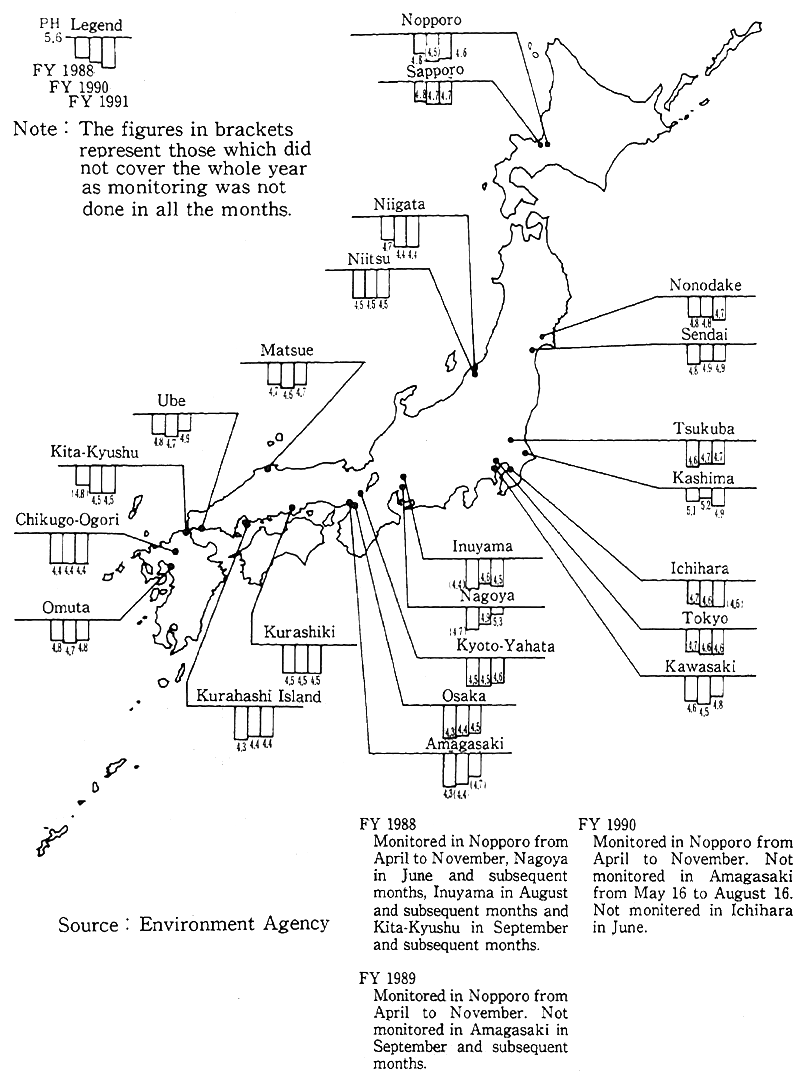
In Japan, the first series of surveys for the formulation of measures to cope with acid rain was performed from 1983 to 1.987 to check the prevailing conditions and impacts of acid rain. The findings show that the annual mean. of acid rain stood at pH 4.4-5.5 the same as in Western countries. The water of lakes and reservoirs in almost all cases was distributed around the neutrality of pH 7, and when it came to soil, no signs of acidification were observed. Nonetheless, there are many points that have yet to be made clear about the impacts of acid ain on ecosystems, and the second series of surveys for the formulation of measures to cope with acid rain was carried out from 1988 to 1992 with a view to preventing damage. According to an interim report compiled by March 1992, the acidity of rainfall stayed almost at the same levels as in Western countries, and no significant differences from the first series were observed (Fig. 1-1-28). In regard to the impacts of acid rain on vegetation, the atrophy of trees in some survey areas was observed, but whether it was caused by acid rain had yet to be made clear. As things now stand, the impacts by acid rain on ecosystems may not have fully come to the fore, and its impact on land water, soil and vegetation have yet to be made clear, so that there is the need to continue surveys, researches and environmental surveillance and, if necessary, make preparations for the implementation of measures.
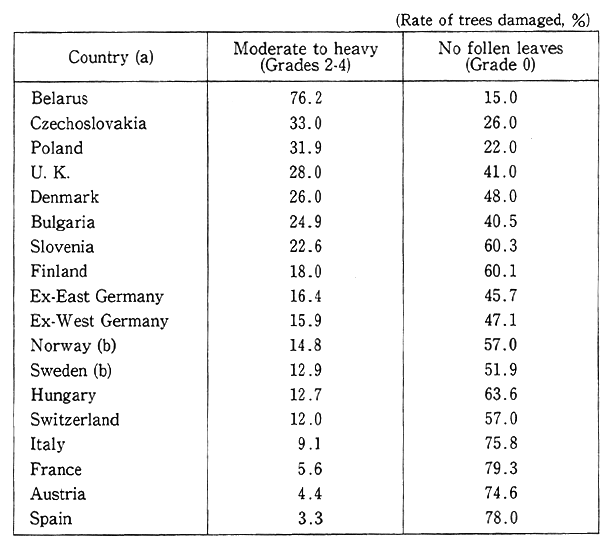
Table 1-1-7 Damage to Forests to Europe
Source:Christer Agren, "Forest Decline Continues," Acid Neies, Dec. 1990, p.5
Note:(a) The values are for all tree species unless otherwise specfied.
(b) Need-leaved trees only
In foreign countries--Europe, North America and the Chinese continent, in particular--serious damage is brought about by acid rain. About 15,000 of some 85,000 lakes and reservoirs in Sweden are already acidified, and in about 4,500 of them, fish died out. In Canada, too, about 4,000 lakes and reservoirs have become uninhabitable for organisms. Presumably as a result of the complicated interaction of sulfur oxides, nitrogen oxides, ozone and other air pollutants, serious damage is produced to nationally representative forests, such as "schwarzer Walden" (black woods) in Germany and maple trees in the Canadian state of Ontario. In China, too, cedar trees in Womeishan, Szechwan Province, were atrophied, and 87% of them reportedly sustained dam- age. Given those instances, it is apparent that the impacts of acid rain have come to the fore (Table 1-1-7). In addition to ecosystems, other invaluable cultural assets are reportedly affected by acid rain, such as Parthenon in Greece and Rome's ruins.
Acid rain, for which the causative substances are nitrogen oxides and sulfur oxides which widely proliferate in the atmosphere, is no longer a localized problem but is now a transboundary international issue. International approaches to acid rain are being developed in seriously affected Western countries. The strengthening of measures has been stepped up in Europe since the Helsinki Protocol was conclud- ed in 1985 and in the United States, which began to reduce sulfur oxide emissions as a measure to drastically cope with acid rain with a revision of the Clean Air Act in 1991. On the other hand, acid rain in Japan is presumably associated with sulfur oxides and nitrogen oxides emitted in China and northeastern Asian countries. With this point in mind, there is the need to continuously survey the distribution of those causative substances in the rim of the Sea of Japan and to work for cooperation in enabling those countries to carry out pollution prevention through improvements in fuels and in the combustion efficiency and for regional cooperation in preventing the generation of damage by acid rain. It is also necessary to promote international cooperation in the establish- ment of a monitoring network over areas which center on eastern Asia.
1-1-3 Soil
Generated with the significant involvement of organisms' activ- ities, soil constitutes an important component of the environment, playing an important role in the maintenance of ecosystems. If soils are degenerated and the functions of soils are impaired, the existence of man and other organisms will be threatened and nature's ecosystems will be aggravated.
Of all types of soil degeneration, soil pollution is of a cumulative type in which heavy metals and other hazardous matter contained in exhaust smoke and wastewater are accumulated to produce adverse impacts on farm produce and groundwater for long periods with air, water and so forth as media. With farmland soils polluted, the growth of produce is hampered and polluted produce impairs man's health in some cases. Soil pollution is one of the longest in history. With farmland pollution along the Watarase River in the Meiji Era and also farmland pollution by cadmium and other chemicals in the basin of the Jintsu River in the postwar years, significant problems have been posed. Given those developments, measures have been taken to do something about the sources of pollution under the Water Pollution Prevention Law and other legislation. As for farmland, standards were set for cadmium, copper and arsenic under the Law for the Prevention of Farmland Soil Pollution, and for farmland the pollution which exceeded those values, it was decided to implement soil replacement and other projects. In recent years, there have been fewer districts where pollution in excess of the standard values have been detected. The total area of places where topsoil replacement and other projects were to be completed by the end of fiscal 1992 was 4,600 hectares, and the progress rate for places where pollution was in excess of the standard values (7,050 hectares) was 65.2% (63.5% in fiscal 1991).
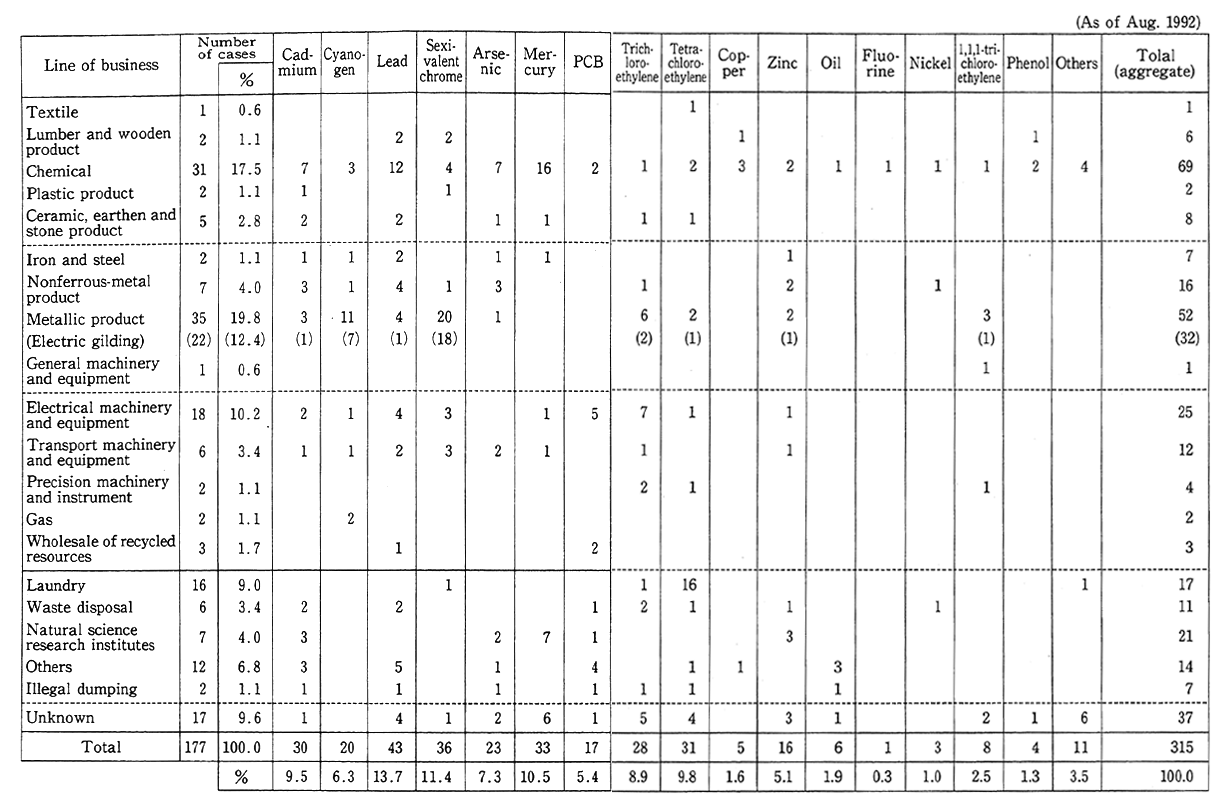
As for urban soil other than farmland soil, there frequently appear cases in which pollution by hazardous matter at sites from which factories and research institutes have been moved out, often coming to light in urban renewals and other projects. Given this situation, environ- mental quality standards on the soil pollution of plots both for agricul- tural and nonagricultural uses were formulated for cadmium and nine other chemicals in August 1991. The Environment Agency has thus far come to grips through local government and other institutions with 177 cases of urban soil pollution (Table 1-1-8). The causes to soil pollution consist mostly of leaks due to the damage of production and other facilities, the inappropriate burying of wastes in the compounds of factories before the enactment of the Waste Disposal Law and the improper handling of pollution-causing substances, among others. The types of business responsible for pollution are diverse, such as chemicals production (31 cases), electroplating (22), electric machinery and appli- ance production (18), scientific research institutions (7) and cleaning (16). The pollutants in many cases are sexivalent chrome, mercury, lead, cadmium, trichloroethylene and tetrachloroethylene, among others.
Table 1-1-8 Number of Cases of Soil Pollution in Built-up Urban Areas by Line of Business and by Pollutant
Source:Environment Agency
When it comes to the conditions of foreign. countries, problems are posed in the United States about pollution at the sites from which the final waste disposal plants in the years when lax controls were in force have been moved out, and soil pollution by organic solvents and other agents leaked from factories. The broad segment of responsible persons has been ordered to take measures. Under the Super Fund Act, designed to enforce measures with a fund contributed from taxation on oil and chemical products, and other legislation, measures are taken for purification. In Germany, the Netherlands and other European coun- tries, positive soil pollution prevention measures are in force. As Eastern Europe, it was detected in Bulgaria that plots with an area 300 in to a metal plant are polluted by heavy metals. In Olkusz and Slavkov, Poland, the world's highest values of lead and cadmium Were detected from the soil, and pollution by the inappropriate treat- ment of wastes from industrial belts is at issue.
In developing countries, soil atrophy is posed as a significant issue, as it is caused by excessive pasturage, forest depletion and im- Proper agricultural practices. In a global perspective, problems are Posed by soils, such as its washout and chlorination by the upstream movement of brine, generating are calls for international cooperation.
1-1-4 Land Subsidence
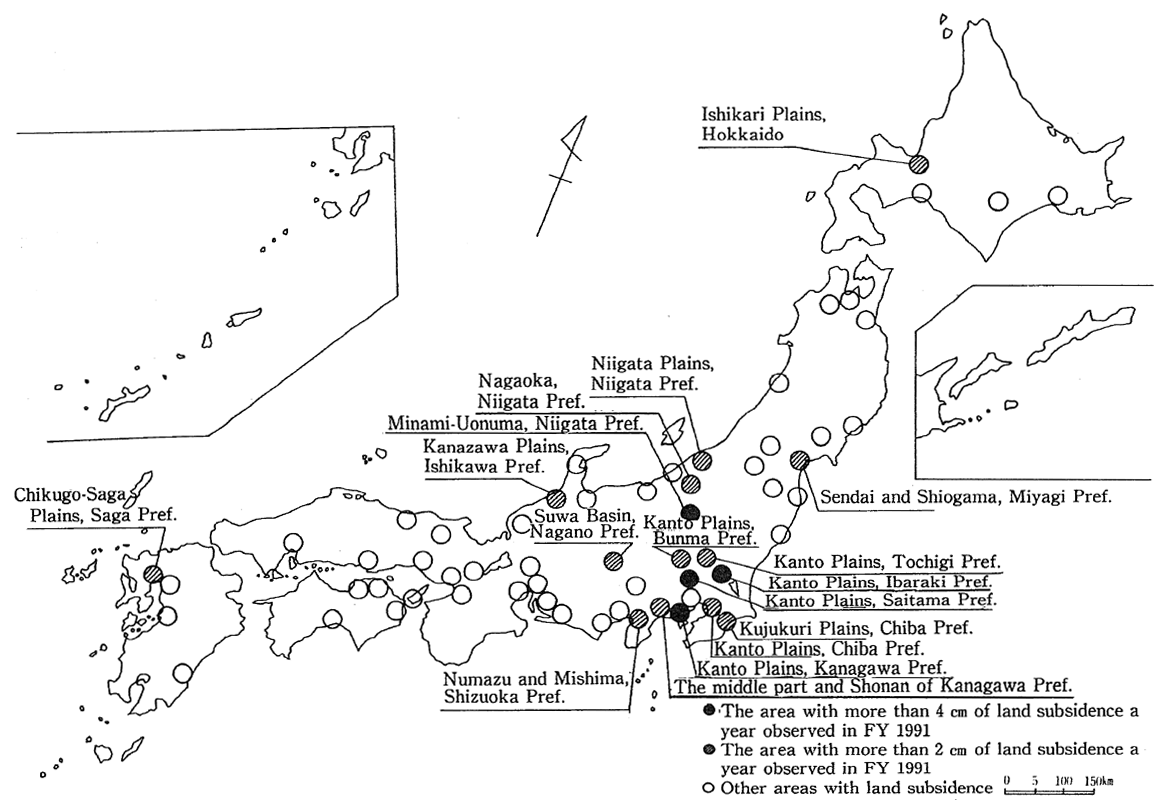
Land subsidence is caused primarily by the excessive extraction of groundwater. Once subsidence takes place, the land will not revert to itshe original state, causing damage to structures and so forth. In the prewar years, land subsidence took place in Koto Ward, Tokyo, and in the western part of Osaka City. For some time after the war with the economy coming to a standstill, land subsidence subsided but occurred across the nation in the 1965-74 period, exceeding 20 centimeters a year in some extreme cases. Later, it became a practice to control ground- water extraction, and there were signs that it would decrease. In some areas, nonetheless, it still occurs to a significant extent. In fiscal 1991, upwards of 2 cm a year were recorded in 17 districts with an aggregate area of 467 km2 (18 districts with 360 km2 in fiscal 1990), and the area of subsidence was greater than in the preceding fiscal year (Fig. 1-1-30). Then there were four districts with an aggregate area of 6 km2 (five districts with 14 km2 in fiscal 1990) where more than 4 cm of subsidence was recorded. By district, the land subsidence in the northern part of the Kanto Plains, the Kujukuri Plains in Chiba Prefecture, Nagaoka in Niigata Prefecture, the Chikugo and Saga plains in Saga Prefecture and the Saga Plains, among others, was observed. The greatest degree of land subsidence in the nation was recorded in the Minamiuonuma district in Niigata Prefecture with 5.2 cm.
Fig. 1-1-30 Status of Land Subsidence Across the Nation in FY 1991
Source:Environment Agency
1-1-5 Noise and Vibration
Noise is an issue which is closely tied in with everyday life. There is a wide variety of sources, including factories, construction work, midnight business operations, family life and transportation every year- Noise constitutes the greatest number of total grievances filed about pollution with local governments. (Fig. 1-1-31) The number of com- plaints about noise in fiscal 1991 came to 16,800 (19,018 in fiscal 1990), down about 70% from a peak in fiscal 1973. This is because complaints about noise from factories and construction work, which account for about 60% of all grievances, have decreased. When it comes to griev- ances associated with family life, there have been signs of a drop in the number of cases but the share in the total number of complaints about noise has been on the upturn in recent years.
Fig. 1-1-31 Trends in Number of Grievances in 7 Typical Cases of Pollution by Type
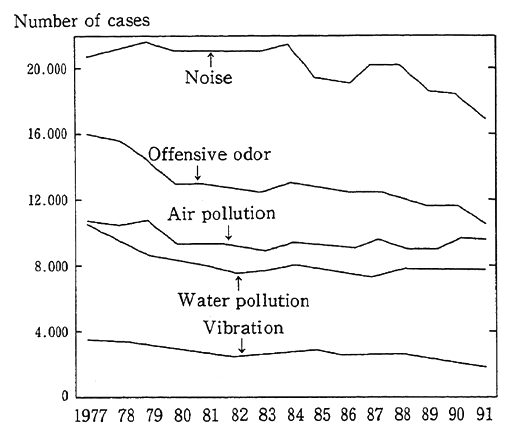
Source: Environment Pollution Reconciliation Committee
As regards noise, environmental quality standards have been formulated--while they are classified according to the local conditions of land use and the zones of time--for the general living environment, automotive noise, aircraft noise and noise from Shinkansen bullet trains. When it comes to noise from factories and business establish- ments, noise from construction work and automotive noise (single autos), control and other standards have been formulated, and a wide variety of measures is in force.
Regarding automobile noise, there are signs of a drop in the success rate of environmental quality standards in a long-term perspec- tive. The findings of the 1991 survey indicate that the rate was achieved at 13.6% (13.3% in 1990) of 4,621 points across the nation in the time zones of morning, noon, evening and night (four-hour zones). Conversely, the points which surpassed environmental quality standards in all the four-hour zones accounted for 54..6% (54.2% in 1990). The findings of monitoring at 1,077 continuous monitoring points from 1987 to 1991 suggest that the three-year achievement rate of environmental quality standards came to 10.2% (9.0% in 1990), signaling some improvement, but the levels generally remained low (Fig. 1-1-32). In a comparison with the demand limit (5-15 dB(A) higher than the environmental quality standard), or the yardstick used in warranting a required action under the Noise Control Law, the points where the values were less than the demand limit in all four-hour zones stood at 68.1% (69.0% in 1990). A check of secular trends in a comparison with the demand limits confined to the points where monitoring had been continuously done in the preceding five years (1,077 points) indicates that the rate of monitoring points where the value had been lower than the demand limit in all four-hour zones had decreased year by year as a whole, coming to 65.7% in 1991, slightly better than in 1990 (65.2%).
Fig. 1-1-32 Secular Trends in Achievement of Environ- mental Quality Standards at Same Points
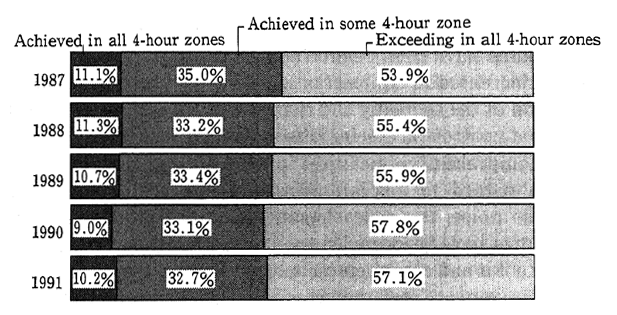
(Findings of surveys continuously made at 1,077 points since 1987)
Source: Environment Agency
The region-specific achievement rates of environmental quality standards are given in Fig. 1-1-33. The conditions of noise in major urban areas (Tokyo's 23 wards and 11 administrative ordinance- designated major cities) were worse than in other urban areas. Particu- larly, the achievement rate of environmental quality standards in major urban areas were extremely low, standing at 7.3%. In. a noise survey along motorways in Tokyo, roadside areas were observed where envi- ronmental quality standards were not achieved even at night, centering on those along major trunk roads. There were also roadside areas where the noise was in excess of the demand limit.
Fig. 1-1-33 Achievement of Environmental Quality Standards by Area
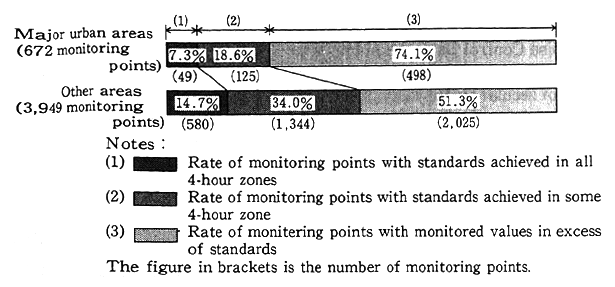
Source: Environment Agency
Given such automotive traffic noise, automotive noise controls were exercised as measures to cope with the generation sources, and those measures have been reinforced step by step. But as automotive traffic has increased in conjunction with the evolution of urbanization, an expansion of the economy and changes in its composition, the effects of reinforced controls are being offset, thereby making it necessary to carry out comprehensive measures in the future as well.
With regard to aircraft noise, the introduction of equipment assuring less noise, the redevelopment of areas around airports and other measures have been implemented. In the neighborhoods of Tokyo, Osaka, Fukuoka and other representative airports, there are signs of an overall improvement from the years when environmental quality stan- dards were formulated, but there are few airports where environmental quality standards have been achieved at all monitoring points. There- fore, there is the need to make further efforts for achievement of the environmental quality standards
When it comes to the noise of Shinkansen bullet trains, greater improvements have been observed than by conventional measures, but there remain many places where environmental quality standards have yet to be satisfied. In areas along the Tokaido and Sanyo Shinkansen lines where dwellings are densely concentrated and in areas along the Tohoku and Joetsu Shinkansen lines with a congestion of houses, measures are being taken so that the noise may come down to less than 75 phons by the end of fiscal 1993 for places where the noise is now in excess of this level.
Grievances are also filed about the noise and vibration of some conventional railway lines other than the Shinkansen lines. Particularly with the opening of the Tsugaru undersea railway line and the Seto Ohashi railway line bridge suspended over the Seto Inland Sea, prob- lems are posed about their noise and vibration, leading to the implemen- tation of various measures.
As regards vibration, there have been signs of a drop in the number of grievances in recent years. In fiscal 1991, it came to 2,207, an all-time low since fiscal 1976. By source the number of complaints associated with construction work was greatest.
1-1-6 Offensive Odor
Offensive odor is perceived even when an extremely small amount of offensive matter is mingled in the air. It is a form of sensory pollution like noise and vibration, closely tied in with our everyday life. In fiscal 1991, there were 10,616 complaints about offensive odors, showing signs of a decline from a peak of 21,576 in fiscal 1982. Inciden- tally, offensive odor ranks second after noise in terms of the number of grievances about seven typical seven forms of pollution, staying at a level of a little more than 20% since 1977. In a source-specific break- down, the rate is 27.8% by production plants, 22.5% by the livestock industry and 120% by the residential type in which individuals' dwell- ings and so forth constitute sources.
To cope with offensive odor, the Offensive Odor Control Law was enacted in 1971 to control the emission of ammonia, methylmercaptan and other offensive odor substance generated in busines practices.
1-1-7 Pollution of Organisms
Table 1-1-9 Outline of Findings of Biological Monitoring Survey and Comparison with FY 1990
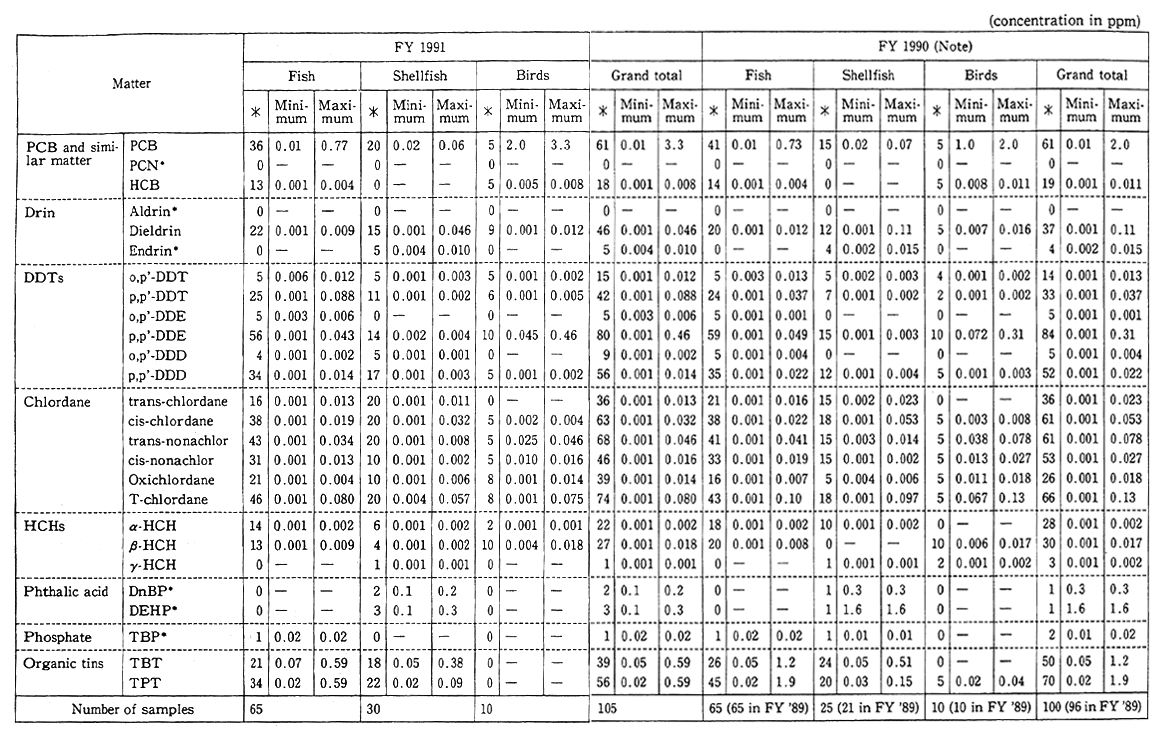
Note:The asterisked values are for FY 1989.
Source:Environment Agency
*:Frequency
Of pollutants, there are some the existence of which are present among natural components in the environment, such as air, water, bottom and soil, and organisms which depend on those environmental factors for there survival. It is known, furthermore, that organisms concentrate and accumulate in specific heavy metals and chemicals, thereby higher levels of pollution than water and air. The values measured of organisms are the indices of accumulated pollution for certain periods of time, so when the levels at which organisms are polluted by chemicals are measured, it is possible to come to grips with the behavior and pollution level of matter which affect man's health and ecosystems, generating significant data on many points.
In the across-the-board survey of chemicals and environmental safety designed to detect different chemicals in the fishes, 24 substances remaining in the environment were surveyed in fiscal 1991, and four chemicals--nitrobenzene, pyridine, o-nitroanisole used as a dyestuff and other agents, and e-caprolactam for nylon production--were detected. With the detected frequency and concentrations taken into account, the latest findings suggest that there were no chemicals which had to be taken in to special account.
When it comes to those chemicals which were detected in the environment in the across-the-board survey on environmental safety and chemicals whose trends were found to call for surveillance, biological monitoring is conducted with fish, shellfish and birds. In the fiscal 1991 survey, PCB, DDT and tributyl tin compounds, a kind of organic tin compound, were detected in fish, shellfish and birds (Table 1-1-9, Fig. 1-1-35). A survey is also being conducted on the residue in organisms of dioxins and other hazardous matter which is unintentionally generated, and have been detected in fish and shellfish (Table 1-1-10). Pollution by those substances is not considered to have reached a point where many s health will be immediately affected, but it is necessary to continue surveillance.
Fig. 1-1-35 Findings of Biological Monitoring of Tributyl Tin Compounds
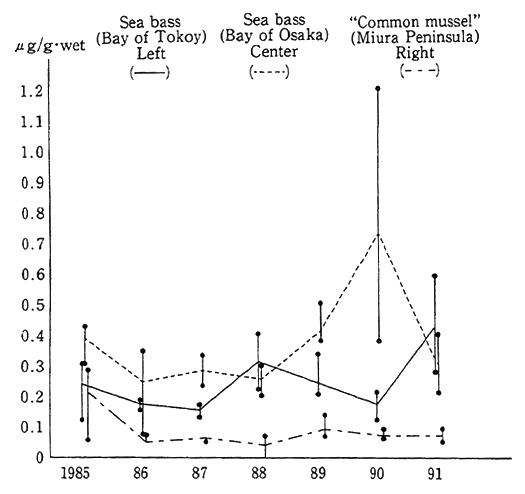
Notes:1. In terms of TBTO
2. The limit to detection in 0.05 オ g/g wet(ppm).
Source:Environment Agency
Table 1-1-10 Findings of Environmental Survey on Dioxins (Organisms)
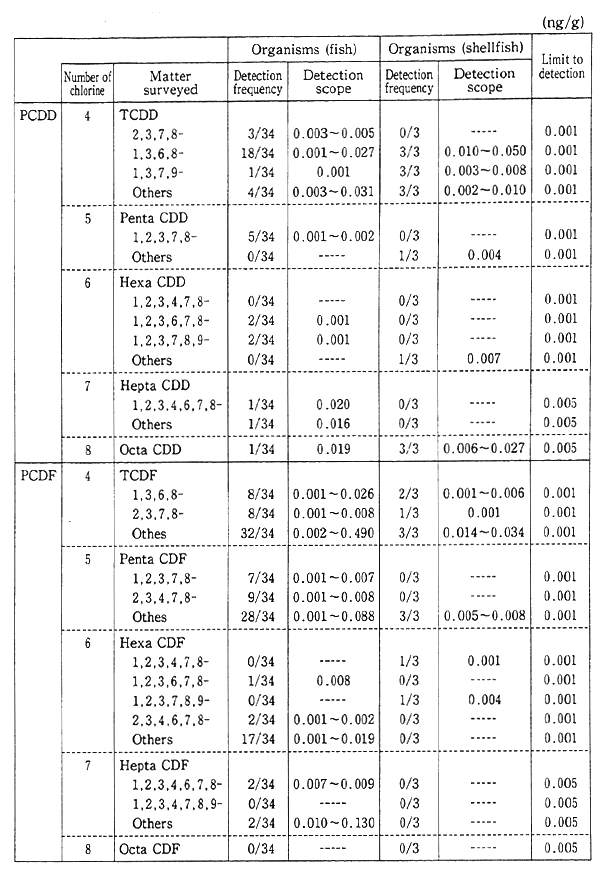
Source:Environment Agency
1-1-8 Wastes
Wastes are solid and liquid refuse which come out of man's daily activities, giving rise to pollution in their inappropriate disposal. Under the Law Concerning the Treatment and Cleaning of Wastes, wastes are disposed of at a final disposal plant equipped with appropriate facilities through intermediate means of treatment, such as incineration and dehydration.
The wastes include waste acid, alkali, waste oil and so forth emitted in business practices, dust and soot gathered from smoke and foul water by equipment for the prevention of environmental pollution, sludge and other industrial wastes, and general wastes including ho use- hold trash. For the responsible disposal of wastes, there is the need for the development of facilities and other efforts. In recent years, however, their number has increased, but the limited capacity of final disposal plants has become conspicuous, as it has become difficult to construct new ones due to opposition by residents near the proposed site. There are also cases in which hazardous wastes of the kind which would possibly pollute the environment are brought into developing countries from Europe and other reunions and were improperly disposed of generating calls for the regulation of transboundary movement of hazardous materials.