Quality of the Environment in Japan 1992
CONCLUSION
Japan's Challengeat the Turning Point for Future Sustainable Earth
We are at a turning point in mankind's history.
Ever since the Industrial Revolution, mankind has reduced reli-ance on products which are put out by ecosystems year by year, positive-ly used underground resources preserved in the earth and developed technology to use them for daily consumption. Particularly, in the efforts to crawl out of the devastation brought about by World War II, Japan and the rest of the world have consciously raised production and stepped up consumption, while thinking that the broadening of economic richness will lead to enhancement of welfare. As a result, environmental pollution and nature disruption came to be observed in various places of the world in the middle of the 1960s. At this stage, environmental pollution and nature disruption were confined to certain areas. Nonethe-less, there appeared many miserable sufferings, and there were grave concerns in developed countries that if that direction was left intact toward the future, mankind's activities would hit the barrier of the environment and there would appear a catastrophic situation where mankind's activities could not be retained as they were. Thus, adminis-trative institutions specializing in environment protection were estab-lished one after another in Japan and Western industrialized countries, and it became a practice to evolve policy specialized from the point of reducing and protecting nature.
In the early period of environmental administration, however, the world was ironically buffeted by an oil crisis in 1973 when the world found itself at the zenith of a high economic growth, and mankind's economic performances were directly confronted with the artificially placed barrier of resources. The impacts stayed long, and the harassed economic performances could not be brought back to what they used to. The moves which were stepped up for energy saving in the midst of that crisis were instrumental in reducing loads on the environment, but the aggravating financial conditions of the peoples, businesses and the government put limits on the investment in environment conservation and the burdening of costs. The oil crisis held sway over environmental administration, with the consequence that it more or less came to a standstill, but environmental administration has at last come to the point where means to overcome problems that cropped in the phase of a high economic growth may be worked out and preparations for moving to the next phase may be made.
Amidst this confusion, many developing countries which had to give precedence to economic growth over environmental issues are now placed in a more economically difficult plight. Depending on their location, developing countries find themselves in a vicious cycle of poverty and environmental disruption and are forced to quicken the pace of economic growth without full consideration to the prevention of pollution. For the development of developing countries, the 1980s were known as "lost decade," and for many developing countries, in order recover this "loss", development has become something which has to be urgently accomplished, and on the other hand, it has become increasing-ly necessary to exercise prudent care about its realization. In central planning economies, such as those in Eastern Europe and the former Soviet Union, inefficiency in a rigidly regulated economic management system for many years ran against a wall, and they have begun a new start for democratizing and developing themselves into market econ-omies.
Now, it has been 20 years since the Stockholm Conference on Human and the Environment. In June 1992, the U. N. Conference on Environment and Development is to be held in Brazil. The world is to make a fresh start after many years of confusion after the oil crisis, extricating itself from the heavy pressure of military tensions in the Cold War between East and West. This signifies the arrival of a chance to make yet another challenge in integrating the environment and economics, which has not been realized though the road for this was paved 20 years ago, and working for enjoyable development in which people in East and West, N orth and South, in present and future, share the benefit. While awaiting that chance, we must not forget that the global environment becomes all the poorer. The environmental loads which are responsible for man's activities are incomparably greater than 20 years ago, and environmental pollution and disruption are in progress.
Can we wisely act ourselves in this challenge? In Chapters 3 and 4, we have seen various measures which are done for a betterment of the present environment around us from the point of sustainability and in a perspective of the earth in the future. As we have seen there, our socioeconomic performances make the global environment in the future poorer and dirtier and are not sustainable. We must also admit that the measures are still wanting in the perspective of the enhancement of sustainability. With conventional environmental administration intact, the future of man's activities which significantly depends on the environ-ment would be endangered.
As suggested in many predictions, if things are left as they are, mankind will possibly live in an environment entirely different than at present, tens of years later. It is we ourselves who determine the environment in which the next generation lives. As long as there is no doubt that the products available on the earth and its capacity to accept no-longer-required things that come from man's activities, the earth itself will soon or later become incompatible with mankind, unless actions different from that of now are taken. Given this trend, the failure to immediately start taking actions for the environment protec-tion on our part means that we are groping for immediate profits at the sacrifice of resources for the future generation's resources. There are calls for wisdom with which part of our profits today will be invested in the infrastructures for future activities.
Such wisdom is required not only for the future but for today as well. Countries grasp profits and losses within the framework demar-cated by national boundaries, and they are seldom come to recognize how that prosperity is paid for. Nature in developing countries has been disrupted in sharp contrast to the overcoming of pollution by developed countries. If there had not been national boundaries, people would have invested their pays and labor in rescuing sufferers from environmental disruption, be it beyond the horizon. If those efforts had not been blessed, people would have abandoned the unfavorable environment and moved to areas in an economically better and more rich environment. But those moves are not observed in the world we live in, because there are national boundaries. Even though people are separated by national boundaries, they must use their reason and help one another. If the earth is disrupted, whoever is responsible, the existence of all mankind will be endangered. There is no replacement for the earth, from which man could take flight.
From the 17th century to the mid-19th century, Japan remained an isolated country. Depending on foreign resources to some extent, it built refined culture of its own while making full use of natural products available in the country. In this society, the advancement of technology was not necessarily so fast, and humanity was often oppressed in the midst of feudalistic social relations. Depending on the climate, many lives were lost by famine. Nobody wants a return to the same world as in the Edo Era with those sufferings, but in the sense that man has to live on the earth, the Japanese today find themselves in the same fate as those in the Edo Era. Man must coexist with a finite global environment and work for their happiness there. In the Edo Era, he who had felled trees in the forest reserves were severely punished, and people offered labor and money and were all of a sweat in doing hard civil-engineering work in attempts to have as efficient access to natural products as possible or preventing ferocious natural disasters. Even the contempo-rary Japanese people are able to see achievements from the strenuous efforts made by people in the Edo Era in the form of beautiful forests, and they live while depending on embankments and paddy and upland fields they constructed. In order to continue to live in the global environ-ment, it must be clearly understood that the earth is finite and that behavior which benefits this notion must be brought up. If people act without regard to the fact that the earth is materially a closed system, the ensuing disasters will be of unbearable proportions. On the other hand, the Japanese people have equipped themselves with such refined virtues as mutual help, mutual concession and self-sacrifice and enjoyed their own culture in such a closed world as the earth. The wisdom of the Japanese people can never be described as worthless in the contempo-rary era. There is no doubt that the Japanese people are more required to boast about to the world in the sectors of technology, wisdom, will and culture, but not just the sector where its economic strength is put to effective use.
All things we must to do now is to accumulate scientific knowl-edge in order to carry out more accurate measures and to implement feasible measures steadily. If those measures are put off, people in the posterity will have to bear the costs for environmental disruption in the form of damage. Even if it is possible to let someone else pay the costs for environment conservation, someone in the world or in some time must pay the bill. Some of the benefits we gain today are the pretenses which are gained at the sacrifice of the environment. If that is the picture, then, is it not the key to the implementation of measures for each country or person to turn over some of the private benefits and acquired interests, or the benefits expected to come in the future, and to willingly bear costs and labor? There is the need to keep it in mind that without such a firm determination, tomorrow for mankind can not be saved.
Many things must be done for the building a sustainable global society. This white paper focus on four points--the selection of a value judgment in which long-term profits are taken into account instead of merely pursuing short-term benefits, shift to the idea of working for coexistence in the ecosystems as one of its members instead of conflict-ing with them, improvements in the quality of economic development in light of human basic needs, and the participation and cooperation of a broader range of people in environment conservation, and there are calls for coping with those measures in a sweat instead of ending in mere fanfare.
In particular, developed countries have enjoyed the fruit of eco-nomic growth to their hearts' content. Japan and other developed countries should correct their posture, first. Japan has considerably high capability in the world to challenge and overcome adversities. We are proud that we are born in such a country. Fortunately, Japan finds itself in a position to easily understand what people both in the developed and the developing countries have in mind in light of its historical experi-ence. It has also experienced in tackling the environmental problems in the process of rapid development from an agricultural country to an industrial country and is equipped with technology it has nourished in the meantime. We must assign ourselves with a task of setting an example to other countries, such as by making effective use of its experience and implementing effective measures one after another, instead of passive attitude like awaiting efforts of other countries. Though there domestically exist many issues on pollution and nature disruption, Japan has already made significant efforts in the field of environmental measures. It is not an easy task to further reinforce them. Nonetheless, it is crucially important for Japan to act as a pioneer in carrying out the measures to ensure the sustainable earth.
In Japan, there are no resources worthy of note other than people and rich nature. In the long run, Japan have experience of developing its culture, making effective use of its limited resources. If we share efforts to realize a more peaceful and richer global society some day in the future, and prepare a new page in mankind's history in cooperation with world countries, people in our posterity may undoubtedly secure an honorable position. It might be said that never have there been so great hopes pinned on Japan's wisdom and efforts than at present. In response to the achievements of the Earth Summit, we must make a new determi-nation and rise up for new and alternative actions.
PartII
Chapter5. Comprehensive Promotion of Environmental Administration
5-1 Conceptual Framework of Environmental Conservation Related Budgets, Etc.
5-1-1 Outline of Budget and Financial Loans and Investment
The budgets related to environmental conservation for fiscal 1991 reached an aggregated total of ¥1,451.3 billion in terms of the combina-tion of totals in the General Account and each Special Account. This represents an increase of ¥111 billion, or 8.3%, from the initial budgets for fiscal 1990 (Table 5-1-1).
Table 5-1-1 Environment Conservation Related Budget by Ministry and Agency (Initial)
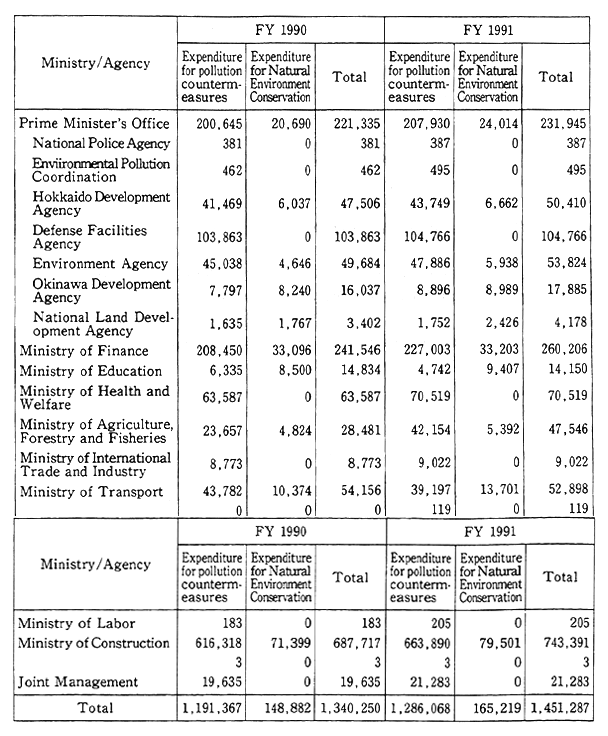
Remarks:1. Surveyed by the Environment Agency.
2. The expenditures which are allocated under implementation programs are excluded.
3. As the first digit of each figure is rounded to the nearest number, the figures thus rounded do not necessarily add up to the figures shown in "Total."
The expenditures for anti-pollution projects by institutions for which financial loans and investments were available came to ¥1,851 billion in the initial programs for fiscal 1991, up 183.4 billion from the 1, 667.6 billion earmarked for the initial programs for fiscal 1990.
5-1-2 Environmental Conservation-Related Budgets
The budgets related to environmental conservation in fiscal 1991 were executed on a priority basis particularly for the following items with a view to promoting environmental administration.
(1) Development of Various Standards, Etc.
¥1,066,770,000 was earmarked for the development of environ-mental quality standards and emission standards.
(2) Strengthening of Surveillance and Control
¥6,271,350,000 was earmarked for surveillance and control over air pollution, water pollution and so forth. The major items are as follows:
Facilities for Facilities for Pollution Monitoring ¥828,850,000
Measures for Insuring the Safety of Chemicals ¥1,017,140,000
Water Pollution Prevention Measures ¥434,090,000
Air Pollution Prevention Measures ¥282,520,000
(3) Subsidization of Environmental Pollution Prevention Projects
To encourage the installation by private corporations of pollution prevention facilities, an aggregate total of ¥7,696,420,000 was earmar-ked. Broken down, the main items are,as follows:
Expenditure Associated with Projects for Construction and Sale by Japan Environment Corporation ¥4,004,210,000
Measures for Conservation of the Environment of Fishing Grounds ¥1,202,240,000
(4) Promotion of Environmental Pollution-Related Public Works Projects, Etc.
To promote environmental pollution-related public works pro-jects, etc., an aggregate total of ¥1,202,355,060,000 was earmarked. Broken down, the main items are as follows:
Sewage Projects ¥874,566,000,000
Measures for Noise Prevention of Schools, Houses,etc. ¥131,763,050,000
Redevelopment of Waste Treatment Facilities ¥94,933, 130,000
Farming Hamlet Drainage Projects ¥62,196,000,000
Measures Against Land Subsidence ¥10,8 12,970,000
Green Buffer Zone Projects ¥4,036,000,000
Construction for Mine Pollution Prevention at Shut Down or Abandoned Mines ¥3,062,150,000
(5) Promotion of Surveys and Studies of Environmental Pollution Prevention
To strengthen surveys and studies of environmental conservation, an aggregate total of ¥30,214.8 million was earmarked. Broken down, the main items are as follows:
Expenditure for National Institute for Environment Studies ¥5,535,820,000
Tests and Studies on prevention of Environmental Pollution, Etc., by National Institutions ¥1,928,040,000
Comprehensive Promotion of Studies on the Global Environment ¥1,700,000,000
Study and Development of New Energy Technologies ¥894,000,000
Surveys and Studies for Pollution Prevention of Environmental Pollution ¥1,066,370,000
Grants-in-Aid for Scientific Research Outlays ¥620,000,000
(6) Replenishment of Funds Established for Protection of Environmental Pollution Sufferers, Etc.
To replenish funds used for protective measures for suffers from environmental pollution, an aggregate total of ¥24,369,710,000 was earmarked. Broken down, the main items are as follows:
Costs, Such as Payment of Indemnities to Suffers from Environmental Pollution ¥22,816,040,000
Costs for Arbitration in Disputes over Environmental Pollution ¥495,440,000
(7) Promotion of Measures for Nature Protection
To work for the conservation of the natural environment, ¥165, 218,810,000 was earmarked. Broken down, the main items are as fol-lows:
Costs for the management of national and quasi-national parks, etc., for development of facilities ¥5,539,520,000
Expenditure for park projects ¥116,706,860,000
Expenditure for projects to redevelop the environmentals seacoasts, ports and harbors ¥23,165,300,000
Outlays to purchase historic relics ¥3,705,460,000
(8) Others
In addition, ¥14,093,750,000 was earmarked for carbon dioxide fixation, for effective utilization (¥2,855,250,000) and other measures.
5-1-3 Financial Loans and Investments
Financial loans and investments are used by government related institutions, such as the Environmental Pollution Control Service Corpo-ration, Japan Development Bank, Hokkaido and Tohoku Development Corporation, Environmental Hygiene Finance Corporation, Smaller Business Finance Corporation, People's Finance Corporation, Small Business Promotion Corporation, Agriculture, Forestry and Fishery Finance Corporation, Metal and Mining Industries Corporation and Okinawa Development Finance Corporation, to subsidize private businesses, among others, to invest in facilities against environmental pollution. They are also used to promote the improvement, etc., of sewage projects by local governments, with measures for financial sources under local-bond programs.
5-1-4 Tax Measures on Loans and Subsidies for Environmental Pollution, Etc.
To promote environmental pollution prevention measures by private institutions, subsidization and tax measures are being im-plemented by the Environmental Pollution Control Service Corporation and other organizations.
(1) Subsidization by Japan Environment Corporation (JEC)
a. JEC's Lines of Administrative Work
Since its establishment in 1965, the Japan Environment Corpora-tion has performed administrative work on construction and sale and on loans to prevent environmental pollution.
(a) Construction and Sales
The JEC accepts applications from entrepreneurs. If approved, the JEC builds facilities such as (1) group installation of buildings, (2) facilities of multiple benefit to the public (buffer green zones and park facilities), (3) green zones against air pollution, (4) facilities at national and quasi-national parks and (5) sites for the move-in of factories. Upon completion of those facilities, the Corporation sells them to the entrepre-neurs at cost with long-term repayment, at low interest rates.
(b) Loans
The Japan Environment Corporation also advances funds for projects, such as (1) facilities for the prevention of industrial pollution and (2) the prevention of soil pollution in developed areas, and (3) the installation of combined septic tanks.
a. Projects in Fiscal 1991
The projects actually undertaken in fiscal 1990 and those which are to be undertaken in fiscal 1991 are as follows:
Projects for fiscal 1991 ¥80 billion
(amount of new contracts)
(Including ¥50 billion for construction and sale projects and ¥30 billion for loan projects)
Projects actually done in fiscal 1990 ¥74 billion
(Including ¥49 billion for construction and sale projects and ¥25 billion for loan projects)
(2) Loans by Other Government Institutions
Other government institutions also subsidize pollution prevention, depending on their respective characteristics.
a. Loans Under Funding for Modernization of Medium and Small Business Facilities
As part of the system of funding the modernization of medium and small business facilities, loans are advanced to individual medium and small businesses through prefectural governments for the installa-tion of facilities to prevent pollution. For the proprietors of small business, a system is in effect whereby the lending institutions estab-lished by prefectural governments can lend facilities to those proprie-tors.
b. Loans are extended by Smaller Business Corporation, People's Finance Corporation and Okinawa Development Finance Corpo-ration, and Special loans are available for theAArelocation of small and medium businesses.
c. Loans by Smaller Business Finance Corporation
As part of the system of development loans by the Smaller Business Finance Corporation, loans are provided for projects to group factories in order to eliminate residence-cum-factory facilities and for projects in which multi-user treatment facilities will be established for pollution prevention.
d. Loans by the Japan Development Bank The Japan Development Bank has extended loans for the modifi-cation of facilities for environmental protection,
e. Loans by the Hokkaido and Tohoku Development Finance Cor-poration
The Hokkaido and Tohoku Finance Corporation lent funds for the modification of facilities to prevent pollution in the Hokkaido and Tohoku regions.
f. Loans by the Agriculture, Forestry and Fisheries Finance Corpo-ration
The Agriculture, Forestry and Fisheries Finance Corporation advanced funds for the installation of cattle feces treatment facilities, etc., using a loan framework of Y900 million.
g. Loans by the Metal and Mining Industries Corporation
The Metal and Mining Industries Corporation advanced loans for projects to prevent mine pollution and loans for the shares of entrepre-neurs under the Law Concerning Entrepreneurs' Bearing of the Cost of the Public Pollution Control Works by taking advantage of a loan framework of Y1.7 billion.
(3) Tax Measures
Special tax measures have been implemented to support private sector efforts for environmental conservation, The special measures newly formulated or renewed in fiscal 1992 are as follows:
a. Special Measures Related to National Taxes
(a) Special redemption measures were formulated for equipment to de-ink old paper and ink treatment, can sorting and crushing equipment and equipment for the removal of foreign matter from waste glass prior to treatment, in order to promote the use of recycled paper, cans and glass bottles.
(b) As a condition for the enforcement of the Law which Partially revises the Law Concerning the Protection of the Ozone Layer, special redemption measures for controls on emissions which contribute to reductions in the emission of specified CFCs used in the cleansing sector and recovery facilities were expanded to encompass trichloroethane.
(c) As regards specified facilities in designated districts, etc., which were additionally designated for controls with the revision of the Water Pollution Prevention Law in June the year before last and so forth, they were designated as exceptions to the levying of taxes on incomes from alienation in cases where specified property for business were replaced with new ones. In addition, the invocation of the existing special tax measures was extended.
(d) The term was extended during which special redemption mea-sures would be in effect for waste water treatment facilities, smoke and soot control devices and solid waste treatment facilities.
(e) The application of exemptions to the levying of taxes on income from long-term transfer was extended in cases where individuals sell land for use in the Japan Environment Corporation's projects for con-struction and sale.
(f) Measures were taken to provide exemptions from levying the land price tax on the following.:
A. Land related to the conservation of the natural environment: Forests, ponds, marshes, etc., in the following areas (districts):
a) Special areas of national or quasi-national parks
b) Special areas of prefectural nature parks (confined to those on which the same controls are exercised as in the special areas of national parks)
c) Special sections of areas set aside for the conservation of the natural environment
d) Special areas of prefectural districts for the conservation of the natural environment (confined to those on which the same controls are exercised as in the special sections of areas for the conservation of the natural environment)
e) Special protection regions within areas for the protection of wild animals.
B. Land related to the Japan Environment Corporation: Included is Land., etc., which will be offered for building construction by groups for the prevention of industrial pollution, as they are bought by business cooperatives and so forth from the JEC confined to those which are scheduled to be resold to coopera-tives, etc.)
(g) For land, etc., which would be offered for sanitary waste treat-ment facilities and industrial waste treatment facilities, special mea-sures were implemented for the computation of taxable prices in rela-tion to the land price tax.
b. Local Taxes
(a) For oil refineries which would install light oil desulfurization facilities, measures were implemented for a reduction in the taxable standards of the fixed asset tax (exclusively for fiscal 1991 and 1992).
(b) For medium-scale raw sewage treatment tanks (specified facil-ities in designated areas) which were subjected to controls with the revision of the Water Pollution Prevention Law in June 1989, measures were taken for exemption from the fixed asset tax, the special land ownership tax and the business establishment tax, as was the case with facilities subjected to controls in the earlier years.
(c) The term was extended during which exceptions could be made to the levying of the automobile acquisition tax, for the purchase of electric automobiles.
(d) The term was extended during which special measures for calcu-lating the fixed asset tax were applied to emission controls which would contribute to cuts in the emission of specified CFCs, (used in the cleans-ing sector), and to recovery facilities.
5-1-5 Sharing by Entrepreneurs of Environmental Pollution Prevention Project Outlays
In situations where the State or local governments are to carry out projects for the prevention of pollution, as those projects are necessitated due to the business performance of entrepreneurs, the Law Concerning Entrepreneurs' Bearing of the Cost of Public Pollution Control Works calls for them to share costs for environmental pollution prevention projects, depending on the degrees of the causes.
As of the end of March 1992, the status of environmental pollu-tion prevention projects, to which the Law Concerning Entrepreneurs' Bearing of the Cost of Public Pollution Control Works had been applied (since its enactment in May 1971), is shown in Table 5-1-2.
The cases where the law was invoked and programs for the sharing of costs were formulated in 1990 are given in Table 5-1-3.
Table 5-1-2 Shares of Cost Burdens for Pollution Prevention Projects by Entrepreneurs
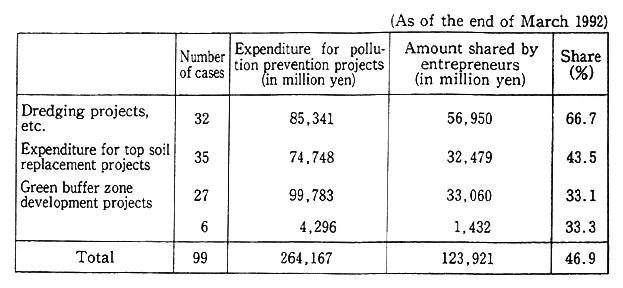
Remarks:1. Surveyed by the Environment Agency.
2. As there are projects in which dredging projects, etc., are conducted along with green buffer zone projects, the number of project-specific cases does not agree with the total of cases.
3. The expenditure for pollution prevention projects and the total of costs burdened by entrepreneurs are on a plan basis.
Table 5-1-3 Cases with Invocation of Law for Burdening of Pollution Prevention Project Expenditure by Entrepreneurs

5-2 Environmental Impacts Assessment
(1) Environmental Impacts Assessment
The environmental impacts assessment is designed to make full surveys, prediction and assessment in advance on possible environmen-tal impacts which may arise from the execution of projects, release the findings and listen to the views of community residents and so forth so that environmental conservation measures may be implemented to the full. It is an effective means to prevent environmental pollution.
In Japan, the environmental impacts assessment has been perfor-med under the Public Waters Reclamation Law and other individual laws, administrative guidance by ministries and agencies, ordinances and operating procedures of local governments, etc., since the Cabinet approved "On the Environmental Conservation Measures Relating to Public Works" in June 1972.
Furthermore, the Cabinet approved "Implementation of Environ-mental Impact Assessment" in August 1984 and formulated the "Outline for the Implementation of Environmental Impact Assessment" as a uniform rule for large-scale projects in which the State would be involved.
In summary, the applicable projects include those which are large scale and likely to produce significant impacts, provided that they are those which are conducted by the State or in which it is involved, such as in permitting. They include spatial development projects, such as roads, dams, railways, airports, land reclamation, inning and land zoning adjustment projects.
A summary of procedures taken by project-undertakers is given below: (Fig. 5-2-1)
(A) In regard to the impacts that are brought about by the projects, project-undertakers shall make prior surveys, estimate and assess in accordance with the guideline formulated upon consultation between the concerned ministers and the Director-General of the Environment Agency. They shall then come out with a prepara-tory draft environmental impacts statement (hereinafter referred to as "draft EIS").
(B) Project-undertakers shall serve public notice on, and send out the draft EIS and shall hold briefings.
(C) Project-undertakers shall strive to understand the views of resi-dents in the relevant areas on the draft EIS. They shall call on the governor of the affected prefectures to express their views after listening to the views of the mayors of the related municipalities.
(D) After listening to those views, project-undertakers shall review the descriptions contained in the draft EIS, prepare a final envi-ronmental impacts statement (hereinafter referred to as "final EIS"), serve public notice on, and distribute the statement.
It is stipulated that administrative agencies shall take account of environmental impacts on the final EIS in the licensing of subject projects and other cases. It is also stimulated that the competent minister shall listen to the views of the Director-General of the Environ-ment Agency, if deemed necessary.
In 1991, there were 68 assessments of environmental impacts for which the procedures were completed in accordance with the afore-mentioned outline (Table 5-2-2).
Fig. 5-2-1 Flow of Procedures in Outline for Implementation of Environmental Impact Assessment
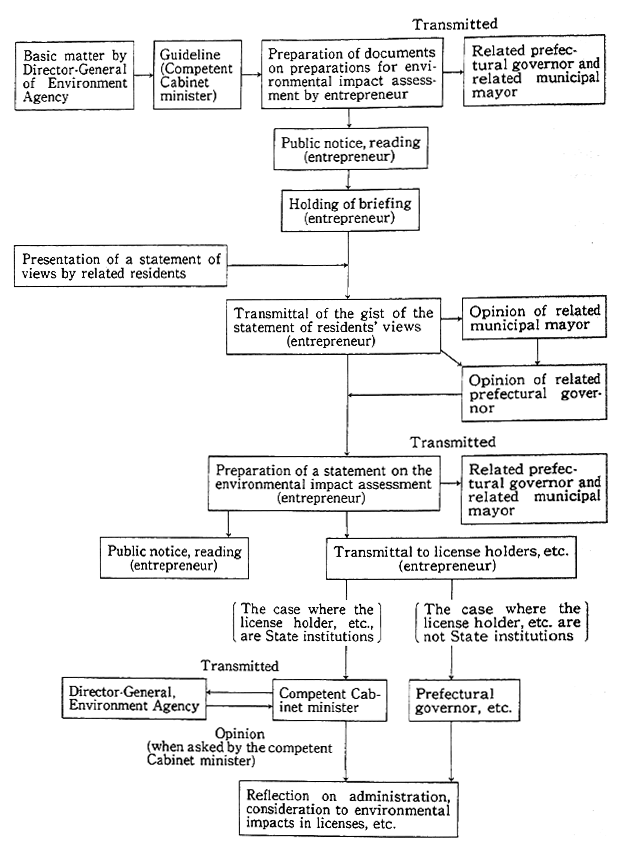
Table 5-2-2 Breakdown of Environmental Impact Assessments Made According to Cabinet Decisions (1991)

Remarks: The figures in parentheses represent the aggregates as of the end of 1989.
(2) Environmental Impacts Assessment Under Individual Laws
The outline of the assessments of environmental impacts made in fiscal 1991 under the Port and Harbor Law and the Public Waters Reclamation Law, among others, is given below:
(A) Port and Harbor Plans
The port and harbor plans formulated under the Port and Harbor Law are essential for the development, utilization and conservation of ports and harbors. In preparation of these plans, environmental impacts are assessed. In fiscal 1991, the port and harbor plans formulated for Kinugaura, Chiba and other ports were adjusted based on their impact statement.
(B) Reclamation of Public Waters
It is stipulated that possible impacts on the environment shall be checked in advance to the licensing of reclamation under the Public Waters Reclamation Law. For reclamation in excess of 50 hectares and reclamation in need of special consideration to environmental conserva-tion, it is stipulated that the competent minister must listen to the views of the Director General of the Environment Agency. In fiscal 1991, reclamation at Nagoya and other ports was studied and the Director General of the Environment Agency set forth his views.
(C) Location of Power Generation Plants
For the location of power generation plants, environmental impacts are assessed under the administrative guidance of the Ministry of International Trade and Industry, and studies are also made on environmental conservation during the course of deliberations at the Electric Sources Development Council. In fiscal 1991, the programs for the Katsuno River Power Generation Plant etc. were modified based on impact statement.
(D) Others
a. City Planning for Urbanization Promotion Areas
As regards city planning for urbanization promotion areas under the City Planning Law, it is stipulated that the views of the Director-General of the Environment Agency shall be sought in advance.
b. In formulating basic concepts and implementing projects under the Comprehensive Resort Areas Development Law, it is stipulated that studies shall be made in a perspective of environmental conservation, depending on the substance, and that the compete minister shall discuss with the Director General of the Environment Agency in approving of the basic concepts. Necessary adjustments were made to the basic concepts of five prefectures in fiscal 1991.
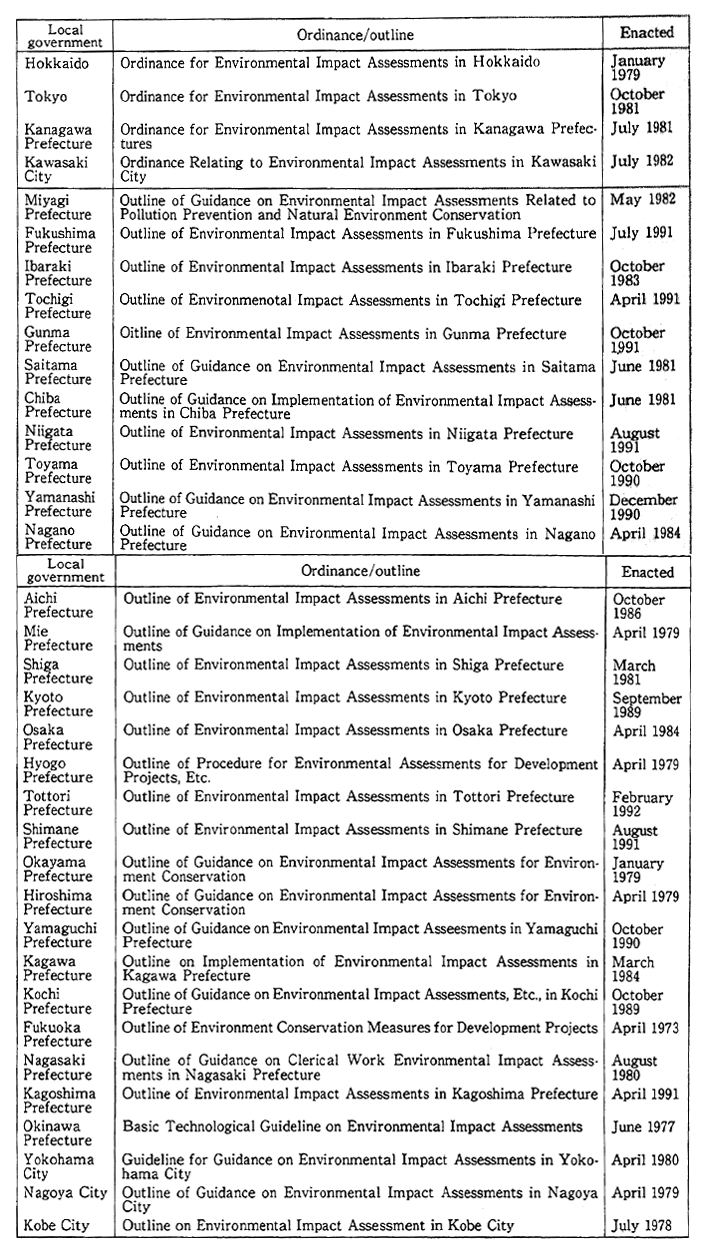
(3) Environmental Impact assessment in Local Government
Local governments also have the environmental impacts assess-ment system, underordinances or general plants (Table 5-2-3).
Table 5-2-3 Enactment of Ordinances and Outlines on Environmental Assessments
5-3 Community-Oriented Environmental Conservation
5-3-1 Environmental Management
There is the need not only to prevent environmental pollution now but also to conserve and use environmental resources, such as water, air, soil and forests, for the building of a better environment. For this, it is essential, after making clear the desirable objective for the global environment, to promote management of the global environment with the comprehensive and systematic implementation of a variety of measures.
Progress in the formulation and evaluation of regional environ-mental control programs for that purpose is being made by many local governments. The Environment Agency is providing those local govern-ments with guidance and advice on the formulation and smooth imple-mentation of the programs. The agency also subsidizes prefectures which streamline information about environmental resources and for-mulate guidelines for local development with consideration given to the environment and local development programs with the effective use of environmental resources.
In the Nation's Capital Region and other major urban areas, the environmental conditions are unfavorable, and calls by residents for a more comfortable environment are growing further. In the midst of moves for a boost in domestic demand, many large scale projects are planned, thus making it necessary to promote inter-jurisdictional envi-ronment controls. Having promoted studies on the way inter-jurisdictional environmental controls ought to be in major urban areas, the Environment Agency conducted surveys and evaluations, centering on the Kinki and Chubu areas in fiscal 1991.
On the other hand, it is important for each person to recognize the present state of environmental issues and the importance of conserving the environment and to step up actions in their everyday lives which will contribute to environmental conservation. For this purpose, in 1989 a fund for conservation of the local environment was established in each of the prefectures andcities designed by administrative ordinance to carry out projects for the dissemination and enhancement of knowledge about local conservation. In fiscal 1990, video tapes, slides and other aids were prepared, and symposia and festivals were held.
Then, there are mounting calls for the utilization of vacant underground space for public purposes. In this vein, there is concern about the impacts of underground space on land subsidence and on hot spring sources. To address this, the Environment Agency is conducting studies at the Investigative Meeting Concerning Environmental Man-agement of the Ground and Underground Development.
5-3-2 Building of Comfortable Communities sensitive to the Environment
(1) Assurance of Amenities
Green and clean riverbanks, beautiful streets, historic atmo-spheres and other comfortable amenities bring about charm and peace of mind. With the people's environmental needs in the process of becoming more sophisticated, there is the need to create a comfortable environment. There is a wide variety of measures for the building of a comfortable environment, including those enumerated below:
(A) Modification of facilities to improve communion with nature, water and other elements of the environment
(B) Conservation of the good state of the natural world, (such as forests and watersides), around us
(C) Creation of comfortable urban and living space, such as the scenes of roads and streets
(D) Measures for the assurance of rules of social behavior with attention focused on the environment
(E) Preservation of historic and cultural assets with which to enhance the quality of the environment
In conjunction with a symposium in October 1991, the Environ-ment Agency for the second time gave letters of commendation to local governments excellent at the building of communities full of amenities.
(2) Building of Environmentally Conservative Cities (Eco-polis)
In existing cities, not only is existent nature being lost, but the ecosystem is being impaired by the inefficient and high-density utiliza-tion of energy as well. For this reason, it is necessary to step up city building by introducing an urban system of the environmental conserva-tion type, including water penetrable pavements, utilization of waste heat from sewage systems and that of natural energy, recovering the ecological circulation of cities and lessening environmental loads. In this perspective, the Environment Agency subsidized local governments which would formulate plans (Eco-polis Plans) to comprehensively promote the preservation of nature.
5-4 Pollution Prevention Programs
5-4-1 Outline of Pollution Prevention Programs
(1) Present Status of Pollution Prevention Programs
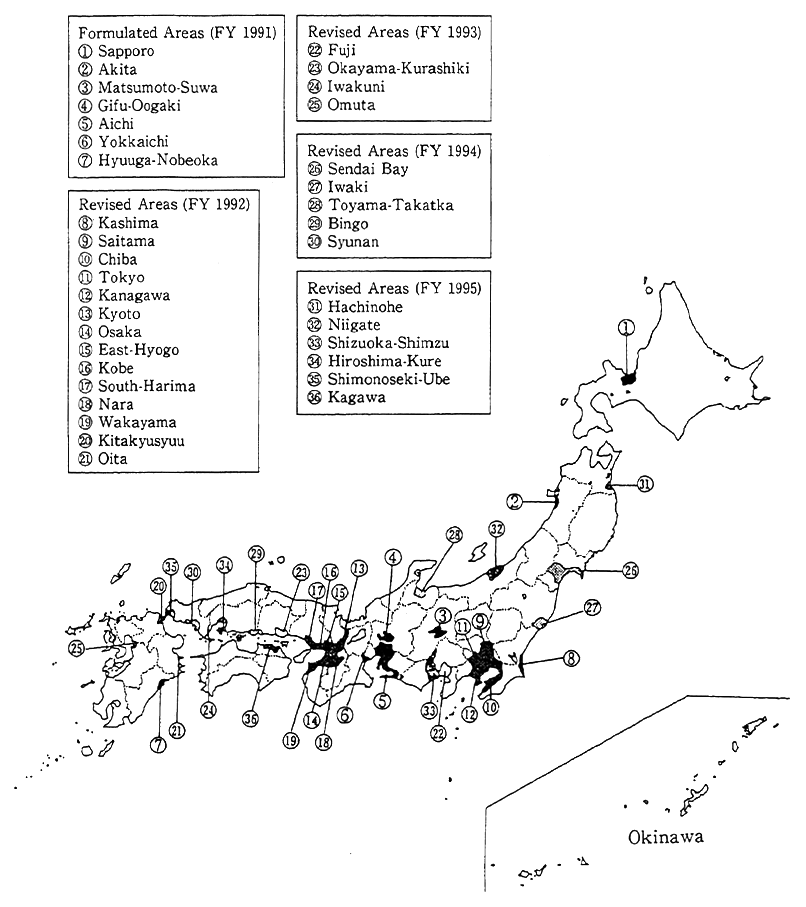
For areas with significant environmental pollution, pollution prevention programs are prepared by the governors of the related prefectures under the Basic Law for Environmental Pollution Control, directed by the Prime Minister, and endorsed by the Prime Minister to comprehensively promote the projects and measures of entrepreneurs and local governments for the prevention of environmental pollution. By now, environmental pollution prevention programs have been formulat-ed for 36 areas, covering principal industrial cities and major cities across the nation.
The rates of those cities to all cities in th nation stand about 54% in terms of area and about 62% in terms of the amounts of products shipped out and so forth.
For Sapporo and six other areas for which the program term expired as of the end of fiscal 1990, new environmental pollution prevention programs were formulated. (Table 5-4-1, Figure 5-4-1)
Table 5-4-1 Formulation of Pollution Prevention Programs
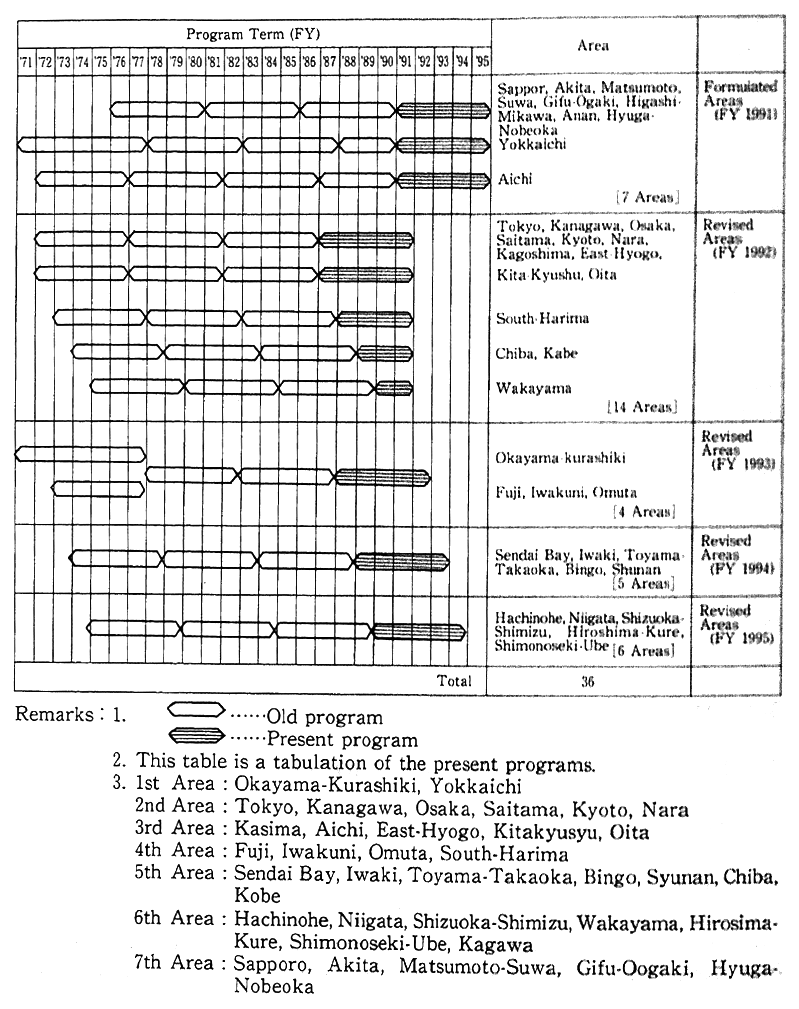
Fig. 5-4-1 Areas With Pollution Prevention Programs Formulated (Present Programs)
5-4-2 Formulation of Pollution Prevention Programs in Fiscal 1991
For Sapporo and six other areas for which the program term expired as of the end of fiscal 1990, the Prime Minister instructed the governors of the related prefectures to formulate pollution prevention programs, and they prepared pollution prevention programs in accor-dance with the basic policy associated with each area. On March 12, 1992, the Prime Minister approved the environmental pollution preven-tion program prepared for each area (Table 5-4-2). The gist is as follows:
(A) Scope of Areas
The seven areas are shown in Table 5-4-3.
(B) Purpose of Program
The target of each program is to achieve environmental quality standards, and it is stipulated that efforts shall be made to accomplish the purpose as a whole by the end of the program term with the promotion of a variety of measures for the prevention of environmental pollution.
(C) Program Term
The program is set at five years from fiscal 1991 to 1995.
(D) Measures for Prevention of Environmental Pollution
It is stipulated that entrepreneurs shall take measures for the prevention of pollution. It is also stipulated that local governments and so forth shall promote countermeasures to pollution such as controls on environmental pollution and environmental assessments ; the improve-ment of sewage systems; that of waste treatment facilities, etc.
(E) Outline of Costs
For the implementation of those measures for the prevention of pollution, it is estimated that when it comes to the estimated costs required for those areas during the program term, the measures which are to be taken by entrepreneurs will require ¥348,800 billion, those which are to be taken by local governments will require ¥1,706.2 billion and those for pollution-related projects will require ¥809.7 billion.
Table 5-4-2 Areas with Pollution Prevention Programs and Their Scope
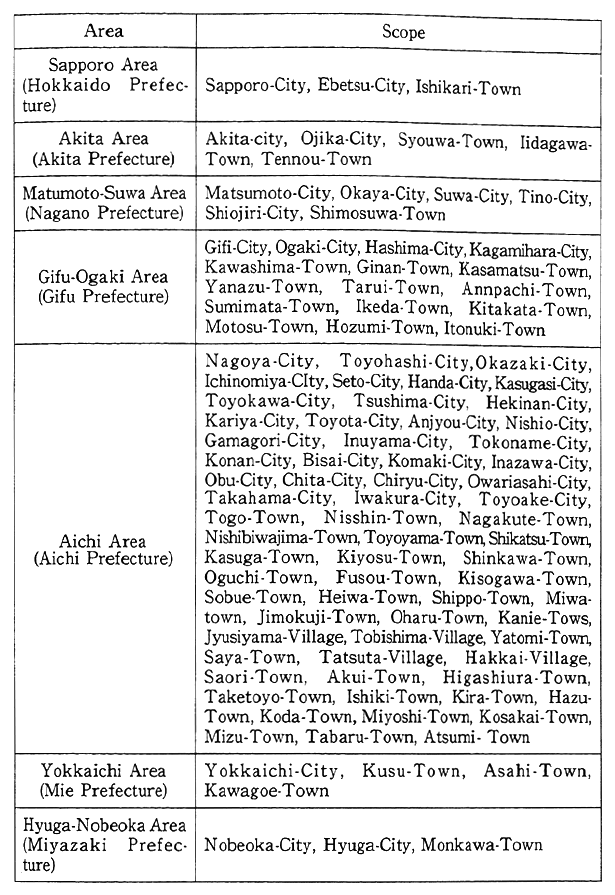
Table 5-4-3 Implementation of Pollution Prevention Programs
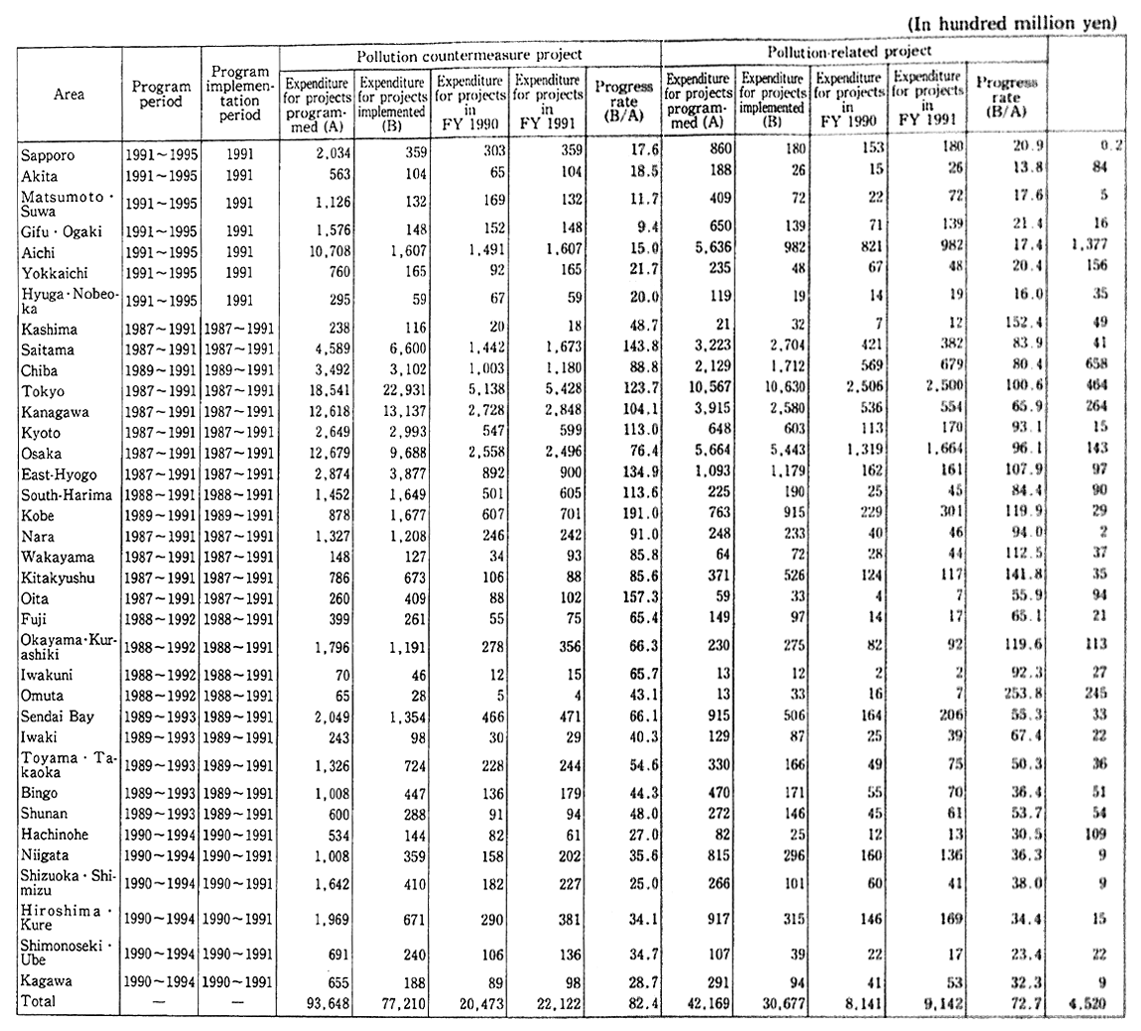
5-4-3 Present Status of Implementation of Pollution Prevention Programs
(1) Implementation of Pollution Prevention Program Projects
As indicated in Table 5-4-3, each local government promotes projects for the prevention of environmental pollution.
(2) Special Financial Measures for Environmental Pollution Prevention Projects under the Law Concerning State's Special Financial Measures for Pollution Prevention Projects
Table 5-4-4 Project Expenditure Associated with Pollution Prevention and State Burdens or Amounts of Subsidies Raised
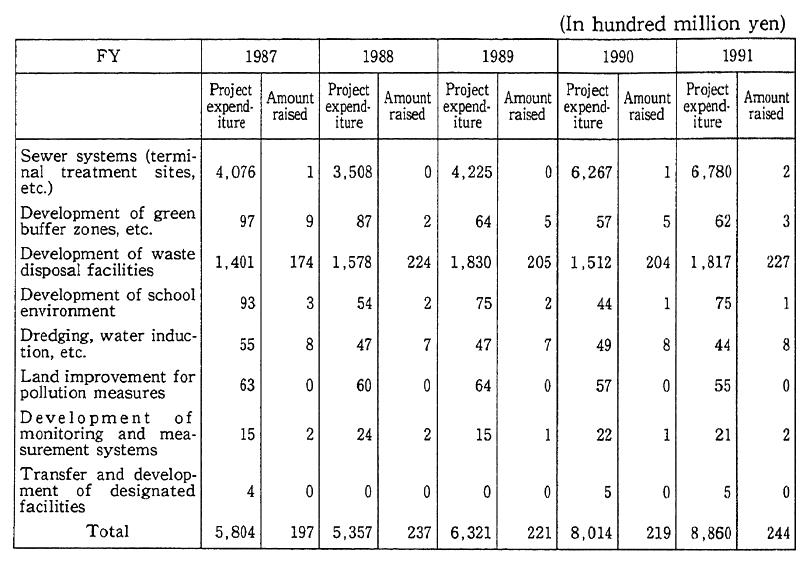
Remarks: 1. Surveyed by the Environment Agency
2. The amounts of the project expenditures and the amounts raised were those projected for FY 1989.
For pollution prevention projects which are to be carried out by local governments under pollution prevention programs, specia national fiscal measures are implemented, such as increases in the state's shares and subsidization rates and the broadening of projects for which local bonds are available. The outlays for environmental pollu-tion projects and the increases in the state's shares and subsidization rates in the last five years are given in Table 5-4-4.
(3) Environmental Quality in Areas with Established Pollution Prevention Programs
By the promotion of various pollution prevention programs, the environmental quality in areas where pollution prevention programs are formulated is as follows:
The rate of monitoring stations which met the environmental quality standards of sulfur dioxide (the number of environmental quality standards achieving monitoring stations/total number of effective monitoring stations) stood at 100% in fiscal 1990.
Data on nitrogen dioxide, checked in terms of environmental quality standards, are indicated in Table 5-4-5. In fiscal 1991, the percentage of monitoring in excess of 0.06 ppm, (the borderline of the environmental quality standards) stood at 10.6%.
Table 5-4-5 Environmental Standards for Nitrogen Dioxide and Responses in Pollution Prevention Program Areas (General Stations)

Remarks:1. Surveyed by the Environment Agency.
2. Monitoring stations whose values are less than the effective monitor-ing hours are excluded.
3. Zaruzman's coefficient=0.84
As for suspended particulate, data are shown in Table 5-4-6. The rate of monitoring stations meeting the standard came to 29.3% in fiscal 1990.
When it comes to photochemical oxidants, the number of monitoring stations reporting compliance with environmental quality standards (below 0.06 ppm in terms of hourly values) accounted for three of 687 monitoring stations in all. The number of monitoring stations which observed values in excess of the standard concentration for the issue of warnings (0.12 ppm in terms of hourly values) was 346 out of 687 monitoring stations.
As regards the water quality of rivers, lakes, marshes and seas, the status of compliance with environmental quality standards for BOD and COD is shown in Table 5-4-7.
Table 5-4-6 Achievement of Environmental Standards for Suspended Particulate Matter in Pollution Prevention Program Area (General Stations)

Remarks:1. Surveyed the Environment Agency.
2. The monitoring stations which have not reached effective monitoring hours are excluded.
Table 5-4-7
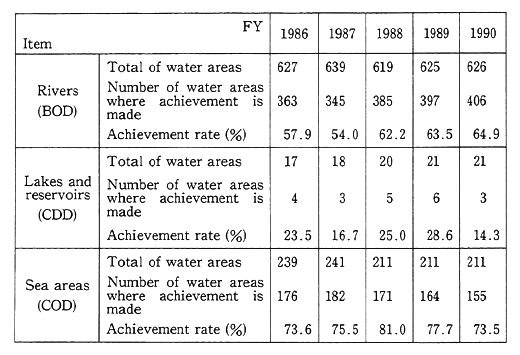
Remarks: Surveyed by the Environment Agency
(4) Implementation of Environmental Pollution Prevention Projects Designated by the Minister of Home Affairs
Some projects for pollution prevention in areas other than those for which pollution prevention programs are formulated, are designated by the Minister of Home Affairs. When it comes to those areas, special financial measure are implemented as is the case with the pollution prevention projects which are based on pollution prevention programs. The pollution prevention programs that have been specified in the last five years are indicated in Table 5-4-8.
Table 5-4-8 Environment Pollution Prevention Projects Designated by Minister of Home Affairs
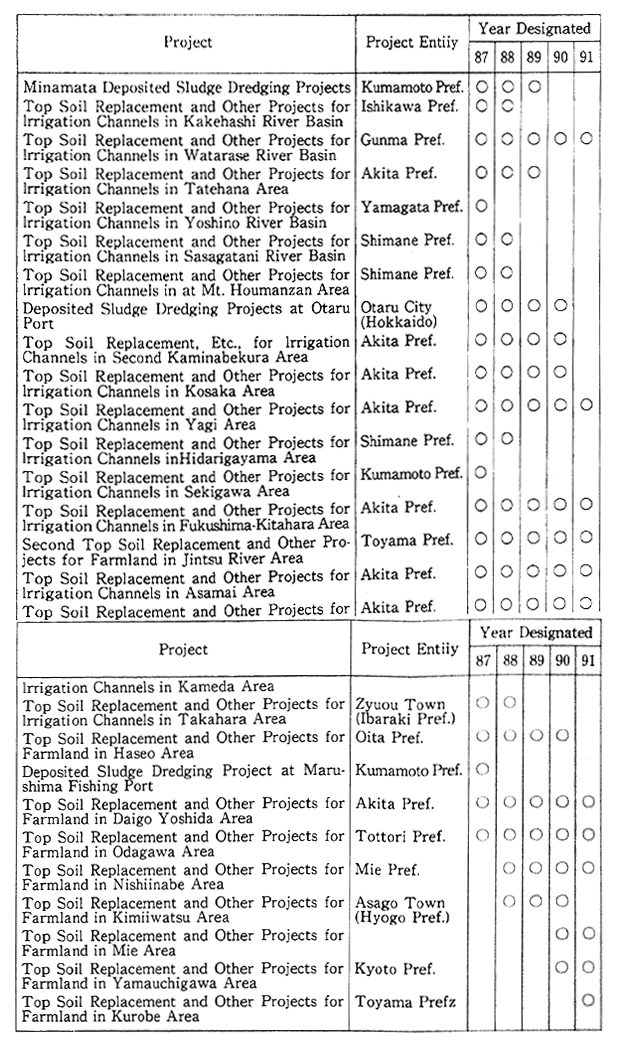
Note : By fiscal 1986, 34 projects had been completed.
5-5 Environmental Conservation Measures for High Technology Industries
In recent years, there has been much progress in the development of so-called high technology, including microelectronics, new materials and biotechnology. High tech development also means the possibilty of new types of environmental pollution from the perspective of emission sources, emission forms and various impacts. In the industrial use of high technology, there is a need to intensively study possible environ-mental impacts, thereby preventing environmental pollution beforehand, and also applying achievements in high technology to issues of environ-mental conservation.
5-5-1 High Technology and Environment
The Environment Agency published the Report of the Environ-mental Technology Council in April 1987, thus laying out the basic direction for environmental conservation to deal with the evolution of high technology. Besides, environmental technological information in the IC sector was released, and the Fact Finding Survey on the IC industry (fiscal 1986) was conducted under the co-sponsorship of the Environment Agency, Ministry of Health and Welfare,Ministry of Inter-national Trade and Industry and Ministry of Labor. Also in the sector of new materials, the guidebook related to environmental protection for engineering plastics was published in December 1989.
5-5-2 Biotechnology and Environment
As the industrial use of biotechnology develops in recent years, studies are being performed both at home and abroad for the assurance of safety in industrial use.
In Japan, related ministries and agencies released guidelines for the industrial use of recombinant DNA technology, and recombinant DNA in closed system has been developed. As for the release of recom-binant DNA into the environment, field experiments are performed in the United States and other countries. For the assurance of safety, the Agency of Science and Technology amended the Operation of the Guideline for Recombinant DNA Experiments in December 1938, thus presenting a concept about experiments in the non-closed system, with the use of plants, and on the basis of this guideline, field experiments have been conducted. Also on the basis of a guideline of the Ministry of Agriculture, Forestry and Fisheries, step-by-step safety consideration is performed for genetically engineered tomato in terms of ecological impacts and so forth in the field experiment. Based on the findings in the experiment, program for cultivation ofrecombinant tomato were ap-proved in February 1992.
The Report of the Experts Committee on Biotechnology estab-lished in the Planning Department of the Central Council for Environ-mental Pollution Control was completed and submitted to the Planning Department in December 1991. It was pointed out in the report that it would be necessary to conduct an environmental assessment for each individual release program in relation to the environmental release of genetically modified organisms. On the basis of this report, the Environ-ment Agency develops technical matters for environmental impacts assessment, and continues to study to concrete administrative measures, while taking account of the evolution of scientific findings.
The Environmental Agency has studying monitoring of organ-isms, application of biotechnology to environment protection and so on to cope with environmental release of genetically modified organisms.
Also, the National Institute for Environmental Studies on plants highly sensitive to photochemical smog (and other complex pollutant) by biotechnology and installed a facility for coillction of microbial cultures to preserve microbial genes which would be useful for environ-mental studies.
5-6 Chemical Substances
5-6-1 Measures on Chemical Substances
(1) Controls of Chemical Substances under the Law Concerning the Examination and Regu1ation of Manufacture, Etc., of Chemical Substances
The prevention of environment pollution by chemical substance is done under the Law Concerning the Examination and Regulation of Manufacture, Etc., of Chemical Substances (hereinafter referred to as "Chemical Matter Examination and Regulation I aw"). the Chemical Matter Examination and Regulation Law, enacted in 1973 and amended in 1986, is designed to perform toxicity surveys on suspected harmful substances (Designated Chemical Substances) and exercise necessary controls (designated as the Second Category of Specified Chemical Substances) in addition to in soluble, bio accumulative and chronically toxic substances (the First Category of Specified Chemical Substances). (See Fig. 5-6-1)
During fiscal 1991, reports were filed on 269 new chemical sub-stances. Of those, 197 did not fall under the category of either the First Category of Specified Chemical Substances or Designated Chemical Substances, and 42 fell under the category of Designated chemical Substances. 67 new chemical substance were listed as Designated Chemical Substances.
To confirm the degree of the safety for existing Chemical sub-stances, the Ministry of International Trade and Industry performed inspections and surveys on the safety and bioaccumulativeness of chemi-cal substances, the Ministry of Health and Welfare on chronic toxicity and other matters, and the Environment Agency on the existence of chemical substances in the environment. As of the end of March 1991, nine substances were designated in the First Category of Specified Chemical Substances, 23 in the Second Category of Specified Chemical Substances and 79 .as Designated Chemical Substances.
Fig. 5-6-1 System of Controls on Chemicals Under Chemical Substance Screening and Control Law
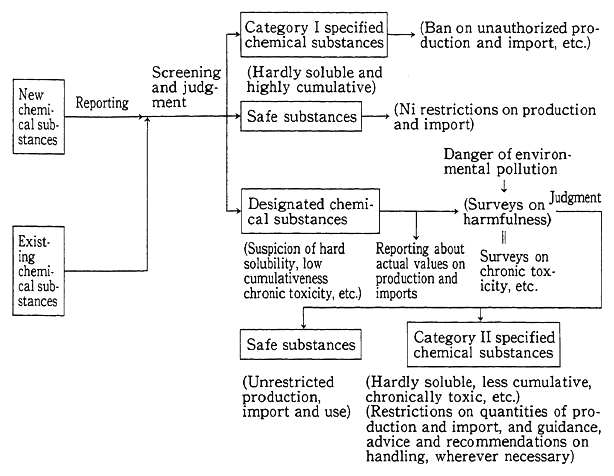
(2) General Inspections and Surveys on Safety of Chemical Substances
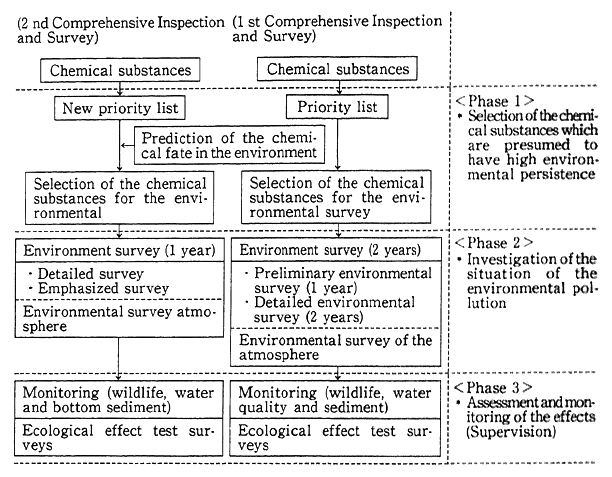
In order to efficiently and systematically survey the safety in the environment of existing chemical substances, which are said to exist in tens of thousands, the Environment Agency has performed general inspections and surveys on the safety in the environment of the First Category of Specified Chemical Substances starting in fiscal 1979 and on that of the Second Category of Specified Chemical Substances starting in fiscal 1989. This system of general inspections and surveys is outlined in Fig. 5-6-2.
In fiscal 1991, environmental surveys on chemical substances, tests on ecological impacts, the monitoring of water and sediment quality and monitoring of organisms were conducted. In addition, related surveys and studies on the structure/ activity correlations of chemical substances and other surveys and studies, the development of measures and methods for the comprehensive assessment of pollution by each environmental medium, the updating of information about environ-mental chemical substances, and comprehensive measures to be taken in accidents caused by environmental pollution.
Fig. 5-6-2 Outline of Comprehensive Safety Inspection and Survey System on Chemical Material Environment
Also as regards pollution by dioxin, the Environment Agency performed emergency surveys on actual emissions from pulp plants with the cooperation of related ministries and agencies in fiscal 1990 and released the findings in November 1991. According to the findings, the waste water discharged from factories top contained dioxins, originat-ing from the pulp bleeding process, and the gas exhausted from waste water treatment and sludge incineration and other plants included dioxins, originating from incineration. But it was concluded that air pollution and the contamination of fish and shellfish around pulp plants were not significantly higher than in general areas, and as things stood, they were not present the levels which would harm human health. Nonetheless, from the standpoint of preventing dioxins from being discharged into the environment, it was pointed out that there was the need to curb their release as much as possible. In response, related industries were asked to further promote measures against dioxins associated with paper and pulp plants.
(3) International Cooperation in Measures against Chemical Substances
International cooperation in measures against chemical sub-stances occurs with the OECD, WHO, UNEP, ILO and other interna-tional institutions in addition to positive attempts by individual coun-tries.
Japan has participated in the domestic institutionalization of the OECD-adopted GLP and performed work on the assessment for Japan of methods to assess and test ecological impacts, studies for the compre-hensive assessment of the safety of chemical substances, and collected and analyzed information about the safety of chemical substances both at home and abroad.
5-6-2 General Inspections and Surveys on Safety of Chemical substances
(1) Environmental Surveys
Environmental surveys (water system) were conducted on the water and the bottom in 55 areas across the nation and on fish in 49 areas. In 54 of them across the nation, surveys were performed on aniline, 3-nitrofluoranthene and 1-nitropyrene as priority survey sub-jects. In addition, anisidine, chloroanilines and 17, other substances were surveyed in eight to 31 districts. As a result, eight of 22 substances, including aniline and diphenylamine, were detected. Aniline, chlor-oaniline and eight other substances were detected from the bottom, and aniline, o-chloroaniline and three other substances were detected in fish. (Table 5-6-1) The findings indicate that the frequency of detection was high for aniline in the water, the bottom or fish, and that the frequency of detection was also higher for chloroanilines in the ,water and the bottom as against its output. Though they were not immediately likely to pose questions, it was concluded that it would be important to perform environmental surveys at a certain interval and keep an eye on change in their detection.
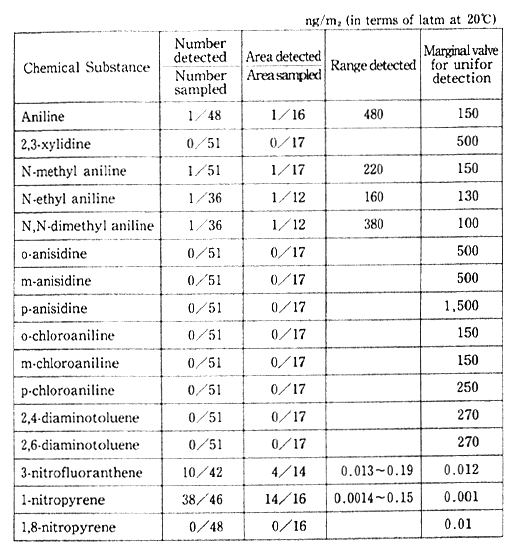
Environmental surveys on the atmosphere were conducted for 16 substances in 17 districts across the nation, and the findings were given in Table 5-6-2.
Table 5-6-1 Resultes of the Preliminary Enviranment Survey and the Detailed Environment environment Survey (FY 1990)
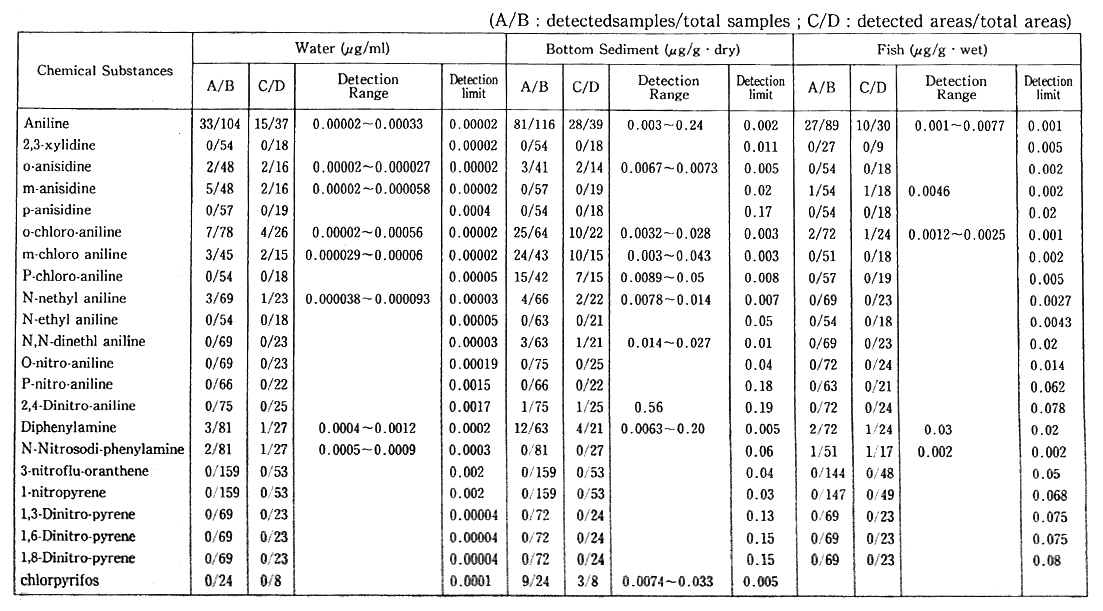
Table 5-6-2 Findings of Air Environment Survey (FY 1990)
(2) Outline of GC/MS Monitoring of Water and Sediment
In fiscal 1990, the GC/MS monitoring of the water and the bottom was conducted for 19 substances in 18 districts across the nation (Table 5-6-3). As a result, p-chlorobenzane and seven other substances were detected from the water and excluding dieldrin, 18 substances were detected from the sediment.
Table 5-6-3 Results of the GC/MS Monitoring Concerning Water and Bottom Sediment (FY 1990)
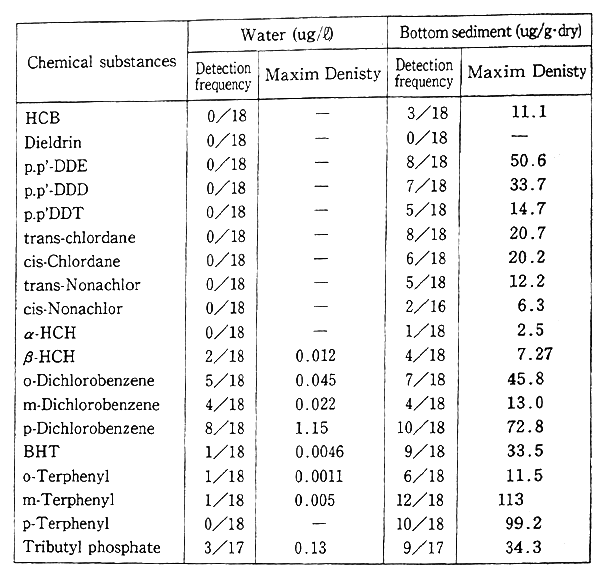
When it came to the number of substances detected from the water by survey area, no substances were detected in nine areas, and the number of substances detected from the water in other areas was small as a whole with 1-6 substances. The levels of detection from the bottom was generally higher than from the water, and in terms of the highest values of each survey subject, the levels of pollution were high for closed bays.
(3) Outline of Biological Monitoring
Biological monitoring is so designed that in regard to chemical substances whose careful surveillance is required to prevent evolution of the First Category of Specified Chemical Substances and environmental pollution under the Chemical Substance Examination and Regulation Law, secular surveillance over environmental pollution will be made for organisms (fish, shellfish and birds) in 18 areas across the nation. In fiscal 1990, 30 substances were surveyed. An outline isgiven below:
Despite a ban on their use, they remain widely in the environment so that it is necessary to follow up on them.
(A) PCB, Chlordane
Though their use is suspended, they remain widely in the environ-ment, and it is necessary to continue follow-up studies.
(B) Tributyl Tin Compounds
Tributyl tin compounds remain widely in the environment, at relatively constant levels. Though it is unlikely that the prevailing levels of pollution would immediately reach dangerous proportions, high concentration are observed for some compounds so that it is necessary to maintain surveillance of the pollution conditions and promote mea-sures against pollution.
(C) Triphenyl Tin Compounds
The conditions of environmental pollution are broadly observed, and the levels of concentration detected from organisms are particularly high, generally remaining steady. In light of the present output of triphenyl tin compounds, it is necessary to continue surveillance over the conditions of pollution and promote measures against it.
5-6-3 Outline of Studies and Surveys on the Possibility of Specified Chemical Substances Remaining in the Environment
Studies and surveys on the possibility of specified chemical substances remaining in the environment have been performed since fiscal 1988 to understand the status of specified chemicals remaining in the environment under the Chemical Substance Examination and Regu-lation Law. In fiscal 1990, they were conducted on nine substances, on the water and the bottom in 32 areas and the atmosphere in 30 areas.
5-6-4 Outline of Environmental Surveys on Unintentionally Created Chemical Pollutants
The Environment Agency has been conducting surveys to under-stand the actual state of environmental pollution by unintentionally created chemical pollutants through natural or artificial processes, (such as dioxin), since fiscal 1985.
In fiscal 1990, environmental surveys were carried out on diox-ins [general appellation with polychlorodibenzo-p-dioxin (PCDD) and polycholorinated dibenzofuran (PCDF)], the nitro groupreducing prod-ucts of CNP, which is described as replaced into the amino radical of chloronitrofen (CNP) and remaining in the rice field soil, and coplanar PCBs whose structure is flat (without chlorine replaced into the ortho position). The findings are outlined below:
(A) Dioxins
As things now stand, it is not thought possible that dioxins bring about damage on man's health, but they are detected, although their concentration is low, so that there is the need to follow up on, and continue surveillance over, the conditions of pollution in the future. It is also necessary to cast light on sources for the creation of dioxins and their behavior in the environment, among others, and to strive for the collection of findings on toxicity.
(B) CNP and CNP orthosubstitution chloride
As regards the bottom quality, the frequency of detection and the levels of concentration are low with the exception of nitro group reducing products of CNP for which the frequency of detection is high. Though it is inconceivable now that damage will be brought about on man's health, it is necessary to continue surveys in fiscal 1991 and clarify the conditions, as the nitro group reducing products of CNP is frequently detected from the bottom.
(C) Coplanar PCBs
It is thought that the remaining coplanar PCBs in the environ-ment stems from discharge of PCB products into the environment. The use of PCBs was prohibited in 1972, and the proliferation of pollution is less likely, but as the frequency of detection was small in the latest survey, there is the need to survey the conditions of pollution also in fiscal 1991.
5-7 Environmental Conservation Measures in Land Utilization
5-7-1 Suitability of Land Utilization
The National Land Use Plan is formulated to assure a stable and balanced long-term utilization of the national land, while priority is given to public welfare and efforts are mad for conservation of the natural environment. It serves as an administrative guideline for utiliza-tion ofthe national land.
The system of programs for utilization of the national land consists of a national program (amended in December 1985), prefectural programs (revised in 46 prefectures as of the end of Decem-ber 1991) and municipal program (formulated by 597 cities, towns and villages as of th end of 1991).
Basic land utilization programs, based on programs for utiliza-tion of the national land, are formulatcd by prefectural governors, by which five areas are designated, and land utilization is adjusted. They function to make comprehensive adjustments among the variety of programs formulated under the City Planning Law, the Natural Parks Law and other individual laws, directly serving as regulatory standards on acts of land transactions and indirectly serving as regulatory stan-dards for acts of development.
The designation of five areas under the basic land utilization program (as of the end of March 1991) is follows:
Urban areas about 9,540,000 hectares
Agricultural areas about 7,360,000 hectares
Fore st ar as about 25,560,000 hectares
Natural park areas about 5,340,000 hectares
Nature conservation areas about 90,000 hectares
Other areas (those not included in the 5 years) about 240,000 hectares
5-7-2 Legitimatization of Location of Factories
For drastic solutions to industrial pollution, there is the need to justify the location of factories. For this purpose, the location of new plants in major urban areas is regulated under the Law Concerning Restrictions on Factories in Existing Urbanized Areas of the National Capital Region, and attempts are made to move factories under the Industrial Relocation Promotion Law.
To promote such legitimazation of their location, projects for the development of core industrial park by the Regional Promotion and Development Corporation, the system of subsidizing costs for the pro-motion of industrial relocation is in effect, loans are advanced by the Bank of Japan and other institutions, and systems of grants-in-aid are enforced by the Environmental Pollution Control Service Corporation, to which reference has been made earlier, and by the Small Business Promotion Corporation.
5-7-3 Development of Green Buffer Zones
For the prevention of pollution, it is necessary to construct buffer zones to separate areas where pollution is caused by factories and where accidents and disasters occur, from the general urban area. For this purpose, the Ministry of Construction subsidizes local governments and the Japan Environment Corporation, and the Japan Environment Corpo-ration develops, constructs and sells green buffer zones.
Also, the Ministry of Construction has developed green buffer zones around Osaka International, Fukuoka and five other airports. Project outlays amounted to Y6.3 billion in fiscal 1991.
5-8 Public Information on, and Education in, Environmental Conservation
5-8-1 Public Information
(1) General Public Information
Whereas public information activities were done through a wide variety of media, the public information journal "Kankyo" (Environment) was distributed, and the public information movies pre-pared by the Environment Agency were lent out.
(2) Execution of 'Environment Month' Events
The one month period around the World Environment Day on June 5 is designated as "Environment Month," and a wide variety of events, including the environmental exhibition "Eco-Life Fair" and Gatherings in the Environment Month, is carried out in attempts to enhance the people's consciousness about environmental problems. And 23,000 trees were planted at 174 places across the nation to disseminate thought about greening.
Also in order to step up an environmental beautification cam-paign, the Environment Agency, the Ministry of Health and Welfare and other government institutions took the lead in calling on local govern-ments to designate an Action Day for Environmental Beautification.
5-8-2 Environmental Education
(1) Environmental Education in General
In order to cope with increasingly compliated and diversified environmental problems, there are calls for each one of the people to deepen his or her understanding about and promote life and action of the sort in which consideration is given to the environment, and it is all the more necessary to promote environmental education.
The Environment Agency and the Ministry of Education have agreed to establish close liaison for the promotion of environmental 1 education. The Environment Agency has produced television programs and motion pictures, held study meetings on environmental education and distributed t aching materials. the agency has also held symposia on visions for environmental conservation, symposia on environmeutal educations and symposia on comfortable environments.
The agency also intends to support environmental education projects for which the Local Environment Conservation Fund, estab lished in fiscal 1989, in administrative ordinance designated cities.
(2) School Education in Environmental Conservation
As regards school education in environmental conservation. guidance has been provided for years, centering on the social, television. health and physical education course In March 1989, the Operating Procedures for Guidance on Learuing for primary, middle aud high schools were amended in attempts to further replenish the contents of guidance on the environment. Started in fiscal 1990 was the preparation of guidance materials for teachers. Furthermore, symposia on environ-mental education and study meetings have been held since fiscal 1991 to enhance the quality of teachers in environmental education.
5-8-3 Promotion of Environmental Conservation Activities
(1) General Activities To Conserve the Environment
As the interest in environmental problems is on the rise, there is the need to replenish environmental conservation activities both in communities and businesses, such as the development of social condi-tions for environmental conservation activities and the offer of proper information.
For this purpose, the Environmental Agency held the Environ-mental Conservation Leaders' Study Meeting in Sendai in fiscal 1991 and took support measures, such as an exchange of information, with the use of the Local Environment Conservation Fund.
The agency also conducted surveys to come to grips with the actual conditions of corporate environmental conservation activities and carried out guidance and upbringing projects on the Eco Mark system to promote the production and consumption of merchandise.
(2) Promotion of Recycling Activities
Given the enactment of the Law Concerning the Promotion of the Utilization of Renewable Resources and the revised Waste Disposal and Public Cleansing Law, there is the need to work for a further encourage-ment of recycling activities.
For this purpose, starting in 1991related ministries and agencies designated October as Recycling Promotion Month, and held a wide variety of symposia and activities for dissemination and enhancement.
The Environment Agency prepared and distributed various pam-phlets, video tapes, other materials for dissemination and enhancement. The agency also performed surveys to come to find out where the offer of information and so on in municipalities stand. Furthermore, the Ministry of Health and Welfare established a new system of subsidizing measures to promote making trash lighter in weight. Under this system, the ministry subsidized the establishment of routes for the conversion of trash into resources and efforts to organize groups for this purpose. The ministry also conducted a wide variety of enhancement activities to promote making waste more light in weight and recycling.
(3) Prevention of Empty Can Litter
The output of canned drinks has rapidly increased. Output rose to more than 29 billion cans a year in fiscal 1990 from the 800 million cans or so in 1970. Some of them were littered on roads and seacoasts, in rivers and at other places, posing problems in terms of environmental beautification. The findings of a survey performed by the Environment Agency in 1991 reveals that the littering of empty cans has leveled off in recent years.
To prevent the littering of empty cans, some local governments recover them in a system in which coupons will be handed out which may be exchanged with book coupons when they reach the specified number or in a deposit system. In addition, ordinances are established, operating procedures and other measures are created and campaigns are conducted to prevent the discarding of empty cans and the reinforce-ment of cleaning. At the national level, attempts are being made to replenish activities for dissemination and enhancement according to an agreement reached at the Liaison Council on the Problem of Empty Cans which is made up of 11, related ministries and agencies. Besides, the Environment Agency and the Ministry of Health and Welfare call on local governments to designate an Action Day for Environmental Beautification with a view to promoting positive actions on the part of a broader segment of the people.
5-9 Understanding Conditions at Local Environment
Efforts are being made to understand local environmental infor-mation and the people's views and demands with the collection of information from environmental monitors (1,500 persons commissioned across the nation) and through administrative consultation.
Chapter6. Air Pollution, Noise, Vibration and Offensive Odors--Present State and Measures
6-1 Present State of Air Pollution
According to the data given by continuous monitoring stations established across the nation, the conditions of air pollution, as classi-fied by pollutant, are as follows:
(1) Sulfur Dioxide
a. Changes in Annual Average
(a) Air pollution Monitoring Stations
Data on sulfur dioxide in fiscal 1990 were provided by 1,062 effective air pollution monitoring stations (excluding road-side air pollution monitoring stations) in 672 municipalities and by 1.062 effec-five monitoring stations (by "effective monitoring station," it means a monitoring station where monitoring is done for more than 6,000 hours a year).
Changes in the simple mean of annual average values, at 15 air pollution monitoring stations which have been in operation since fiscal 1965 are given in Fig. 1-1-3, Part 1.
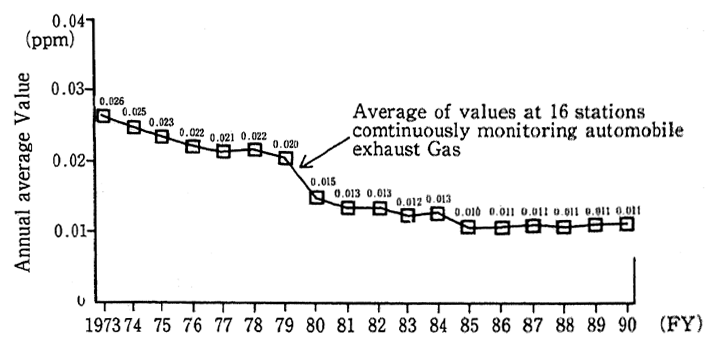
Fig. 6-1-1 Year Specific Trends in Simple Mean of Annual Average Values of IOU Dioxide
(b) Road-side Air Pollution Monitoring Stations
As regards road-side air pollution monitoring stations, fiscal 1990 data were provided 69 effective monitoring stations in 57 municipalities. Changes in the annual average concentration registered by 16 monitor-ing stations which have been in operation since fiscal 1973 are depictedin Fig. 6-1-1, suggesting that the average have generally been falling.
b. Achievement of Environmental Quality Standards--Changes and Present State
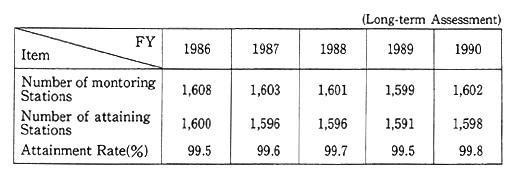
(a) Compliance with Environmental Quality Standards Based on the Long-Term Criteria
In the long-term criteria of environmental quality standards, it is stipulated that the cases where the daily average values throughout the year (excluding those which come within a range of 2% from the measured highest value) do not exceed 0. 04 ppm and where the daily average value does not exceed 0.04 ppm for every two consecutive days are considered as satisfying environmental quality standards. For example, the value of interest here would be the daily average value on the eighth day after excluding those on the seven days from the highest value in cases where there are measured values for 365 days throughout the year.
Changes in the compliance with environmental quality standards on the basis of long-term criteria have been leveling off in the last several years, as indicated in Table 6-1-1.
Table 6-1-1 Attainment of Environmental Quality Standards
(General stations)
(b) Compliance with Environmental Quality Standards Based on the Short-term Criteria
The ratio of air pollution monitoring stations with a daily aver-age value of less than 0.04 ppm on all effective monitoring days to effective monitoring stations stood at 97.6% in 1989 and 98.9% in 1990. The ratio of monitoring stations with an hourly value of less than 0. 1ppm in every monitoring hour, to effective monitoring stations fluctu-ate at high level, standing at 94.1% in 1989 and 96.0% in 1990.
The ratio of road-side air pollution monitoring stations with the daily average value of less than 0.04 ppm on all effective monitoring days to effective monitoring stations stood at 84.6% in 1989 and 88.2% in 1990. The rate of monitoring stations with an hourly value of less than 0.1 ppm in every monitoring hour to effective monitoring stations fluctuate at high level, standing at 92.3% in 1989 and 94.1% in 1990.
(2) Nitrogen Dioxide
a. Changes in Annual Average
(a) Air Pollution Monitoring Stations
Monitoring data on nitrogen dioxide in fiscal 1990 were secured at 1,367 effective monitoring stations in 636 municipalities..
Secular changes in the simple mean of annual average values recorded by 15 monitoring stations (which have continued monitoring since fiscal 1970) are shown in Fig. 1-1-1. Chapter 1, Part 1. Though there had been signs of a drop since fiscal 1969, the mean began to rise in fiscal 1986. coming to 0.028 ppm in fiscal 1990 as was the case with fiscal 1989.
(b) Road-side Air Pollution Monitoring Stations
Data on nitrogen dioxide in fiscal 1990 were secured at 318 effective monitoring stations in 182 municipalities.
Secular changes in the simple mean of annual average values recorded by 21 monitoring stations which have been in operation since fiscal 1971, are shown in Fig. 1-1-1,
b. Achievement of Environmental Quality Standards
As regard the environmental quality standard associated with nitrogen dioxide, it is stated in the revision specified by the Environment Agency Notification No.38 in July 1978 (hereinafter referred to as the "Notification") that "the daily average of hourly values shall be within or less than a range of 0.04 ppm to 0.06 ppm." It is stipulated that efforts shall be made to arrive at 0.06 ppm within 7 years (2-1 the Notification) in areas where the daily average exceeds 0.06 ppm, in principle, and that in areas where the daily average is in a range of 0.04 ppm to 0.06 ppm, efforts shall be made to maintain the present level or a level around it within this range or not to significantly exceed it, in principle" (2-2 the Notification).
A comparison with environmental quality standards for nitrogen dioxide by the daily average value equivalent to 98% from the lowest throughout the year (hereinafter referred to as "annual 98% value of the daily average") for 1,367 effective air pollution monitoring stations indicates, as shown in Fig. 1-1-2, Chapter 1, Part 1, that 6.3% of all the stations exceeded the standard in fiscal 1990. high than the 4.8% record-ed in fiscal 1989.
As for Road-side Air Pollution Monitoring Stations, annual 98% value of daily average exceeds 0.06 ppm in 1.12 stations (35.7%). which concentrate in urban area such as Tokyo, Osaka and Kanagawa prefec-ture.
c. Trends for areas whose Nitrogen Dioxide concentration level is in 0.04-0.06 ppm specifiedAAby environmental quality standard
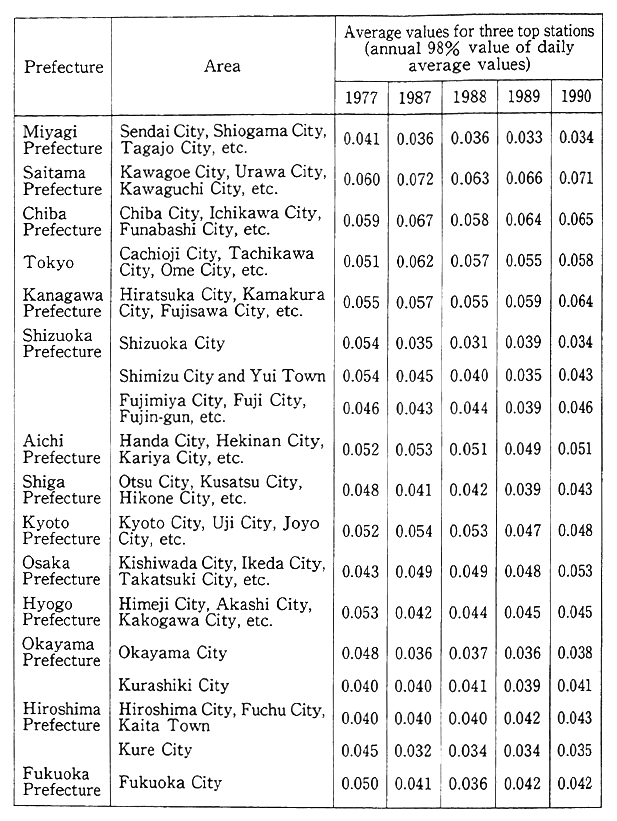
Recent trends in concentrations in areas with the daily mean, (associated with environmental quality standards for nitrogen dioxide), within the range of 0.04 ppm to 0.06 ppm are given in Table 6-1-2 with the data of fiscal 1977 through 1990, when the standards were specified in theEnvironment Agency's Notice No. 2-2.
Table 6-1-2 Trends in Nitrogen Dioxide Concentration in Areas Within a Range of Daily Average Values from 0.04ppm to 0.06ppm
Remarks:1. Surveyed by the Environment Agency.
2. Areas with increases 3areas Areas virtually with the present levels. l5areas
However, the areas with more than 0.06ppm are counted as areas with increases.
d. Nitrogen Monoxide
(a) Air Pollution Monitoring Stations
Data on the monitoring of nitrogen monoxide in fiscal 1990 were secured at 1,365 effective monitoring stations in 636 municipalities.
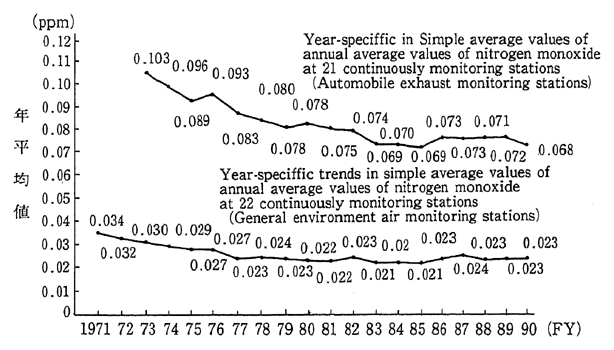
Secular changes in the simple mean of annual average values at 28 monitoring stationswhich have continued monitoring since fiscal 1971 are shown in Fig. 6-1-2. The changes have roughly leveled off in the last 10 years.
Fig. 6-1-2 Year-spacific Trends in Simple Average Values of Annual Values of Nitrogen Monoxide
Remarks:1. Surveyed by the Environment Agency.
2. Oxidization rate=70%.This rete is also used later.
(b) Road-side Air Pollution Monitoring Stations
Data on the monitoring of nitrogen monoxide in fiscal 1990 were secured at 318 effective monitoring stations in 182 municipalities.
Secular changes in the simple mean of annual average monitoring stations (the same as in the case of nitrogen dioxide) which have been in operation since fiscal 1973 are shown in Fig. 6-1-2.
(3) Carbon Monoxide
a. Road-side Air Pollution Monitoring Stations
Data on the monitoring of carbon monoxide in fiscal 1990 were secured at 315 effective monitoring stations in 186 municipalities.
(a) Trends in Annual Means
Secular changes in the simple mean of annual average value at 14 monitoring stations which have been in operation since fiscal 1971 are indicated in Fig. 1-1-6, Chapter 1, Part 1.
(b) Achievement of Environmental Quality Standards
In the long-term criteria of environmental quality standards, it is stipulated that the cases where the daily average values throughout the year excluding those which come within a range of 2% from the highest value do not exceed 10 ppm and where the daily average value does not exceed 10 ppm for every two consecutive days are considered as satisfy-ing environmental standards.
In the long-term criteria of environmental quality standards, it is stipulated that the cases where the daily average value does not exceed 10 ppm and where 8 hours' average value does not exceed 20 ppm are considered as satisfying environmental standards.
All 309 effective road-side air pollution monitoring stations have recorded compliance with the environmental quality standards, both on long-term and short-term criteria.
b. Air Pollution Monitoring Stations
Data on the monitoring of carbon monoxide in fiscal 1990 were secured by 186 effective monitoring stations in 158 municipalities. All stations satisfied the environmental quality standards, both on long-term and short-term criteria.
(4) Photochemical Oxidants
a. Findings of Monitoring of Photochemical Oxidants in Fiscal 1990
Data on the monitoring of photochemical oxidants were observed in 1,056 Air Monitoring Stations in 573 municipalities and in 39 Road-side Air Monitoring Stations in 25 municipalities.
The frequency with which photochemical oxidants appear is significantly affected by meteorological conditions, so that there is a rise irregular or drop, depending on the year. But it drastically increased in fiscal 1990 compared to in fiscal 1989. As for 973 Air Monitoring Stationsand 36 Road-side Air Monitoring Stations where the photo-chemical oxidants were monitored continuously since 1986, the average number of days per monitoring station with concentrations above the warning issuance level (0.12 ppm in terms of hourly value) is shown in Table 6-1-3.
Table 6-1-3 Trends in Average Number of Days with Concentrations Requiring Issue of Warnings (General Stations)

Remarks:1. Surveyed by the Environment Agency.
2. The Tokyo Bay area consists of Tokyo and six prefectures including Ibaraki, Tochigi, Gunma, Saitama, Chiba and Kanagawa.
3. The Osaka Bay area consists of Kyoto Prefecture, Osaka Prefecture, Hyogo Prefecture and Nara Prefecture.
4. The values in the table are computed by dividing the total number of days when the concentration exceeded at coninuously monitoring stations by the number of continuously monitoring stations.
b. Issuance of Warnings on Photochemical Oxidants in 1992
(a) Issuance of Warnings
The number of days in 1991 when a warning on photochemical oxidants was issued (this warning is issued when the hourly average of photochemical oxidants concentrations is 0.12 ppm or higher and that the pollution is considered to continue further in view of the meteorolog-ical condition at that time) was 121 in the aggregate, covering 15 prefectures. This suggests that the number of days dropped in half from the 242 in 1990 (in 22 prefectures). This number in fiscal 1991 is virtually the same as in 1983 (131 says) and 1984 (135 days) (Table 6-1-4).
Table 6-1-4 Trends in Aggregate Total of Days with Warnings Issued and in Number of Person Reporting about Damege

Remarks: Surveyed by the Environment Agency.
The monthly breakdown of the aggregate total number of days when warnings were issued were one day in April, seven days in May, 39 days in June, 53 days in July, eight days in August and 13 days in September, suggesting that the issuance is more frequent in June and July.
Incidentally, the highest concentration of photochemical oxidants when warnings were issued in 1991 was 0.247 ppm. No photochemical oxidants alarm was issued however they will be issued, in general, when the hourly average of photochemical oxidants concentrations is 0.24 ppm or higher and that the pollution is considered to continue further in view of the meteorological condition at that time, although different criteria are applied by the local government.
(b) Regional Breakdown of Warnings Issued
The regional breakdown of the total number of days when warnings were issued in 1991 were 87 days in the Tokyo Bay Region (Ibaragi, Tochigi, Gunma, Saitama, Tokyo and Kanagawa Prefecture) and 12 days in the Osaka Bay Region (Kyoto, Osaka, Nara and Hyogo Prefecture). Those two regions accounted for about 82%.
(c) Number of Sufferers
The number of reported sufferers from photochemical air pollu-tion in 1991 (persons voluntarily reporting due to subjective symptoms) was 1,454 persons, far greater than the 58 persons in 1990, which was the third smallest figure ever recorded. In terms of the last 10 years, it was the third largest figure, following 1983 (1,721 persons) and 1984 (5,822 persons).
(5) Non-methane Hydro carbons
As regards the monitoring of hydro carbons, it is stipulated on the basis of a guideline made by the Central Council for Environmental Pollution Control that non-methane hydro carbons (NMHC) shall be monitored, and that the concentration of NMHC, shall be within a range of 0.20-0.31 ppm in terms of the average of three hours between 6 a.m. and 9 a.m. The one hour value of 0.06 ppm is the environmental quality standard for photo chemical oxidant which the guideline corresponds to.
a. Air Pollution Monitoring Stations
Data on the monitoring of NMHC in fiscal 1990 were secured by 338 monitoring stations in 239 municipalities. Secular changes at six stations which have been in operation since fiscal 1978 in terms of the annual mean of average values between 6 a.m. and 9 a.m. is indicated in Table 6-1-5.
Table 6-1-5 Year-specific Trends in Simple Average Values of Annual Values of Non-methane Hydrocarbon at 6 Continuously Monitoring Stations at 6-9 O'clock

b. Road-side Air Pollution Monitoring Stations
Data on the monitoring of NMHC were secured at 156 monitoring stations in 102 municipalities.
Secular changes in the simple mean of annual average between 6 a.m. and 9 a.m. at 10 monitoring stations which have been in operation since fiscal 1977 are shown in Table 6-1-5.
(6) Suspended Particulate Matter
Data on the monitoring of suspended particulate matter in fiscal 1990 were secured at 1,282 effective air pollution monitoring stations in 622 municipalities and 157 effective road-side air pollution monitoring stations in 117 municipalities.
In the long-term criteria of environmental quality standards, cases where the highest daily average value (which excludes the highest 2% of annual monitored value in terms of daily average values) do not exceed 0.10 mg/m3 and where the daily average value does not exceed 0.10 ppm/m3 every two consecutive days, are regarded as satisfying environmental quality standards.
The percentage of compliance with the environmental quality standards based on long-term criteria has leveled off in recent years. It dropped to 43.1% in fiscal 1990 from 65.2% in fiscal 1989 (Fig. 6-1-3).
Secular changes in the simple mean of annual average value at 40 monitoring stations which have been in operation since fiscal 1974 are shown in Fig. 1-1-7, Chapter 1.
Fig. 6-1-3 Attainment of Environmental Standards for Suspended Particulate Matter (General Stations)
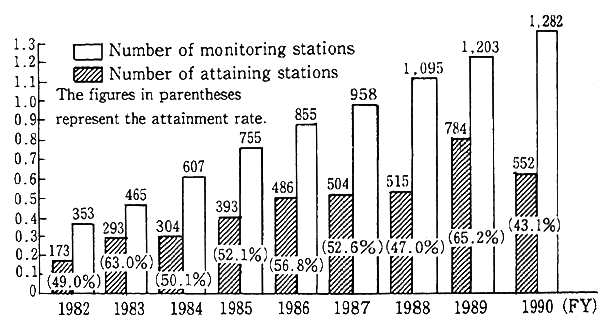
(7) Dust Fall
Of all particulate matter in the atmosphere, the types which are regarded as falling dust include soot and dust, particulate and so forth, which fall due to gravity or precipitation.
Of 1,342 monitoring points in fiscal 1990. monitoring was done at 1,290 points for more than the number of hours necessary for effective monitoring. A check of the number of monitoring points by weight of dust falls indicate that there were four points (four points in fiscal 1989) which registered 20-30 t/km3/month and nine monitoring points (eight points in fiscal 1989) which recorded above 30 t/km3/month.
(8) Other Pollutants
In recent years, attention has been focused on particulate matter in terms of not just quantity but quality, including elemental composi-tion and other factors.
In addition to the aforementioned substances which are constant-ly checked and monitored, the national air pollution monitoring stations established in the nation's major areas analyze the components of suspended particulate matter (benzene soluble matter, sulfuric radical, nitric radical, vanadium and other heavy metals, benzo(a)pyrene, etc.) collected with high volume air samplers, and the components of suspend-ed particulate matter (aluminum, barium and 29 other elements) col-lected with low-volume air samplers. The monitoring and analysis of mercury started in fiscal 1982.
As regards asbestos, mercury and organic chlorine solvents, monitoring has been conducted every other year since 1985. The findings of the surveys thus far conducted indicate that they have not reached levels where problems may occur (Table 6-1-6).