

Background Monitoring Survey for Atmospheric Mercury Concentration
FY2025 Results of Background Monitoring for Mercury in the Atmosphere and Precipitation, and other Elements in Aerosols
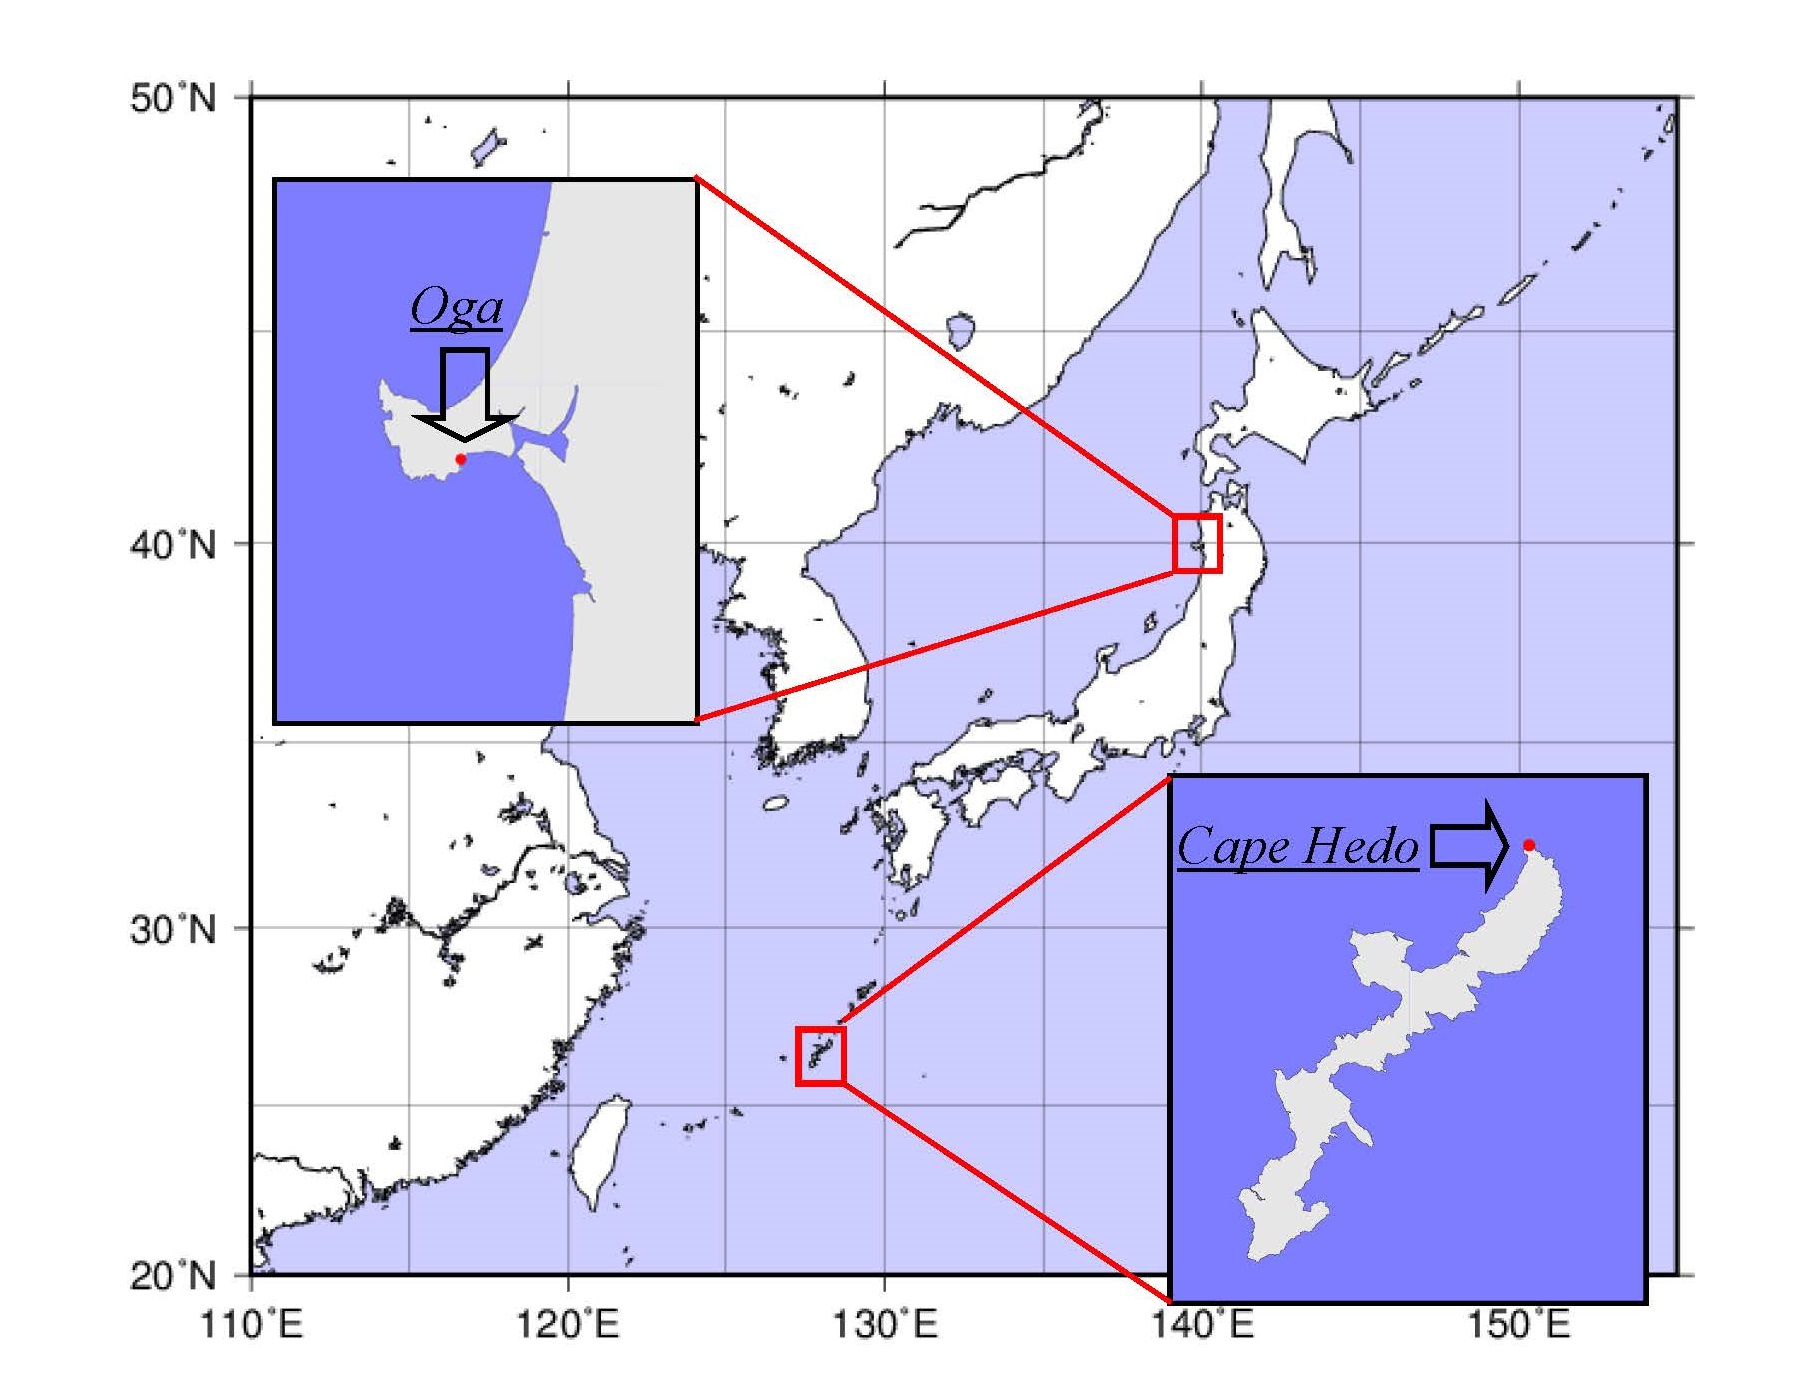
Ministry of the Environment, Government of Japan (MOEJ), has been conducting background monitoring of atmospheric mercury at Cape Hedo in Okinawa Prefecture (hereinafter referred to as Cape Hedo) and at Oga Peninsula in Akita Prefecture (hereinafter referred to as Oga), where direct effect from local emission sources is minimal.
The results of the survey in Fiscal Year (FY) 2025 (April 1st, 2025, through March 31st, 2026) indicated that mercury concentrations in atmosphere and precipitation at Cape Hedo and Oga were well below the national guideline value, and these values did not deviate significantly from those of the past survey results.
1. Overview of the Survey
MOEJ has been monitoring background concentrations of atmospheric mercury, namely Gaseous Elemental Mercury (GEM), Gaseous Oxidized Mercury (GOM), Particle-Bound Mercury (PBM), and total mercury deposited with precipitation at Cape Hedo and Oga.
In addition, 17 hazardous elements and six index elements were monitored at Cape Hedo to understand the sources, transport, and environmental fate of atmospheric mercury.
2. Summary of Survey Results
(1) Atmospheric Mercury Concentrations
Annual mean concentrations of total atmospheric mercury (the sum of Gaseous Elemental Mercury (GEM), Gaseous Oxidized Mercury (GOM), Particle-Bound Mercury (PBM)) in FY2025 were 1.5 ng/m3 at Cape Hedo and 1.5 ng/m3 at Oga, both of which were well below the guideline value established to prevent adverse health effects associated with long-term exposure to hazardous air pollutants (40 ng/m³ as an annual average).
At both sites, GEM accounted for a large portion of mercury in the atmosphere (see Tables 1 and 2, and pages 7 and 13 of the attached document for details.).
At Cape Hedo, annual mean concentration of total atmospheric mercury in FY2025 was the lowest recorded during the monitoring period. Annual mean concentrations of speciated mercury and total atmospheric mercury have remained relatively stable since FY2013 (see Table 1, and pages 9 and 10 of the attached document for details).
At Oga, annual mean concentrations of speciated mercury and total atmospheric mercury have remained relatively stable since FY2014 (see Table 2, and pages 15 and 16 of the attached document for details).
Table 1. Annual mean concentrations of atmospheric mercury species at Cape Hedo
(Unit:ng/m3) [1]
|
Measured |
FY2016 |
FY2017 |
FY2018 |
FY2019 |
FY2020 |
FY2021 |
FY2022 |
FY2023 | FY2024 | FY2025 |
|---|---|---|---|---|---|---|---|---|---|---|
|
GEM |
1.7 |
1.6 |
1.6 |
1.7 |
1.7 |
1.7 |
1.6 | 1.6 | 1.6 | 1.5 |
|
GOM |
0.002 |
0.002 |
0.002 |
0.002 |
0.002 |
0.001 |
0.001 | 0.002 | 0.001 | 0.001 |
|
PBM |
0.003 |
0.002 |
0.002 |
0.002 |
0.002 |
0.002 |
0.002 | 0.002 | 0.002 | 0.002 |
|
Total |
1.7 |
1.6 |
1.6 |
1.7 |
1.7 |
1.7 |
1.6 | 1.6 | 1.6 | 1.5 |
[1] All concentrations are expressed as the mercury-equivalent concentration of mercury and its compounds. The same applies to Tables 2 and 3.
Note: For monitoring results prior to FY2016, please refer to the attached document "FY2025 Results of Background Monitoring for Mercury in the Atmosphere and Precipitation, and other Elements in Aerosols".
Table 2. Annual mean concentrations of atmospheric mercury species at Oga
(Unit: ng/m3)
|
Measured |
FY2016 |
FY2017 |
FY2018 |
FY2019 |
FY2020 |
FY2021 |
FY2022 | FY2023 | FY2024 | FY2025 |
|---|---|---|---|---|---|---|---|---|---|---|
|
GEM |
1.6 |
1.6 |
1.6 |
1.5 |
1.6 |
1.6 | 1.5 | 1.5 | 1.6 | 1.5 |
|
GOM |
0.002 |
0.003 |
0.003 |
0.002 |
0.003 |
0.003 | 0.003 | 0.002 | 0.002 | 0.003 |
|
PBM |
0.011 |
0.009 |
0.008 |
0.006 |
0.012 |
0.006 | 0.007 | 0.007 | 0.006 | 0.006 |
|
Total |
1.6 |
1.6 |
1.6 |
1.5 |
1.6 |
1.6 | 1.5 | 1.6 | 1.6 | 1.5 |
Note: For monitoring results prior to FY2016, please refer to the attached document "FY2025 Results of Background Monitoring for Mercury in the Atmosphere and Precipitation, and other Elements in Aerosols".
(2) Mercury Concentrations in Precipitation
The annual mean concentration of total mercury in precipitation in FY2025 was 7.0 ng/L at Cape Hedo and 6.2 ng/L at Oga. At Cape Hedo, the concentration was the highest recorded since FY2016, when an improved analytical procedure for mercury concentration in precipitation was introduced. At Oga, the concentration remained within the range observed in previous years since FY2016 (see Table 3, and pages 20 and 24 of the attached document for details).
Table 3. Annual mean total mercury concentrations in precipitation at Cape Hedo and Oga
(Unit: ng/L)
|
Monitoring site |
FY2016 |
FY2017 |
FY2018 |
FY2019 |
FY2020 |
FY2021 |
FY2022 | FY2023 | FY2024 | FY2025 |
|---|---|---|---|---|---|---|---|---|---|---|
|
Cape Hedo |
6.6 |
4.8 |
3.9 |
5.6 |
5.0 |
5.3 | 5.4 | 4.0 | 5.4 | 7.0 |
|
Oga |
6.3 |
5.7 |
6.0 |
6.0 |
7.9 |
5.5 | 6.2 | 5.3 | 5.4 | 6.2 |
(3) Concentrations of Other Metal and Metalloid Elements in Aerosols
In FY2025, annual mean concentrations of chromium, manganese, nickel, arsenic, cadmium and lead in aerosols at Cape Hedo were 2.8 ng/m3, 3.4 ng/m3, 0.91 ng/m3, 0.79 ng/m3, 0.055 ng/m3 and 1.5 ng/m3, respectively (see Table 4). The concentrations of manganese, nickel and arsenic were significantly lower than the guideline values for hazardous air pollutants to reduce health risks (guideline values as annual mean: manganese 140 ng/m3, nickel 25 ng/m3 and arsenic 6 ng/m3).
The annual mean concentrations of chromium, manganese, nickel, arsenic, cadmium and lead remained within the range observed in previous years.
Table 4. Annual mean concentrations of metal and metalloid elements in aerosols at Cape Hedo
(Unit: ng/m3) [2]
| Measured item |
Guideline value |
FY2016 | FY2017 | FY2018 | FY2019 | FY2020 | FY2021 | FY2022 | FY2023 | FY2024 | FY2025 |
|---|---|---|---|---|---|---|---|---|---|---|---|
|
Chromium |
N/A |
0.65 |
0.91 |
1.8 |
2.1 |
4.3 |
2.5 | 3.9 | 3.6 | 3.0 | 2.8 |
|
Manganese (Mn) |
140 |
2.9 |
4.0 |
4.9 |
3.7 |
4.2 |
3.0 | 2.9 | 3.8 | 2.3 | 3.4 |
|
Nickel |
25 |
0.74 |
0.98 |
0.97 |
0.86 |
1.0 |
0.76 | 0.90 | 1.1 | 0.89 | 0.91 |
|
Arsenic |
6 |
0.73 |
0.73 |
0.70 |
0.66 |
0.61 |
0.43 | 0.51 | 0.65 | 0.56 | 0.79 |
|
Cadmium |
N/A |
0.13 |
0.11 |
0.096 |
0.083 |
0.067 |
0.052 | 0.057 | 0.062 | 0.049 | 0.055 |
|
Lead |
N/A |
3.1 |
2.9 |
2.7 |
2.1 |
1.8 |
1.3 | 1.4 | 1.6 | 1.2 | 1.5 |
[2] Concentrations are expressed as the metal-equivalent concentrations of each element and its compounds.
Note: Guideline values are those established by the Government of Japan for hazardous air pollutants to reduce health risks.
3. Future Actions
MOEJ will continue long-term background mercury monitoring survey to contribute to understand international mercury emissions and global trend of mercury concentration and their potential impacts on the environment in Japan.
Under the supervision of experts, the monitoring results will continue to be published regularly.
Furthermore, in order to contribute to the effectiveness evaluation of the Minamata Convention on Mercury, MOEJ will make the monitoring data widely available and share internationally the technical knowledge accumulated to ensure accuracy and precision of measurement.
.
■ Appendix 1 Overview of the monitoring sites
Overview of the monitoring sites
|
Site |
Cape Hedo Atmosphere and Aerosol Monitoring Station (CHAAMS) |
|---|---|
|
Address |
Naganehara 1000, Ginama, Kunigami-son, Kunigami-gun, Okinawa |
|
Location |
26.87°N, 128.25°E |
|
Overview |
CHAAMS is a monitoring station established and operated by the National Institute for Environmental Studies, Japan, for aerosols and gases monitoring in the atmosphere in order to investigate transboundary air pollution.
|
|
Site |
Oga Peninsula Monitoring Station |
|---|---|
|
Address |
3-2 Izumidai, Funagawaminato-funagawa, Oga-shi, Akita |
|
Location |
39.89°N, 139.85°E |
|
Overview |
Oga Peninsula monitoring station was established adjacent to Funakawa Ambient Air Pollution Monitoring Station operated by Akita Prefecture. |
■ Appendix 2. Sampling and analytical methods for different forms of mercury and other metal elements in atmosphere
|
Component
|
Measurement items |
Sampling and analytical |
Site |
|
|---|---|---|---|---|
|
Atmosphere |
Mercury |
Mercury forms |
Continuous measurement with Tekran® mercury speciation system |
Cape Hedo and Oga
|
|
Particulate |
17 hazardous elements |
7 days continuous sampling by using |
Cape |
|
|
6 index elements |
||||
| Precipitation | Mercury | Total Hg | Sampling by using an automatic wet-only sampler and analyzed by CVAAS (EPA method 1631, Revision E) | Cape Hedo and Oga |