

Chapter I -2 :Quality of the Environment in Japan 1997
Chapter I: How to Tackle the Global Warming Issue
2. The Measures to Reduce Greenhouse Gasses
State of the World's Greenhouse Gas Emissions
CO2 Emission of the World (1994)
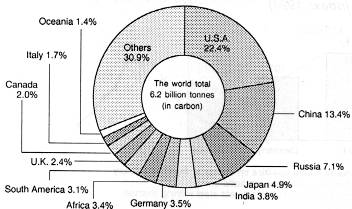
Source: Oakridge National Laboratory (U.S.A.)
Among the artificially emitted greenhouse gasses, CO2 is the gas that contributes most significantly to global warming. The CO2 emissions from within Japan amount to about 5% of the world's total emissions, and the figure from Japan is significantly bigger than the emissions from the whole of the African continent (approximately 3.4% of the global total) and from the whole of the southern American continent (approximately 3.1% of the global total).
The global emissions level has increased dramatically since World War II, and the current emissions level is 4 times bigger than that of 1950. As for the CO2 emission level per capita, Japan's level is about a half that of the United States and higher than the average level of the European Union countries. It is about 4 times greater than China's level, and about 10 times higher than India's. Developed nations' CO2 emission per capita is about 5.5 times higher than in developing nations.
Some reasons for the relatively small CO2 emission level per capita in Japan compared to those in developed nations are:
- 1) advanced energy saving technology at factories and business establishments.
- 2) less energy demand for heating due to Japan's mild climate.
- 3) the high proportion of mass goods that are transported by ship due to Japan being an island nation.
Changes in the World's CO2 Emission Level
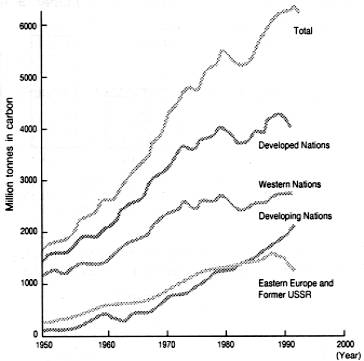
Source: Oakridge National Laboratory (U.S.A.)
CO2 Emission per Capita
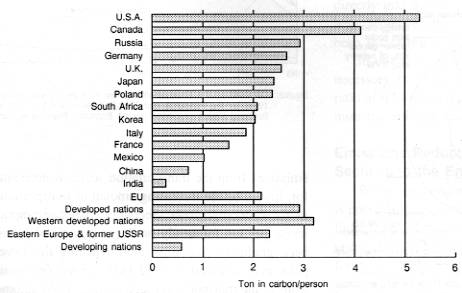
Source: Compiled by the Environment Agency from estimated figures from the Oakridge National Laboratory (U.S.A.) and "World's Statistics 1997" by the Management and Coordination Agency
State of Japan's Greenhouse Gas Emissions
About 95% of Japan's contribution towards global warming comes from CO2 emissions (except for CFCs), and 91.7% of these CO2 emissions derives from energy consumption. The CO2 emissions resulting from energy consumption have been increasing in recent years, especially in the residential/commercial/institutional sectors. The increase in emissions from the transportation sector is accounted for, firstly, by the increasing amount of transportation as the economy grows. Secondly, fuel consumption levels per km for newly produced automobiles have been gradually increasing after reaching the lowest point ever recorded in 1982 (87% of the CO2 emissions in the transportation sector comes from automobile exhaust).
One of the reasons for the substantial increase in the levels of CO2 emissions from the residential/commercial/institutional sector are the spread of energy consuming appliances and the insignificant improvements in energy efficiency of these devices in recent years.
International Comparison of Energy Consumption in Steel Industry
(Japan = 100 index: 1994)
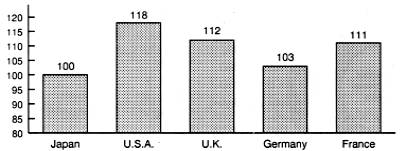
Source: Compiled by the Japan Iron and Steel Federation from statistics on energy in the steel industry.
- Notes :
- 1. The figures do not include energy for ferroalloy and coke production.
- 2. Figures are adjusted taking into account of energy used in different steel refining method.
- 3. The figure for the United States is from 1991.
International Comparison of Household Energy Consumption
(Percentage of Each Energy Use) 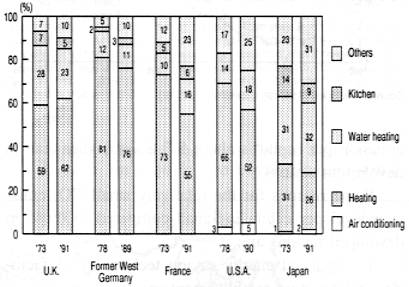
Note :For the U.S. figures, energy for heating is included in "others."
Source :The Institute of Energy Economy, Japan
"International Comparison of Household Energy Saving"
CO2 Emissions in Different Sectors in Japan (1994)
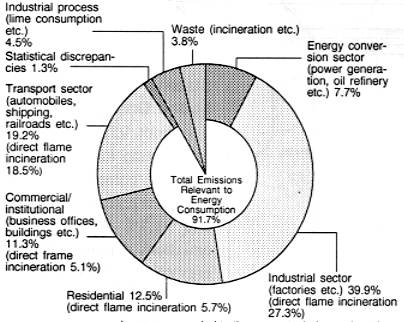
- Notes :
- 1. The total shares are rounded to the nearest whole number, therefore do not exactly correspond with one another.
- 2. The percentages are of the total amount of CO2 emission.
- 3. Emissions from power generation (29.4% of the total emissions) have been divided according to the amount of power used in each sector. The rates are indicated as (rate in each sector) - (direct flame incineration). However, in the industrial sector, consumption of lubricant (0.4%) is included.
Changes in Japan's GDP and CO2 Emissions
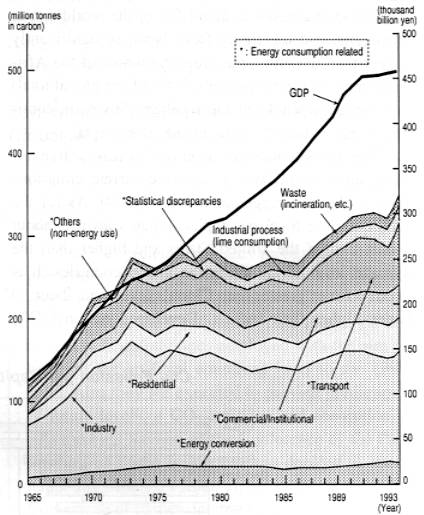
Source: Compiled by the Environment Agency from the "Energy Balance 1996" by the Resource and Energy Agency and the "National Economy Report 1955-1994" by the Economic Planning Agency
Trends in the Average km/litre of Petrol Fuelled New Japanese Cars
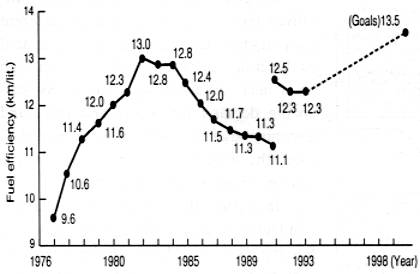
Note :1976-1991: 10 mode km/litre
1991- : 10.15 mode km/litre
Source :Compiled by the Environment Agency from the
"Transport related Energy Survey" published by the Ministry of Transport
Number of Automobiles Owned per 1000 People
in Different Countries and Regions (1995)
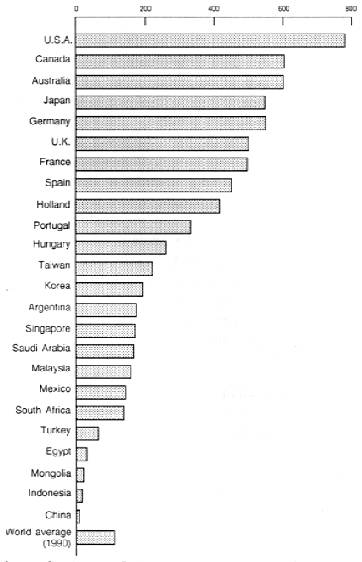
Source :Compiled by the Environment Agency from the "Automobile Statistics of Major Nations" published by the Japan Automobile Manufacturers Association Inc.
Growth in Household Electricity Consumption 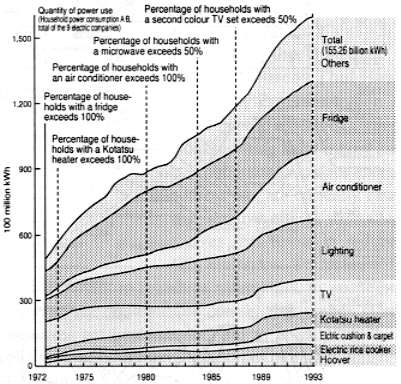
Source: The Federation of Electric Power Companies
Ways to Reduce CO2 Emissions in Energy Use
In order to reduce CO2 emissions, it is necessary to 1) reduce levels of primary energy supply, and 2) to replace energy sources with alternatives that emit less CO2.
In Japan, in 1994, only 33% of primary energy supply was used efficiently and 67% was disposed directly into the environment in forms such as waste heat. Moreover, the percentage of wasted energy has been increasing in recent years.
In order to minimise primary energy supply, it is necessary 1) to use energy efficiently and reduce the ratio of 67% waste to 33% utilisation, and 2) to minimise the absolute amount of efficiently used energy.
Flow of Energy Supply/Consumption in Japan 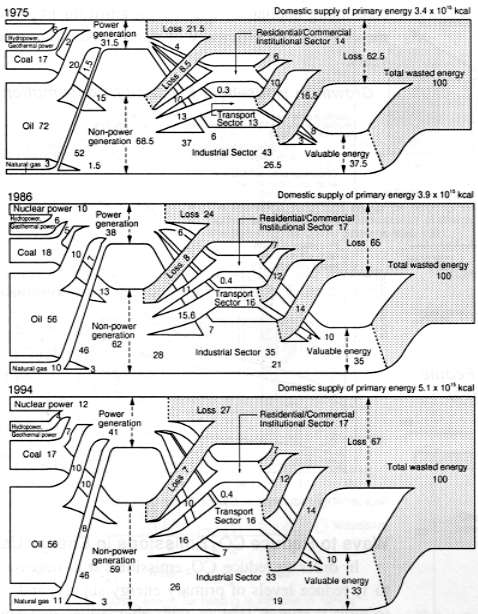
Note :Compiled by Masaru Hirata, Professor Emeritus of Tokyo University
(The numbers are percentages of the domestic primary energy supply of the year.)
Emissions Reduction from the Industrial Sector and the Energy Conversion Sector
When obtaining energy by burning fossil fuels, it is possible to use heat of many different temperatures. From high temperature heat, electricity, a high quality energy that can be transformed into various dynamic forces and heat, can be extracted. Low temperature heat can be used directly to heat houses and water. By using heat at different temperature levels, it is possible to reduce energy loss.
Use of Heat at Different Temperatures
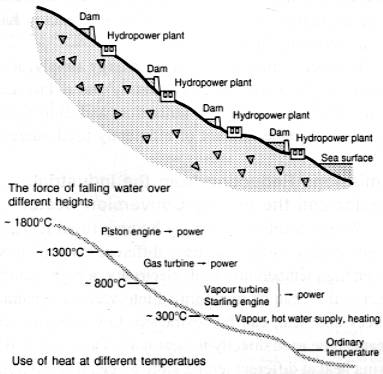
Source :Masaru Hirata "On Energy Saving"
Widespread Introduction of Co-generation
Co-generation is a method that involves the utilisation of heat at different temperatures. Low level heat is generated as dynamic forces are produced from high level heat for power generation. By balancing demand for power and heat, and assuming that all the energy produced is used, the total level of energy efficiency can be raised by more than 80%.
In Japan, the capacity of co-generation facilities, at the end of 1995, accounted for approximately 1.6% of the total volume of power generation facilities. In the European nations, the further introduction of co-generation is considered to be an important measure in the fight to reduce CO2 emissions. The Dutch government pledged a 3.7% reduction in the 1990 levels of CO2 emissions by the year 2000. Denmark pledged 7.9% and the United Kingdom pledged reductions of between 4% and 8%. All these three countries list the introduction of co-generation as one of the key measures to be employed in making these reductions possible.
In the past, the power and heat obtained by co-generation were mostly utilised at the generation site. However, if the system of co-generation is to become more wide-spread, it is important to realise a system which enables me whole of society to utilise the energy thus obtained. In this way, it becomes possible to reduce CO2 emissions. In order to achieve this, it is necessary to further consolidate adequate social systems, relevant regulations, and technological development, to stimulate the spread of the co-generation system.
Example of Energy Efficiency Comparison
between Co-generation and Standard Systems
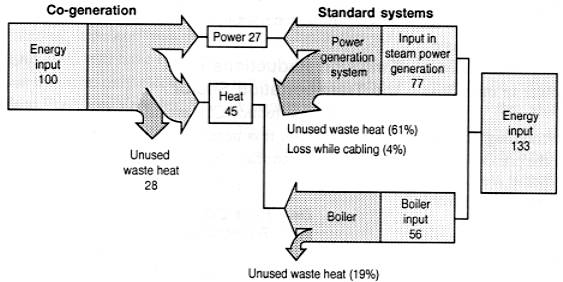
Note :This example is based on a situation where both electricity and heat demands are adequately divided in cogeneration and both are used up.
Source: Environment Agency
Power Generation by Combined Cycle
In the present thermal power generation system, the maximum possible energy efficiency is 40%. However, by employing the "combined cycle" power generation system, the efficiency can be raised to 50%. The combined cycle system generates power by turning turbines with high temperature gas, and at the same time, the process generates more power by creating vapour from the heat that is released by the waste gas. It is important to promote the further spread of the application of this system.
Using the Industrial Waste Energy in Society
In high energy use factories in Japan, the levels of energy saving measures are quite high. However, there is still much energy wasted due to priority being placed on economic efficiency rather than on energy efficiency, and because once the temperature levels have reached a certain low point they are no longer useful for the factory.
There are two ways to use the energy that is wasted by factories outside their premises. One is to use the surplus energy as heat and the other is to use it to generate power. For instance, about 27% of the waste energy produced by the steel industry could be used to provide heat in surrounding areas. This 27% figure amounts to as much as 10% of the energy input in the whole steel industry and the heat that could be made available for use by the communities in the vicinity of steel operations accounts for approximately 7% of the total heat demand for the residential/commercial/institutional sector in Tokyo's 23 wards.
Detailed Energy Consumption in the Steel Industry
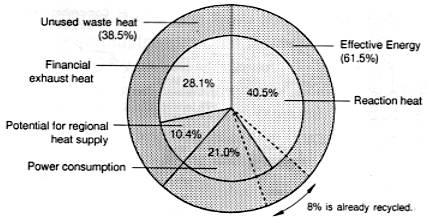
Source: Compiled by the Environment Agency from "Unused Energy at a Through Process Iron Mill" published by the Japan Iron and Steel Federation
Solar power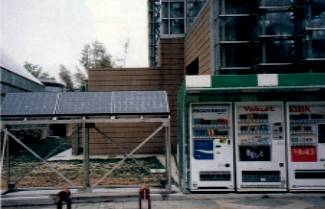
Photo: Courtesy of Kitakyushu-city
Promoting the Use of Energy Sources That Have Low CO2 Emission
In order to reduce CO2 emissions resulting from energy use, it is important to replace energy sources that are currently causing negative effects with alternatives that result in reduced CO2 emissions. To realise this, it is important to introduce natural gas, to utilise nuclear power, assuring, of course, that secure safety measures are implemented, and to promote the employment of newly developed types of energy sources, for example, solar power.
World's Wind Power Generation Capacity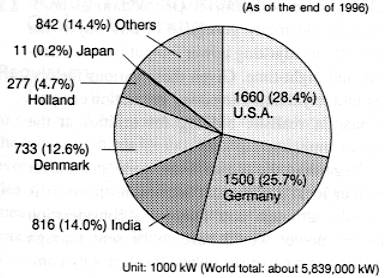
Unit: 1000 kW (World total: about 5,839,000 kW)
Source: WIND POWER MONTHLY
Solar Power Generation and Wind Power Generation
Compared with the usual power generation methods, the monetary cost of solar power generation is still high. However, by introducing mass quantity, it is expected that the cost can be cut down dramatically. Since 1994, MITI (Ministry of International Trade and Industry) started subsidizing the introduction of household solar power generation systems.
Also, the development and introduction of wind power generation is expected.
Waste Power Generation
The waste power generation system generates power using wasted heat created when burning garbage. A reduction of CO2 emission is being envisaged from this system. There are two ways to promote waste power generation: 1) Selling generated power to electricity companies, 2) Utilising the power In other local government sectors.
Regarding the first possibility, according to the Environment Agency's calculations, at the present price levied by electricity companies, the sales of electricity generated by burning garbage would not have sufficient economic advantage. The 1994 revision of the Electric Power Industry Law Introduced a new bidding system, which has made the bidding more competitive. One additional problem with electricity generated in this way is the difficulty in adjusting power output between daytime and night-time. Given these various factors, it is unlikely that waste power generation can participate in realistic bidding for utilities at the present time.
Regarding the use of waste generated power in other local government sectors, in theory it is possible, although cost remains a consideration and the power would have to be sent through electric cable networks owned by electricity companies.
Waste power generation is expected to reduce CO2 emission substantially, and further building of the practical and societal infrastructure, which can spread the waste power generation, is needed.
Estimate on Waste Power Generation
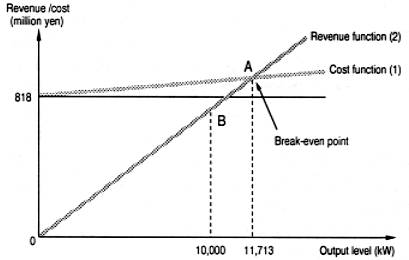
- Notes:
- 1. Line (1) is the cost function of waste power generation.
Line (2) is the revenue function of electricity sales. (Sales price = ¥8.2/kWh)
Point A is the break-even point given current conditions.
Point B shows the current conditions. (the cost exceeds the revenue.) - 2. The break-even point (A) is achieved when cost and revenue become equal. If the output exceeds the break-even point, then profit emerges. If output falls below the break-even point, then loss is incurred.
Source:Compiled by the Environment Agency from documents of the Garbage Collection Union of Saitama Prefecture, Eastern Region.
Emission Reductions from the Transportation Sector
In order to reduce CO2 emissions from the transportation sector, it is necessary, firstly, to reduce CO2 emission from traffic, especially from individual automobiles.
Details of CO2 Emissions in the Transportation Sector
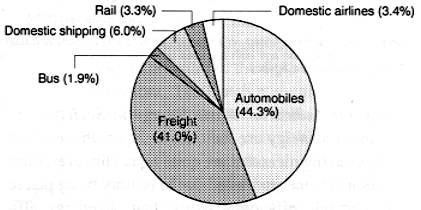
Source:Estimated by the Environment Agency from "Transport-related energy survey" produced by the Ministry of Transport and "Comprehensive Energy Statistics" produced by the MITI.
High quality electric car "Luciole"
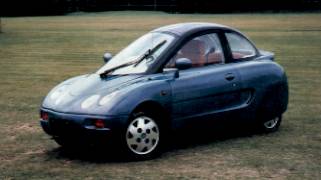
Photo: Courtesy of National Institute for Environmental Studies
Introduction of Low Emission Automobiles
Electric cars have 1.5-1.8 times more energy efficiency (including power generation and transportation) than petrol operated cars, therefore, NOx and CO2 emissions can be cut down substantially. Along with the introduction of electric automobiles, it is necessary to introduce other low emission cars such as natural-gas fuelled and methanol-fuelled vehicles and hybrid cars (which use electricity and petrol or diesel).
In California, in the United States, the state law, along with the low-emission car introduction programme, stipulates that 10% of all automobiles sold from 2003 will have to be Zero Emission Vehicles. At this moment, only electric cars fulfill the criteria set for Zero Emission Vehicles. The awareness of this future responsibility is having a substantially positive effect on the promotion of technological development and the introduction of electric cars.
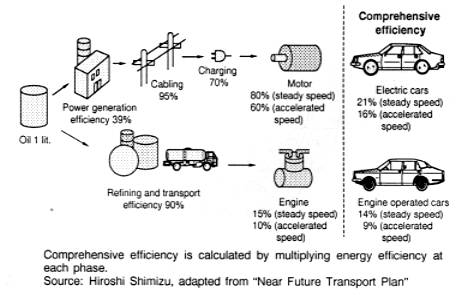
Energy Efficiency of Petrol Fuelled Cars and Electric Cars
Using Oil as a Primary Energy Source
The Efforts of Individuals
In 1996, the Environment Agency launched the "Idling Stop Movement." It is important for each of us to refrain from unnecessary or non-urgent use of private cars, to drive economically and to reduce environmental pressure in our daily lives.
Examples of Wasteful Fuel Consumption Caused by Uneconomical Driving Styles
| Examples of uneconomical driving styles | Amount of fuel wasted |
|---|---|
| Idling | 140cc every 10 minute equivalent to about 1,440m's drive |
| Abrupt start | 120cc every 10 times equivalent to about 1,240m's drive |
| Sudden acceleration | 120cc every 10 times equivalent to about 1,240m's drive |
| Revving | 60cc every 10 times equivalent to about 620m's drive |
| Low tyre pressure | 130cc every 50km's drive equivalent to about 1,340m's drive |
| Unnecessary load | 400cc (1,000km's drive) every 10kg equivalent to about 4,120m's drive |
Source: Compiled from PR documents based on the decisions made by the Energy Saving/Resource Saving Measures Promotion Conference regarding Energy Saving Measures in the Summer (Winter) Months
Emission Reduction from the Residential/Commercial/Institutional Sectors
Commercial/Institutional Sector
In the commercial/institutional sector, substantial reductions in emissions are expected, and can be achieved by reinforcing insulation structures in buildings and by introducing energy-saving heating, cooling and lighting systems.
Residential Sector
In the residential sector, an effective step to reduce emissions involves improving the levels of insulation in one's house. This can be achieved by installing double glazing and sash insulation, and by using insulation materials for ceilings, walls and floors which border the houses' exterior.
Also, as more home electrical devices are being sold that incorporate built-in timers and micro-computers, the power consumption when these devices are put into the 'sleep' mode is increasing. In the future, manufacturers should make efforts to improve the energy efficiency of individual appliances. At the same time, it is important for consumers to choose energy saving devices.
International Comparison of the Changes in Insulation Standards
(Through Flow Resistance of Ceiling)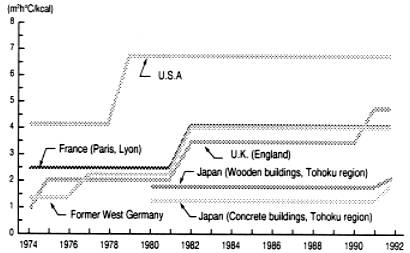
Source: The Institute of Energy Economics, Japan
"International Comparison of Households Energy Saving"
Life Style Change
Small resolutions in our daily lives lead to the reduction of CO2 emissions, and a lot of small resolutions, in conjunction, can have a dramatic effect. To arrest global warming, it is necessary to revise our mass-consumption and mass-disposal type of lifestyle itself. How much each citizen can do is a major factor for the success of global warming counter-measures.