

Chapter I -1 :Quality of the Environment in Japan 1997
Chapter I: How to Tackle the Global Warming Issue
Among the growing number of environmental issues, global warming ranks as one of the most serious. This December, the Third Session of the Conference of the Parties (COP3) to the United Nations Framework Convention on Climate Change will be held In the ancient capital of Kyoto. As a member of the global community and also as the hosting nation for the COP3, Japan should take the lead in the efforts that are being made to arrest global warming.
1. State of Global Warming
As early as 1860, an Irish scientist named J. Tyndall had pointed out the possibility that human activities might warm the earth's surface. At the end of the 19th century, the Swedish physicist S.A. Arrhenious revealed that as CO2 concentrations in the air increase, the temperature also goes up, and this knowledge gradually spread within the scientific community.
Mechanisms of Global Warming
The earth's surface is heated by solar radiation energy, and the earth's surface cools by releasing energy Into the universe. The surface temperature is determined according to the balance that exists between the absorption and the release of energy. In theory, the average temperature of the earth should be 5 degrees Celsius, however, in reality, it is about 15ーC. This disparity occurs due to the cooling effects created by phenomena such as clouds and the particulates that are released into the atmosphere by volcanic activity. These phenomena reflect back some solar energy (lowering the temperature by 23ーC). The so-called "greenhouse effect" counteracts this cooling influence. Greenhouse gasses that have accumulated in the earth's atmosphere absorb energy released from the earth's surface (raising the temperature by 33ーC).
Because greenhouse gasses re-radiate absorbed energy from the earth's surface in all directions, some energy is released into the universe, and the rest returns to the earth's surface, thereby raising the surface temperature. Artificially emitted greenhouse gasses include CO2 methane, N2O, CFCs, etc.
Direct Contribution Rate of Artificially Emitted
Greenhouse Gasses to Global Warming
Since the Industrial Revolution (as of 1992)
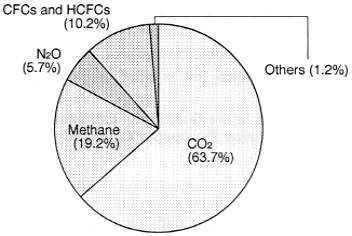
Source: IPCC (1995)
CO2 Cycle
When the earth was formed approximately 4.6 billion years ago, the earth's temperature was some thousands degrees Celsius. At that time, the atmosphere contained approximately 101,300 hectopascals of vapour and 101,300 hectopascals of CO2. When the earth cooled and oceans were formed, some of the CO2 in the atmosphere dissolved into the planet's seas. Early marine life forms trapped the chemical in their skeletal residues which subsequently became geological substances such as limestone. CO2 was also converted into organic matter by the photosynthetic reactions of plant-life and, among other things, some of this organically trapped CO2 Subsequently became coal and oil.
As a result of these organic processes, the quantity of earth's atmosphere CO2 continued to decrease until, about 200 million years ago, it reached the current concentration levels that we experience today.
At present, as a result of human activities, about 7.1 billion tonnes of carbon per annum is being released into the atmosphere, of which around 3.3 billion tonnes remains in the air. As a result, the CO2 concentration in the atmosphere has been rising by 1.5 ppmv per year in recent times.
Changes in Greenhouse Gas Concentrations (CO2)
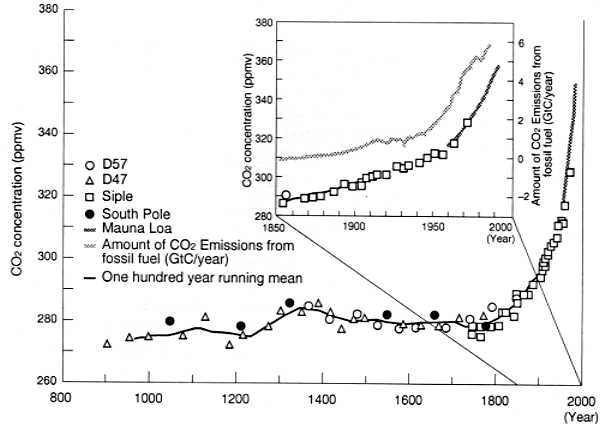
These are CO2 concentrations in the last 1000 years recorded in ice core samples taken at D47, D57, and the siple base and the South Pole, and from CO2 concentrations recorded at the Mauna Loa Observatory in Hawaii since 1958. All ice core samples were collected in Antarctica. The smooth curve shows 100 year average changes.
Source: IPCC (1995)
Current Impacts of Global Warming
Since the industrial revolution, the atmospheric concentrations of greenhouse gasses have increased substantially. As a result, during the 100 years that have ensued since the end of the 19th century, the average temperature of the earth's surface has increased by 0.3-0.6ーC, and the sea level has risen by 10-25 cm.
Moreover, in this century, a series of phenomena, such as the global retreat of glaciers, extremely high regional temperatures, floods and drought, have been observed. In Japan, the annual average temperature has risen by about 0.9ーC in the last 100 years.
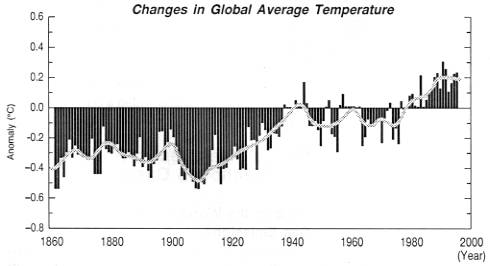
Anomaly (ーC) from the 1961-90 average of the combination of land and sea surface temperatures between 1861 and 1994
Source: IPCC (1995)
Predictions of Global Warming
Estimated Contribution of Various Factors to
Sea Level Rise in the Last 100 Years
| Component Contribution | Low | Middle | High |
|---|---|---|---|
| Thermal expansion | 2 | 4 | 7 |
| Glacier/small ice cap | 2 | 3.5 | 5 |
| Greenland ice sheet | -4 | 0 | 4 |
| Antarctic ice sheet | -14 | 0 | 14 |
| Storage surface and ground water | -5 | 0.5 | 7 |
| Total | -19 | 8 | 37 |
| Observed level | 10 | 18 | 25 |
Source: IPCC (1995)
The IPCC (Inter-governmental Panel on Climate Change) predicts that if the world's CO2 emissions triple by the year 2100 from the 1990 level, (and in this case, CO2 concentrations double compared with the 1990 level), then the world's average temperature in 2100 will be 2ーC higher than in 1990 and the sea level will have risen by about 50 cm during the same period. The IPCC predicts that the average temperature will continue to rise, and stresses the necessity of reducing the emission of CO2 and other gasses to below the 1990 level, in order to halt further warming of the earth's surface and atmosphere.
Negative effects of global warming such as drought, floods, abnormal climatic phenomena and Other disasters caused by temperature and sea level rise, are just some of the problems currently causing concern. In addition, the spread of malaria and other tropical diseases is feared, and rising temperatures are bound to significantly impact on vegetation and food production.
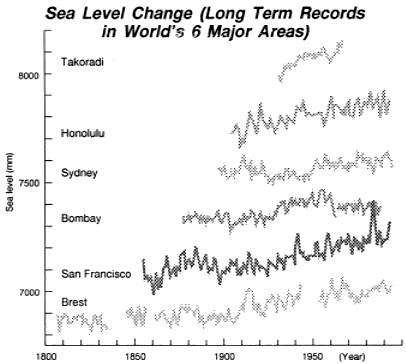
Takoradi (Africa), Honolulu (Pacific), Sydney (Australia), Bombay (Asia), San Francisco (North America) and Brest (Europe). Each record has been offset vertically for presentational purposes. The observed trends (in mm/yr) for each record over the 20th century are, respectively, 3.1 1.5, 0.8, 0.9, 2.0 and 1.3. The effect of post-glacial rebound (lowering relative sea level) as simulated by the Peltier ICE-3G model is less than, or of the order of, 0.5 mm/yr at each site.
Source: IPCC (1995)
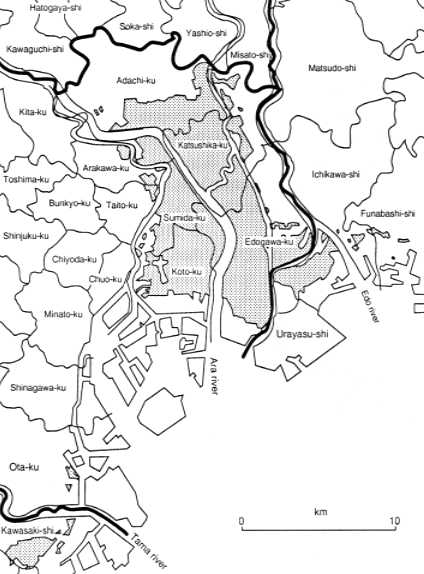
Source: Compiled by the Environment Agency from the land level map of the Geographical Survey Institute
Formation of International Consensus on Global Warming Measures
At the 1992 Earth Summit, the United Nations Framework Convention on Climate Change was signed. The Convention stipulates that the developed nations should:
- 1)
- devise policies/measures recognising the importance of reducing artificial emissions to earlier levels by the end of the 1990s.
- 2)
- report to the Conference of the Parties on details of policies/measures employed with the aim of bringing the artificial emissions level to the 1990 level. Also they are expected to provide predictions of future levels of CO2 emission and absorption.
At the First Session of the Conference of the Parties held in Berlin in 1995, it was decided to internationally examine various issues so that at the 1997 Conference of Parties international agreement could be made on the following:
- 1)
- details of policies and measures
- 2)
- numerical targets within a certain period of time such as until 2005, until 2010 and until 2020.