Quality of the Environment in Japan 1992
(9) Findings of Monitoring at National Environmental and Air Monitoring Stations
Established at the edges of major plains across the nation, the national environmental and air monitoring stations monitor pollutants at all times. The findings of monitoring by these stations serve as a good yardstick for the background concentration in non-polluted areas.(Table 6-1-7)
Table 6-1-6 Results of Monitoring Controllde Air Pollutants as of the End of FY 1999
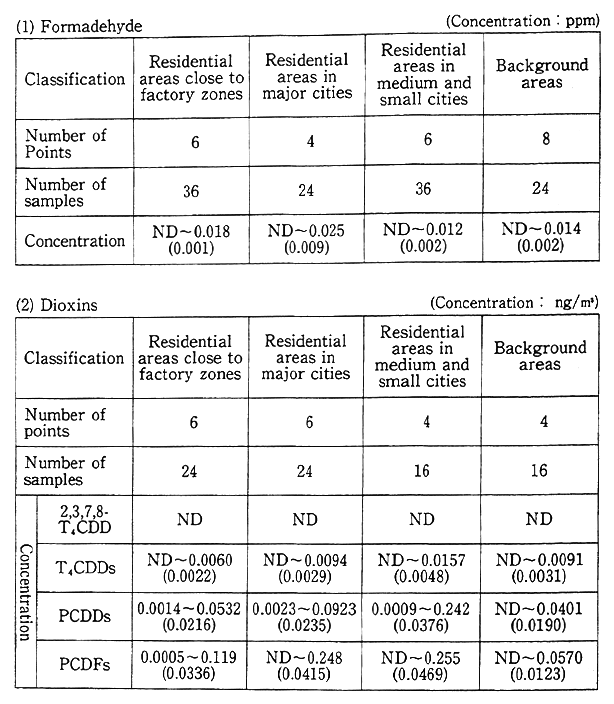
Remarks:1. Surveyed the Environment Agency.
2. ing represents one-one hundred millionth of lg.
3. "ND"indicates "not detected.
4. The figures in parentheses average values (in terms of NF).
5. "2,3,7,8-T4CDD" represents 2,3,7,8 dioxin hetrach1oride, "T4CDDs" represents total all dioxins hetrachloride, and "PCDDs"' represents dioxins polychloride and "PCDFs" represents polychloridedibenzofran.
Table 6-1-7 Results of Air Monitoring at State-Established Air Monitoring Stations (Annual Average Values)
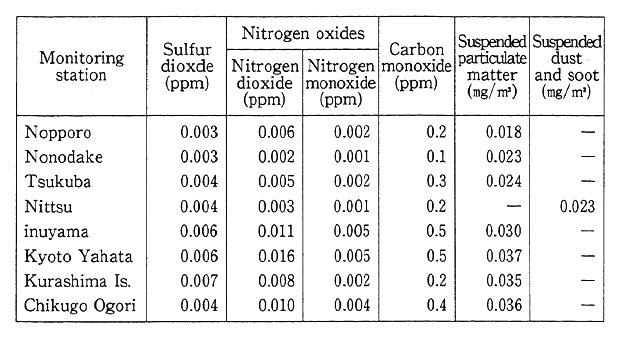
Remarks:1. Surveyed by the Environment Agency.
2. The figures in parentheses represent the annual average figures when the monitoring hours is less than 6,000 hours.
6-2 Measures Against Air Pollutants
6-2-1 Sulfur oxides
(1) Controls on Emissions
As regards controls on the emission of sulfur oxides,controls consist of emission standards for facilities, and areawide total pollutant load control standards for factories in highly polluted areas. The con-trols based on emission standards for facilities are known as K-value controls whereby acceptable emissions are formulated. An acceptable emission rate is determined, depending on the stack height and the area, and the permissible rate is gradually amended and strengthened. Are-awide total pollutant load controls for factories are made according to total quantity reduction programs formulated by prefectural governors in the state-designated areawide total pollutant load control districts (designation is done for areas where factories and business establish-ments are concentrated and where it is difficult to achieve environmen-tal quality standards with emission standards alone). At present, con-trols are in place in 24 districts. In November 1990. natural gas engine and gasoline engines were included as controlled equipment, and con-trols on them were started in February 1991.
In addition, standards for the use of fuels (related to the sulfur content) are formulated for small scale factories and business establish-ments, to which areawide total pollutant load control standards are not applied because of their size. These fuel use standards apply in areas designated for total-quantity controls, and for soot and smoke generat-ing facilities in areas whose air is seasonally polluted to a significant extent due to rises in fuel consumption, such as with heating systems.
(2) Measures Against Pollutant Generation
Sulfur oxide emission standards which have been established for source include: (A) the desulfurization of heavy oils, (B) the installation of devices for flue gas desulfurization and other measures.
Fig. 6-2-1 Installation of Exhaust Desulfurization Facilities by Year
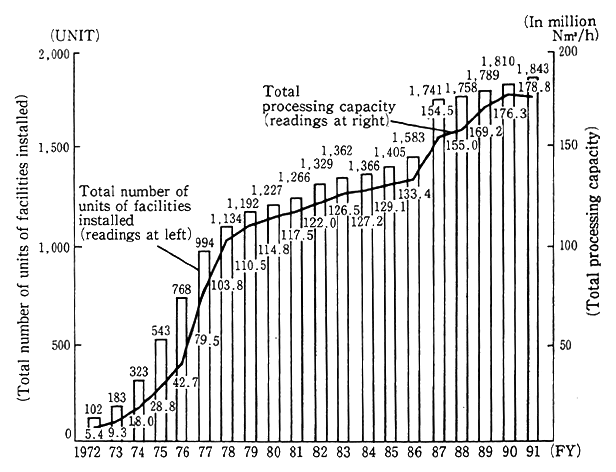
Remarks:1. Surveyed by the Environment Agency.
2. The figures for FY1982 and the preceding years are those as of January 1 of the given year,whereas those for FY 1983 and the subsequent years are those as March 31 of the given year.
(A) As regards the desulfurization of heavy oils, the processing capacity for heavy oils as of the end of fiscal 1990 was 66,000 kl/day with 12 devices for direct desulfurization and 135,000 kl/day with 28 devices for indirect desulfurization. With such measures for thedesulfur-ization of heavy oils, the average rate of sulfur contained in heavy oils for domestic demand stood at 1.05% in fiscal 1990.
(B) As regards devices for flue gas desulfurization, the operation of practical models began in 1970. Later, the number of devices and the processing capacity have steadily increased (the installation of exhaust smoke desulfurization devices by year is indicated in Fig. 6-2-1).
With the aforementioned measures, the conditions of air pollution by sulfur dioxide are far better than in the first half of the 1965-70 period.
6-2-2 Nitrogen Oxides
(1) Measures For Stationary Sources
a. Implementation of Nationally Uniform Emission Controls
Concerning nationwide uniform controls on the emission of nitro-gen oxides when it comes to stationary sources, the strengthening of emission standards and the expansion of subject facilities have been conducted several times since 1973. In November 1990. natural gas engine and gasoline engines were additionally designated as controlled sources, and their controls were started in February 1991.
b. Exercise of Total-Volume Controls
(a) Introduction of Total-volume Controls
For areas where factories and business establishments are con-centrated and it is considered difficult to assure environmental quality standards with emission controls for each soot and smoke generating facility in isolation, the Ordinance for Enforcement of the Air Pollution Control Law was partially amended in June 1981 to introduce a system of areawide total pollutant volume controls on nitrogen oxides. Tokyo' s Special Wards and other areas, Yokohama City and other areas, and Osaka City and other areas were designated for areawide total pollutant volume controls. As regards Nagoya City and other areas, Cadet Kyushu City and other areas and Kobe City and other areas, the local governments are striving to promote measures against nitrogen oxides under their own authorities.
(b) Implementation of Areawide Total Pollutant Volume Controls
In three areas designated as areawide total pollutant volume control areas in June 1981, controls have been exercised since 1982. At the end of March 1985, the application of areawide total pollutant load control standards was first applied to existing factories and business establishments.
c. Development of Technology for Reductions in Emission of Nitrogen Oxides
Of late, the development of low NOx combustion technology is remarkable. With the adoption of a two-phase combustion method and a low NOx burner, combustion technology of the kind with which considerable effects may be secured for reductions in the emission of nitrogen oxides is already widely utilized.
The number of flue gas desulfurization devices installed and the processing capacity have steadily increased as indicated in Fig. 6-2-2. A check of the installation shows that most of them adopt a dry-type selective contact and catalyst reduction method. Other methods include a non-catalyst reduction method, a wet-type direct absorption method and a wet-type oxidation and absorption method.
(2) Countermeasures For Automobile Exhaust
Controls on nitrogen oxides emitted from automobiles have been gradually strengthened, but it has become necessary to lower emissions in major cities and other areas where the traffic volume of automobiles is great, so that there is the need to further promote comprehensive measures, including traffic controls, the improvement of the road struc-ture and so forth (for details, see Section 4).
In addition to those measures, a wide variety of projects which will contribute to improvements in the local air environment is being promoted with a fund established in the Environmental Pollution Health Damage Compensation and Prevention Association as the financial source. This association falls under the revised Law for the Compensa-tion of Health Damage by Environmental Pollution, which is to be referred to in Chapter 9, and attempts to prevent health damage caused by nitrogen oxides and other air pollutants.
Fig. 6-2-2 Installation of Exhaust Desulfuriza-tion Facilities by Year
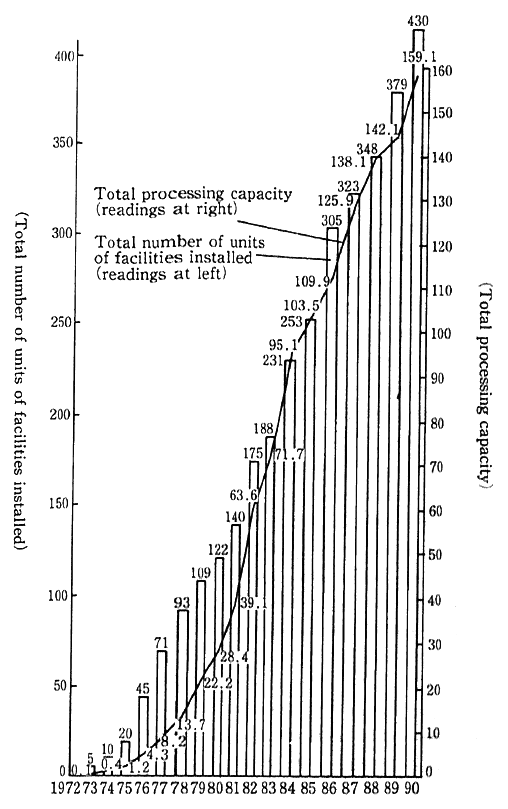
Remarks:1. Surveyed by the Environment Agency.
2. The figures for FY1984 and the subse-quent years are based on the r ported data pigeonholing project associated with. facillities which emit soot.
3. The figures for FY1982 and the precede ing years are those as of January [ of the given year,whereas those for FY1983 and the subsequent years are those as of March 31 of the given year.
(3) Measures Against Nitrogen Oxides in Major Urban Areas
Despite the implementation of the aforementioned various mea-sures we have just seen, the levels of air pollution caused by nitrogen oxides in major urban areas remain significant.
A check of the concentrations of nitrogen dioxide in three areas designated for areawide total pollutant volume controls on nitrogen oxides in fiscal 1990 indicates that the level of annual average values remained almost the same as in the preceding year and that the achieve-ment of environmental quality standards remained marginal with 45.9% for general environmental and air monitoring stations and 11.1% for automobile exhaust gas monitoring stations. A projection of the emis-sion of nitrogen oxides by source of generation in those areas in fiscal 1985 indicates that the rate of emission from automobiles was signifi-cant in terms of weight, standing at 67% for Tokyo's Special Wards and other areas, 32% for Yokohama City and other areas and 47% for Osaka City and other areas.
Given those conditions, the Environment Agency formulated the Medium-Term Prospect of Measures Against Nitrogen Oxides in Major Cities in December 1985 and the New Medium-Term Prospect of Measures Against Nitrogen Oxides (hereinafter referred as "New Medium-Term Prospect") in December 1988. On the basis of the future prospect, the agency has been promoting systematic and comprehensive measures. On this basis at present, a wide variety of measures, including three centerpieces-measures on individual automobiles themselves, measures on automobile traffic and measures on stationary source--are being stepped up for early achievement of environmental quality stan-dards
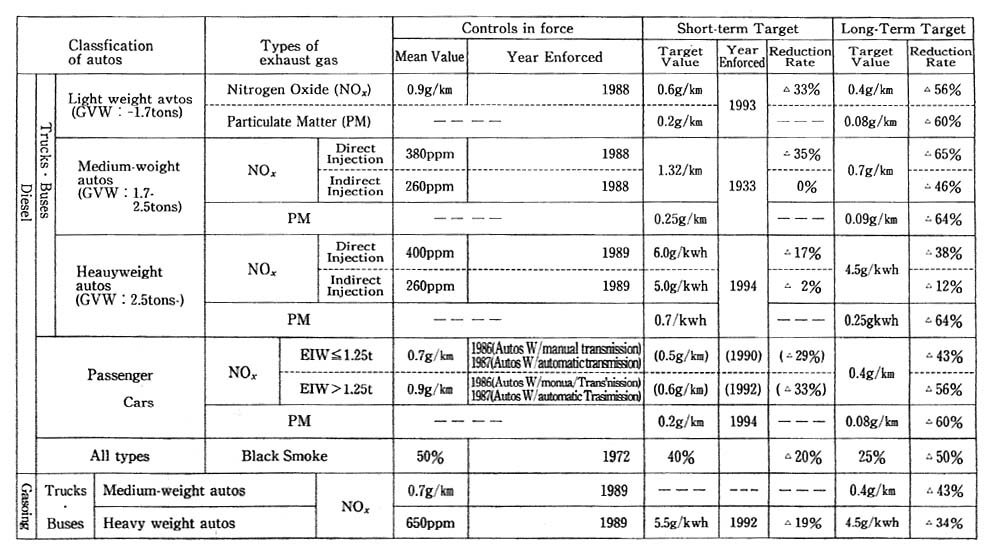
As regards measures on automobiles, the Central Council for Environmental Pollution Control came out with a recommendation in December 1989 regarding future policy for motor vehicle exhaust reduc-tion. In the recommendation, strict reduction targets were set for nitrogen oxides in two phases, a short term (less than five years) and a long term (less than 10 years) centering on diesel powered vehicles.. Additionally, the recommendation called for technical modes of measur-ing automobile exhaust gas to reflect more on the actual conditions of automobile trips (Table 6-2-1). In line with this recommendation, the Environment Agency revised the permissible limits of automobile exhaust gas and the Ministry of Transport revised Safety Regulations for Road Vehicles in March 1992 to change test cycles in 1992 and achieve short-term targets from 1992 to 1994. It will also strive to attain long-term target values as early as possible while encouraging automa-kers, etc., to develop technology. As for the promotion of substitution of low NOx pollution vehicles, such as those satisfying the latest controls, and the introduction and dissemination of electric and other low-pollution vehicles, active approaches are being made, using such approaches as preferential tax measures and the fund available under the Law Concerning the Compensation of Health Damage Caused by Environmental Pollution.
Table 6-2-1 Target Valves Set for Tolerable Limits
Due to the effects of reduction in automobile exhaust on the basis of the aforementioned recommendation, it is projected that when it comes to air pollution by nitrogen oxides in major cities, environmental quality standards may be almost completely attained at air pollution monitoring stations, but that full improvements may not be made to attain environmental quality standards at road-side air pollution monitoring stations. For this reason, there are calls formeasures for mulated on entirely new concepts. Measures for reductions in the total quantity of nitrogen oxides by automobiles, were approved by the Cabinet in the form of the "Special Measures Bill for the Total Emission Reduction of Nitrogen Oxides from Automobiles in Specified Areas" on March 13, 1992. It was then submitted to the Diet.
The bill is designed to formulate a basic policy on the emission reduction of nitrogen oxides exhausted from automobiles and imple-ment special measures to curb the emission of nitrogen oxides from automobiles.
In addition to those measures, the Provisional Measures Against Seasonal Air Pollution, which include the control of heating tempera-tures, curbs on the number of incoming and outgoing trucks and so forth, have been in force to cope with high concentrations of air pollu-tion in the wintertime. With December designated as Air Pollution Prevention Promotion Month, dissemination and enhancement activities for the prevention of air pollution are being made for a broad segment of the people, such as by promoting the utilization of public transporta-tion.
6-2-3 Suspended Particulate Matter
Particulate matter in the atmosphere is roughly classified into "falling dust" and "suspended dust," and suspended dust is further sub -classified into suspended particulate matter with a particulate diame-ter of less than 10 um, for which environmental quality standards are set, and other suspended particulate matter. The generation sources include industrial activities, such as factories and business establish-ments; trips by motor vehicles; the natural environment, including the entrainment of soil particles by the wind; and so forth. In regard to dust generated in conjunction with industrial activity, such as factories and business establishments, particulatematter which comes out due to the combustion of fuels and the like or the use of electric power as a heat source is designated as "soot and dust". Particulate matter which comes out in conjunction with materials crushing and sorting and other types of mechanical processing or storage are designated as "dust" for regulatory purposes. On particulate matter which comes out due to motor vehicles, controls are exercised as "particulate matter" (black diesel smoke).
(1) Measures Against Suspended Particulate Matter
Environmental quality standards were formulated on suspended particulate matter in May 1973. Thought it has improved, the achieve-ment rate remains low, and it is now an urgent task to establish measures. For this purpose, starting in fiscal 1989, the prevailing conditions of pollution were analyzed and studies conducted on improve-ments in the precision of prediction methods and study meetings on methods to reduce suspended particulate matter were held to formulate measures that should be taken in the future. In September 1990, the prevailing state of pollution was defined and future issues were sorted out in the form of an interim report.
As regards particulate matter contained in motor vehicle exhaust, the strengthening of controls on diesel smoke and new controls will be put into effect in 1993 and 1994 on particulate matter in line with the short-term targets specified in the recommendation made by the Central Council for Environmental Pollution Control in December 1989. Furthermore, studies have started towards reaching an early achieve-ment of the long-term targets (see Table 6-2-1).
(2) Measures Against Soot and Dust and General Particulate
When it comes to soot and dust, emission standards are set based on the type and size of facilities. Special stricter emission standards are set for new and modified facilities in areas where facilities are concen-trated and where the levels of pollution are significant In November 1990, natural gas engine and gasoline engines were added to the list of controlled sources, and the controls were into force in February 1991.
In regard to general particulate [other than "special particulate" (asbestos is designated as such under an administrative ordinance)] standards are set on the lay out, handling/use and management of general particulate generating facilities, such as stockpiles and conveyers.
6-2-4 Measures Against Air Pollution Caused by Studded Tires
In recent years, the air pollution caused by dust, generated by motor vehicles equipped with studded tires has posed serious social problems in snowy and cold areas..
In light of this situation, "Studded Tires Regulation Law" was promulgated and put into force in June 1991. In this law, it is pre-scribed as a duty for the people to prevent such dust from being generated. It is also stipulated that the State and local governments shall promote and implement related measures, such as arousing public concern on the problem, supporting development of substitute tires, improving maintenance of roads and instructing winter driving skills, and that theuse of studded tires shall be regulated in the areas which are to be designated by the Director-general of the Environment Agency.
The Environment Agency has prepared and distributed the "Administrative Manuals", brochures and posters, to help local govern-ments implement related measures for society without use of studded tires.
Local governments has designated December as "Month for the Promotion of the Studded Tire Elimination Campaign". A wide variety of activities has evolved under the sponsorship of the Administrative Liaison Council on Studded Tire Problems, formed by 23 affected prefectures, and the Promotion Council for City Without Use of Studded Tires, established by 198 cities, with the support of the Environment Agency and six related ministries.
In December 1990, an administrative ordinance was promulgated to list motor vehicles, for which the prohibition of the use of studded tires is exempted. The Environment Agency began in January 1991 to designate areas where the use of studded tires would be regulated (672 municipalities in 17 prefectures as of March 1992).
In November 1991, another administrative ordinance was promul-gated to designate as March 31, 1993, the grace period during which the enforcement of regulations on the use of studded tires by large-size vehicles will not occur.
6-2-5 Photochemical Air Pollution
The concentrations of photochemical oxidant are in excess of environmental quality standards in almost every district of the nation. Now that the conditions are such that warnings are issued, depending on meteorological conditions, there is the need to understand accurately changes in the degree of pollution and take appropriate measures.
(1) Emergency Measures Against Photochemical Air Pollution
In order to get meteorological data to judge warnings, the Environment Agency is carrying out the meteorological observations at four points on Tokyo Bay and Osaka Bay, where photochemical air pollution tends to occur in the summertime, and offering meteorological information to related local governments. The Meteorological Agency analyzes and forecasts meteorological conditions, under which photo-chemical air pollution tends to take place, at 19 meteorological observa-tion of Meteorological Agency across the nation, reporting to local governments. On the basis of that information and the data from monitoring stations, local governments issue warnings in accordance with the Procedure on Emergency Measures Against Photochemical Oxidants, call on persons responsible for the emission of soot and smoke to cut back emissions and on motor vehicle drivers to refrain from making unnecessary car trips, and conduct public-information activities and health care measures for residents.
(2) Measures for Curbs on Emission of Hydrocarbons
a. Measures for Curbs on Emission of Hydrocarbons from Stationary Sources
In July 1982, the Environment Agency produced a policy document "Promotion of Measures Against Hydrocarbons for the Prevention of Photochemical Air Pollution". In accordance with this policy, the agency made necessary calls to local governments and other related institutions for the promotion of measures to reduce hydrocar-bon emissions.
b. Curbs on Emissions of Hydrocarbon from Motor vehicles
Controls began in 1970 on hydrocarbons emitted from motor vehicles. In the case of gasoline and LEG passenger cars, emissions per car are down 92% from the years when no controls were exercised.
(3) Surveys and Studies of Photochemical Air Pollution
The surveys made of photochemical air pollution cover abroad range of subjects, such as mechanisms for photochemical reactions, meteorological effects produced by drift and dispersion, actual emission of causative substances,photochemical air pollution forecast models incorporating those factors and the effects produced by photochemical oxidant on plants.
Incidentally, from June to August 1991. an experiment on Photo-chemical Air Pollution Information Online Network, PAPION, which covers Tokyo and six prefectures near the Bay of Tokyo was conducted with the cooperation of the Meteorological Agency and related local governments.
6-2-6 Other Air Pollutants
(1) Measures Against Asbestos
Asbestos excels in heat resistance and other properties so that it is used for many products. Because of its carcinogenicity and other toxicity, it is an urgent task to take measures for the prevention of air pollution and effects on man's health. The Environment Agency began surveys and studies in 1975. As a result, it was learned that there were cases in which concentrations tens to hundreds of times higher than in the normal environment (with the highest mean of average values by monitoring point) were monitor-ed along the fence lines of some factories manufacturing asbestos products. As the risks of lung cancer and malignant mesothelioma become high in cases where such concentrations continue in the future, it has been found that there is a need to reduce concentrations to the level where the World Health Organization (WHO) describes as being so low that the risks of lung cancer and malignant mesothelioma cannot be detected.
In response to a recommendation of the Central Council for Environmental Pollution Control, the Law for the Partial Revision of the Air Pollution Prevention Law was promulgated in June 1989 and put into force December 27 of the same year.
In the law, asbestos and other particulate which are likely to bring about damage on man's health is defined as "special particulate" and shearers and other dust generating devices as "special particulate generating facilities." Controls under the Air Pollution Control Law apply to factories equipped with those facilities which manufacture asbestos products and other substances.
In addition, since fiscal 1990. fact-finding surveys have been made on the dispersion of asbestos from the repair and demolition of build-ings.
(2) Measures Against Harmful Substances
Under the Air Pollution Control Law, (1) cadmium and its com-pounds, (2) chlorine and hydrogen chloride, (3) fluorine,hydrogen fluoride and silicon fluoride and (4) lead and compounds are controlled as "harmful substances" emitted from soot and smoke generating facilities in addition to nitrogen oxides. Particulate matter, emitted at soot and smoke generating facilities for other reasons are controlled simply as "soot and dust."
(3) Measures Against Uncontrolled Matter
From the standpoint of preventing air pollution, substances are chosen from uncontrolled substances of the kind about whose toxicity there is concern and studied for emission concentrations, impacts on the environment and other factors. Continuous monitoring has been con-ducted every other year on asbestos since fiscal 1985, formaldehyde and dioxins since fiscal 1986, mercury since fiscal 1987, and organochlorine solvents since fiscal 1990.
The effects of trichloroethylene and other organochlorine sol-vents on human health were studied, Studies on curbs on emissions have also started, such as by understanding the actual state of emissions from various sources of generation and technology for curbs on emissions. As regards dioxins, the actual state of emissions from paper mills and concentrations in the nearby environment were grasped.
Also concerning a wide variety of air pollutants, a list was prepared of substances to be dealt with on a priority basis. For these pollutants, systematic efforts will be made, such as the expansion of monitoring and the strengthening of studies on health effects.
(4) Activities for Dissemination and Propagation, Etc.
Nowadays the role local residents should play themselves for conservation of the local environment has increased. In order to increase opportunities for them to come in contact with, and reassess their views about, their near-by environment, nationwide "star watch-ing network" programme was started in fiscal 1988 by the initiative of the Environment Agency. In the summer of 1991, observations were done by 5,220 persons of 187 groups (from 44 prefectures, 6 designated cities and 164 municipalities) to deepen the interest in the conservation of the atmosphere.
Also, "checks on the ability of trees to purify the atmosphere" were started in fiscal 1989 as one event during the Environment Week, involving junior-high school students across the nation.
6-3 Redevelopment of Surveillance and Monitoring System
(1) National Air Monitoring Network
National air pollution monitoring stations and environmental atmospheric monitoring stations are operated for the surveillance of air pollution. The location of the air monitoring network is shown in Fig. 6-3-1. Air pollution monitoring stations are established in 15 major areas across the nation. Incidentally, in conjunction with the 1991 eruption of Mt. Unzen Fugendake, the Unzen South Monitoring Station was estab-lished in March 1991 for the surveillance of environmental effects on nearby residents. National environmental atmospheric monitoring sta-tions are established at eight places to understand the conditions of areas other than those already polluted in Japan's typical plains.
Fig. 6-3-1 Location of State-Established Air Monitoring Stations
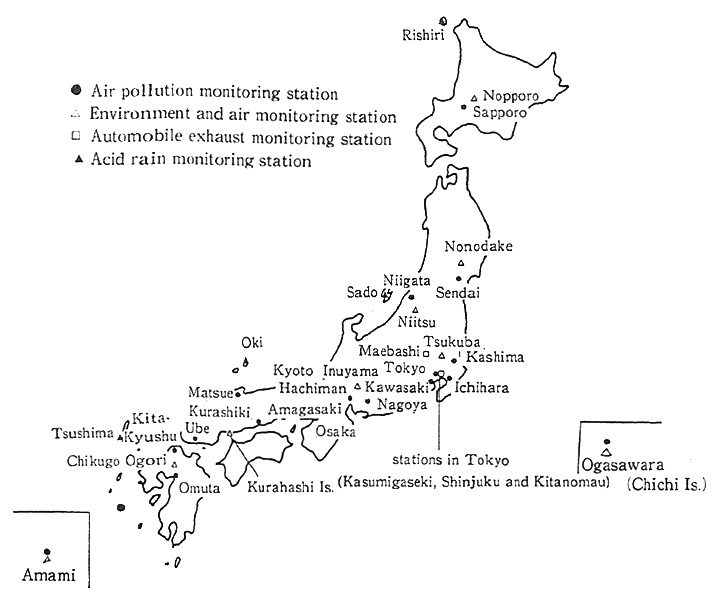
It was also decided to establish acid rain monitoring stations on offshore islands under a three-year program which started in fiscal 1989. They were established on Oki and Tsushima in fiscal 1989. Rishiri and Sado in fiscal 1990, and Ogasawara (Chichijima) and Amami Oshima in fiscal 1991.
National automobile exhaust gas monitoring stations are estab-lished at three locations in Tokyo and also in Maebashi City, Gunma Prefecture.
(2) Local/Municipal Air Pollution Surveillance System
At the prefectural/local level, the continuous surveillance and monitoring of air pollution is conducted by the governors of prefectures and the mayors of administrative ordinance-designated cities in accor-dance with the Air Pollution Control Law. In addition, it is also done by other local governments.
Continuous monitoring is under way for sulfur dioxide and the quantity of fuels utilized at air pollution emission sources, and telemetry systems are urban development by some local governments for the findings of those surveys will be transmitted to the central surveillance center.
6-4 Transportation Pollution--Present State and Measures
6-4-1 Comprehensive Promotion
(1) General State of Transportation Pollution Issues
a. The high and diversified development of various means of trans-portation in Japan has brought about much social efficiency, on the one hand, and on the other, had led to the occurrence of pollution in areas around large-scale transportation facilities. The traffic volume has increased in major cities due to the concentration of population and industry and other factors, making it all the more difficult to solve traffic problems.
b. In order to cope with those problems, measures against sources, on the organization/layout of traffic facilities and measures for sur-rounding areas have been taken, but there remain areas in which it will be difficult to solve problems unless further measures are comprehen-sively promoted.
(2) Comprehensive Promotion of Transportation Pollution Measures
a. Exhaust, noise and vibration of motor vehicles have become problems and there is the need to address further measures against nitrogen oxides and other exhaust gases and noise and vibration.
b. When it comes to measures against aircraft noise, there is the need to promote measures that have been taken against sources and the structure of airports with a view to meeting environmental quality standards. In areas where those measures were not good enough, it is necessary to promote systematic land use around airports (in addition to noise insulation work) for the arresting of noise for dwellings and other measures for the prevention of hazards.
c. In regard to measures against the noise and vibration caused by Shinkansen bullet trains, there is the need to comprehensively promote measures against noise sources, those for the prevention of hazards and systematic land use along the railroads.
Particularly regarding the noise caused by Shinkansen bullet trains, environmental quality standards are not satisfied the way they should. The following measures are to be taken for an early attainment of the environmental quality standards:
(A) Basic Measures against noise sources
(B) In areas where environmental quality standards are exceeded, promote noise insulation work which prevents noise at nearby residences.
(C) Development and use of technology for reduction in noise levels
(D) Promote Proper land use in areas along railway lines (curbs on land use for new dwellings, location of public facilities which are less likely to be functionally affected by noise, and so forth)
6-4-2 Measures Against Road Traffic Pollution
(1) Present Situation
a. In the process where Japan has developed into a sophisticated economic society, the concentration of population and industry and rapid motorization have evolved. A check of changes in the ownership of motor vehicle indicates that it rose about 2.9 times to 60.5 millionat the end of fiscal 1990 from about 21.2 million registered in fiscal 1981 (Fig. 6-4-1). As things now stand, there are no signs of a slowdown in the evolution of motorization. Especially in major cities and urban areas along trunk roads which form arteries of motor vehicle traffic, prob-lems have been posed about air pollution, noise and vibration due to automobile traffic.
b. The findings monitored by road-side air pollution monitoring stations are shown in 6-1. As regards nitrogen dioxide, in particular, there remain many monitoring stations where concentrations exceed environmental quality standards, centering on those in major urban areas, suggesting that the improvements are not the way they should be (Table 6-4-1).
Fig. 6-4-1 Trends in Number of Automobiles Owned
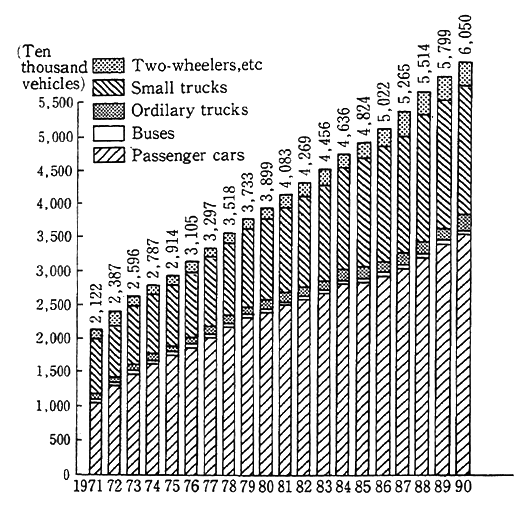
Remarks:1. Prepared on the basis of the Ministry of Transport' s "Statistical Yearbook on Land Transportation."
2. The passenger cars include light passenger cars.
3. The small trucks include light trucks.
Table 6-4-1 Achievement of Environmental Quality Standards for Nitrogen Dioxide at Automobile Exhaust Monitoring Stations in Major Urban Areas (3 Areas with Areawide Total Pollution Load Controls) (FY 1990)

Remarks: Surveyed by the Environment Agency.
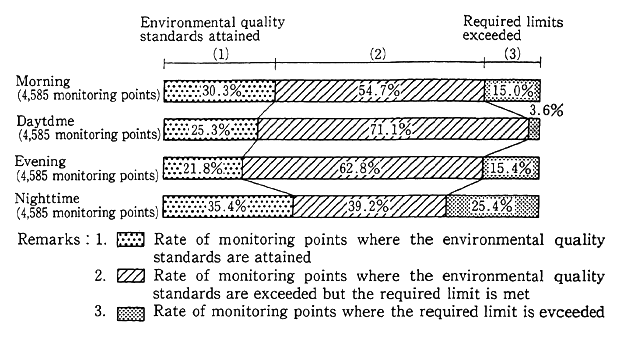
c. A check of the findings monitored at 4,585 monitoring stations in regard to motor vehicle noise suggests that environmental quality standards for noise are achieved at 609 monitoring points (13.3% of all monitoring points), and that the required limits were exceeded (speci-fied inParagraph 1, Article 17 of the Noise Control Law) at 1,425 monitoring points (31.1% of all monitoring points)(Fig. 6-4-2). The cases where environmental quality standards are achieved and those where the limits are exceeded are shown in Fig. 6-4-3, classified by area. In the Class II category areas, where it is necessary to maintain quiet in residential areas, the rates of achieving environmental quality standards were particularly low. The rates classified by hour are given in Fig. 6-4-4. At night, the rate of achieving environmental quality standards is high but, conversely, that of monitoring points where the monitored values are in excess of the required limits is also high. Incidentally, the achievement of environmental quality standards and the degree of exceedance above the required limits have worsened year after year (shown in Fig. 1-1-14, Chapter 1, Part 1). Centering on major cities and urban areas along trunk roads which form arteries of automobile traffic, in particular, there remain many areas where the noise is so significant as to exceed the required limits (Fig. 6-4-5).
Fig. 6-4-2 Attainment of Environmental Quality Standards and Excesses Over Required Limits (FY1990)
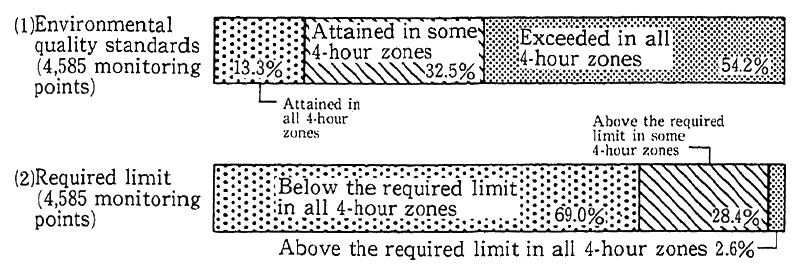
Fig. 6-4-3 Achievement of Environmental Quality Standards and Excesses over Required Limits by Area (FY1990)
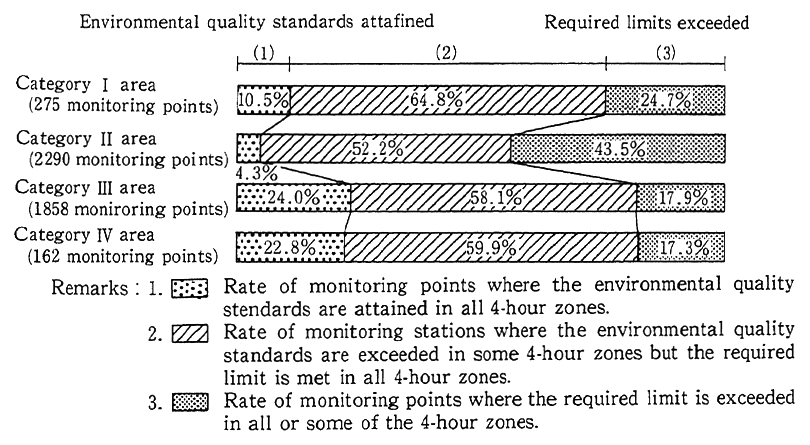
Fig. 6-4-4 Attainment of Environmental Quality Standards and Excesses over Required Limits by Hour (FY )
(2) Trends in Counter Measures
a. Environmental Quality Standards and Measures
In accordance with the provisions of the Basic Law for Environ-mental Pollution Control, environmental quality standards are deter-mined for air pollution and noise. In order to achieve those standards, comprehensive measures are being implemented for the prevention of road traffic pollution.
Air Pollution and Noise Control
* Environment Agency
Determine the quantity of motor vehicle exhaust and the toler-able degree of noise in accordance with the Air Pollution Control Law and the Noise Control Law
* Ministry of Transport Assurance of permissible limits in accordance with the stan-dards for the safety of road transport vehicles under the Road Transport Vehicles Law
* Prefectural Governors In cases where measured levels are in excess of certain limits, prefectural governors require Prefectural Public Safety Com-missions to take measures under the Road Traffic Law. Prefec-tural governors also set forth their views to road managers and so forth on road improvements (Table 6-4-2).
Fig. 6-4-5 Road Traffic Noise Countermeasures
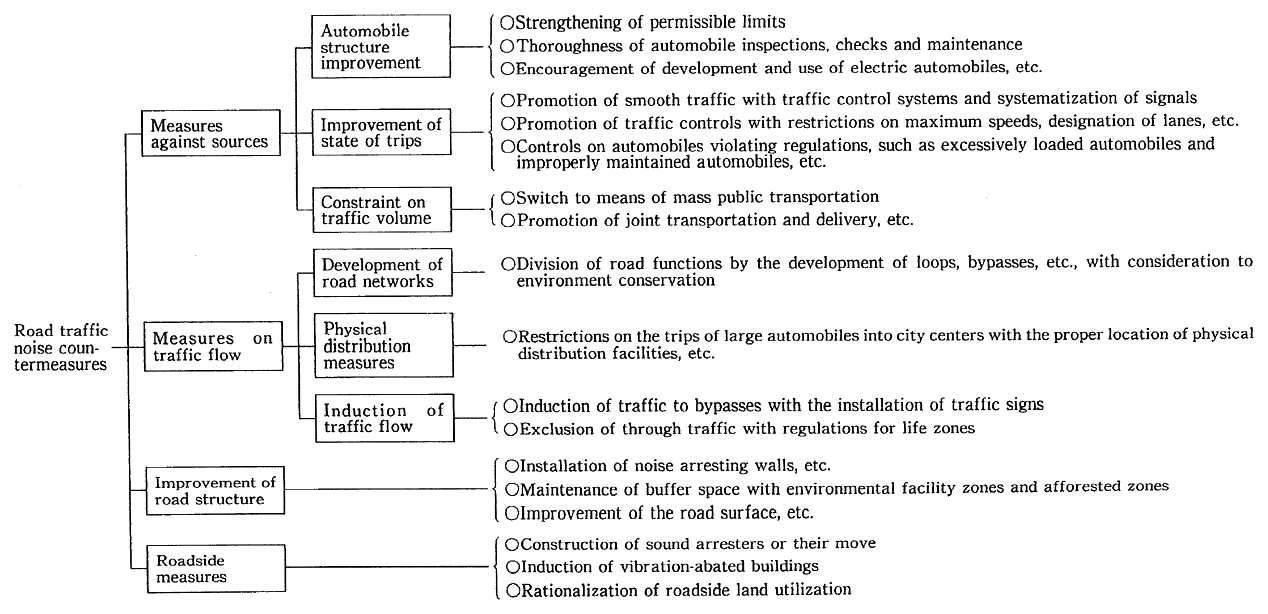
Remarks: Other measures include (1) Implementation of environment quality assessments for the construction and renovation of roads, (2) replenishment of monitoring and surveillance systems, (3) Promotion of the development and research of technology for noise prevention, (4) development of new transportation systems, (5) enlightenment activities for rationali-zation of the use of automobiles, etc.
Table 6-4-2 Demands and Opinions on Automobile Nosise Under Noine Control Law

Remarks: Surveyed by the Environment Agency
As regards vibration, it is stipulated that prefectural governors may be able to demand road managers and the respective Public Safety Commissions to take necessary measures.
Incidentally, no demands for addressing road traffic vibration have been made to road managers and Prefectural Public Safety Commissions in the last several years.
b. Measures
There has been little improvement in the air pollution caused by nitrogen oxides in major cities, because the impacts of each motor vehicle regulations which have been long promoted, have been offset by increases in the volume of motor vehicle traffic and the ratio of diesel vehicles to trucks as a whole. Noise from motor vehicle is generated as a result of a complicated mixture of various factors, including the traffic volume, the types of passing vehicles, their speeds, the road structure and the land use of roadside areas, in addition to that which is generated directly from motor vehicles themselves.
It is necessary to formulate and implement those measures against road traffic pollution in a comprehensive manner (Fig. 6-4-5). For the time being, there is the need to promote measures in the following direction:
(a) Measures Against Nitrogen Oxides and Other Exhaust Gases in Major Cities
(A) Measures on Motor Vehicles Themselves
* Further strengthening of regulations on automobile exhaust gas
* Prompt switch to less-polluting vehicles satisfying the latest control standards
* Studies on, and development and propagation of practical low-polluting vehicles, such as electric vehicles and methanol vehicles
(B) Measures for Automobile Traffic
* Curbs on trips by trucks with improvements in the efficiency of goods transport
* Curbs on the use of passenger cars, such as by the development of mass transport
* Dispersion and smoothing of traffic, such as by the construction of loop roads
(b) Measures Against Road Traffic Noise
(A) Subsidization of the noise insulation work for dwellings, band promotion of the redirection of large-size vehicles to bypasses, etc., and as well as conventional measures in areas with severe situation
(B) Curbs on total volume of automobile traffic with the rationaliza-tion of commodity distribution in major cities; curbs on the flow of large-sized motor vehicles into city centers by the reasonable location of commodity distribution facilities; the rational land use of roadside areas; and redirection of large-size vehicles to bypasses to prevent pollution in cities along major roads
(C) Enhancement on reasonable methods for the maintenance, con-trol and driving of motor vehicles, dissemination of less-noisy vehicles, and the development of various technologies for noise reductions
(c) Development of Systems for Promotion of Measures
From the standpoint of the establishment of systems of close liaison and cooperation among related ministries and agencies and the promotion and support of close approaches in communities with prefec-tural governments taking the lead, the following measures are being implemented in a comprehensive manner.
(A) Comprehensive Measures
* Notification to prefectures of methods to formulate comprehen-sive programs for the prevention of road traffic noise
* Surveys in model areas
* Utilization of environmental pollution programs
(B) Measures Against Nitrogen Oxides
* Promotion of measures based on the plan to reduce nitrogen oxides in the Tokyo-Yokohama and Osaka-Kobe areas
* Promotion of switch to vehicles satisfying the latest exhaust gas regulations, and the implementation of campaign activities against air pollution with the fund established in the Pollution-related Health Damage Compensation and Prevention Associa-tion (PHDCPA) under the Pollution-related Health Damage Compensation and Prevention Law.
(C) Dissemination of Use of Low Pollution Vehicles
* Monitoring surveys on the trial use of electric and methanol cars by local governments
* National subsidies for the promotion of use of low-polluting cars as pollution patrol cars by local governments
* Subsides from the fund in PHDCPA for promotion of use of electric vehicles and methanol vehicles
* Subsidies for the introduction of hybrid buses
* Special measures for levying the motor vehicle tax and the automobile acquisition tax, for electric vehicles and methanol vehicles
* Holding of a fair featuring low-polluting cars at 10 places across the nation
* Trial production of high-performance electric scooters with the use of the fund in PHDCPA
* Use of low-polluting cars by the Environment Agency as official cars during the month of December
* Preparing a guideline for controlling exhaust gases from meth-anol vehicles, especially concerning NOx and formaldehyde
* The Electric Vehicle Propagation Program formulated by the Electric vehicle Propagation Council
(d) Presentation of A New Legislative Bill for Total Quantity reduction of Motor Vehicle Exhaust
In regard to the emissions of nitrogen oxides in three areas where total emission volume controls are in place, a medium-term prospect covering as far as 1993 is formulated, and on the basis of this prospect, a final report was made about curbs on the total quantity of motor vehicle exhaust in the whole areas.
In February 1992, the Central Council for Environmental Pollu-tion Control compiled a recommendation for the establishment of a legal system which is designed to comprehensively promote measures "On the Basic Way in Which a System Ought to Be for Curbs on the Total Quantity of Nitrogen Oxides Emitted from Motor Vehicles' In response to this recommendation, the government submitted to the Diet on March 13, 1992, the "Special Measures Bill for the Total Emission Reduction of Nitrogen Oxides from Automobiles inSpecial Areas".
The bill determines the obligations of the State and entrepreneurs to control air pollution by nitrogen oxides emitted from motor vehicles and calls for implementation of the following measures:
(A) Areas where pollution levels of nitrogen oxides are high, would be designated as special areas, and the State would formulate a policy for curbs on areawide total pollutant loads and the prefectural governors would formulate total-quantity reduction programs.
(B) Special standards for exhaust gas would be determined for trucks, buses and so forth, and for those which could not meet the standards, measures would be taken, such as the refusal to automobile inspection certificates.
(C) Measures would be taken to ask entrepreneurs and so forth to promote the reasonable use of motor vehicles.
(D) In addition, Necessary provisions will be prepared for a system of consultation, etc., with related institutions involved in the development and propagation of low-polluting vehicles, the offer of aid in going in for substitutes for automobiles and the formulation of areawide total pollutant load reduction programs.
(3) Improvements in Motor Vehicle Structure
a. Measures Against Exhaust Gas
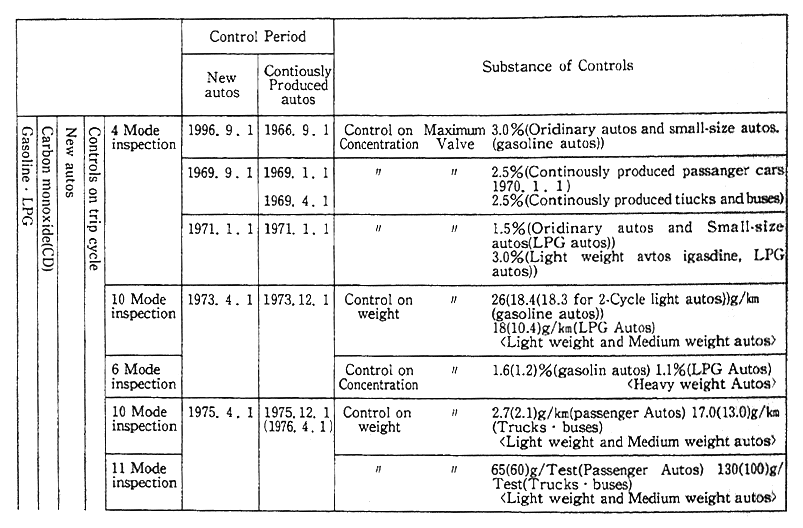
As regards nitrogen oxides emitted from motor vehicles, controls began on gasoline and LPG vehicles in fiscal 1973 and on diesel automo-biles in fiscal 1973.. On gasoline and LPG passenger cars, controls were strengthened in fiscal 1978, coming out with a strict standard in which the emission should be reduced to less than one-tenth of what was emitted during the years when no controls had been exercised.
Controls on motor vehicles (such as trucks and buses) other than gasoline and LPG passenger cars were strengthened step by step in 1975, 1977 and 1979-83 after they were introduced in fiscal 1973-74.
As regards the black diesel smoke emitted from diesel motor vehicles, controls (with the degree of pollution not more than 50%) put into force on new vehicles in 1972 and existing vehicles in use in 1975.
As we have just seen, controls on exhaust gas from motor vehicles have been strengthened step by step, but it is necessary to further reduce the emission of nitrogen oxides and particulate matter in major cities and other areas where traffic volume is significant. For this reason, controls had been strengthened by 1991, such as 15% reductions in the emission of nitrogen oxides from large-size diesel trucks and controls on light vans and other lightweight trucks of the sort which would correspond to passenger cars. Controls were also started on compact diesel vehicles in 1991 and mid-sized diesel vehicles in 1992 with 30% reductions in the emission of nitrogen oxides.
In December 1989, the following conclusive recommendation was prepared. It is stipulated that the contents of this recommendation shall be enforced with target values set for a short term (within five years) and a long term (within 10 years). (Tables 6-2-1 and 6-4-3)
Table 6-4-3 Controls on Automobile Exhaust Gas in Historical Perspective
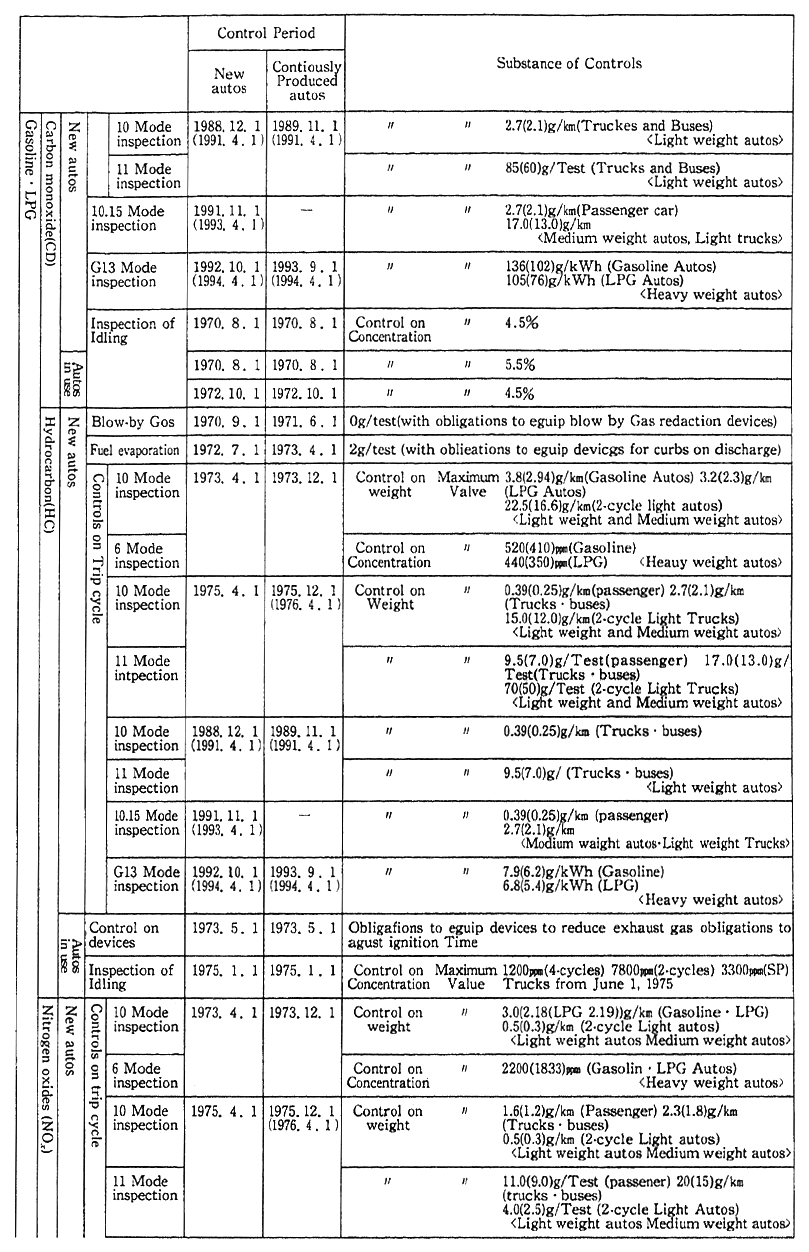
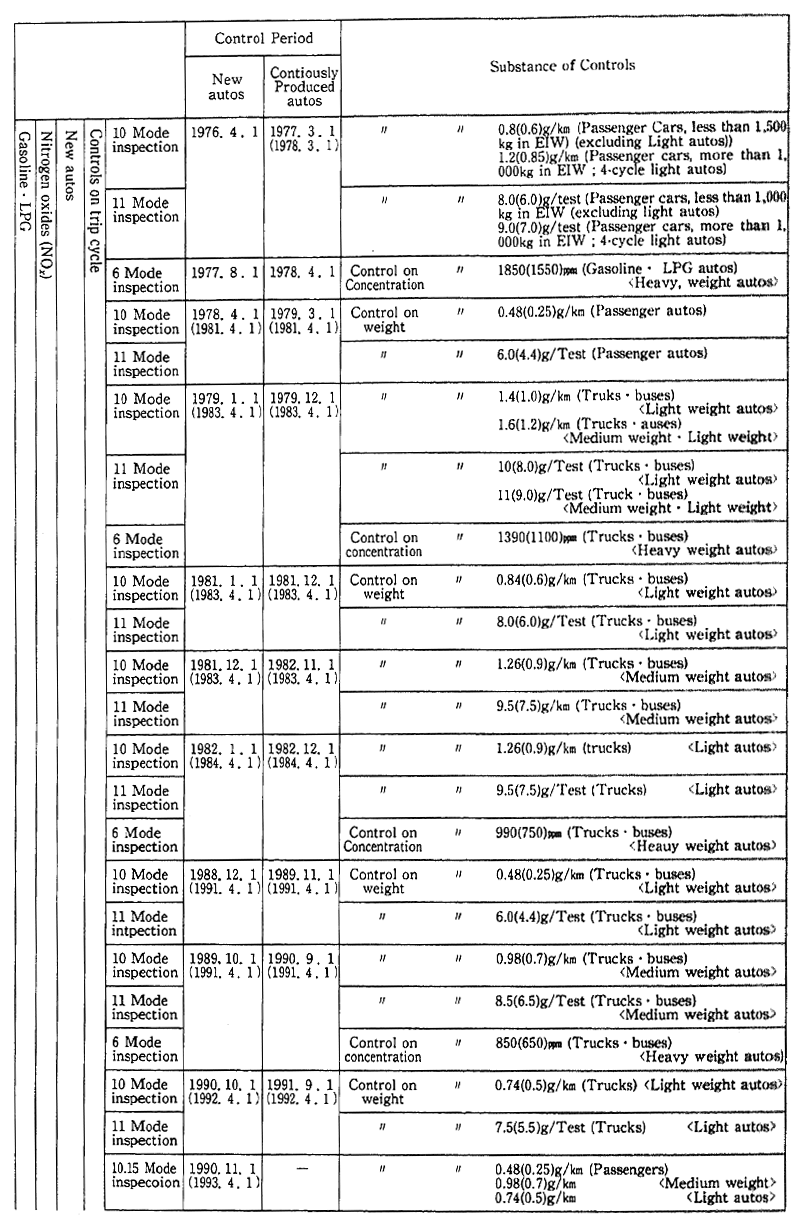
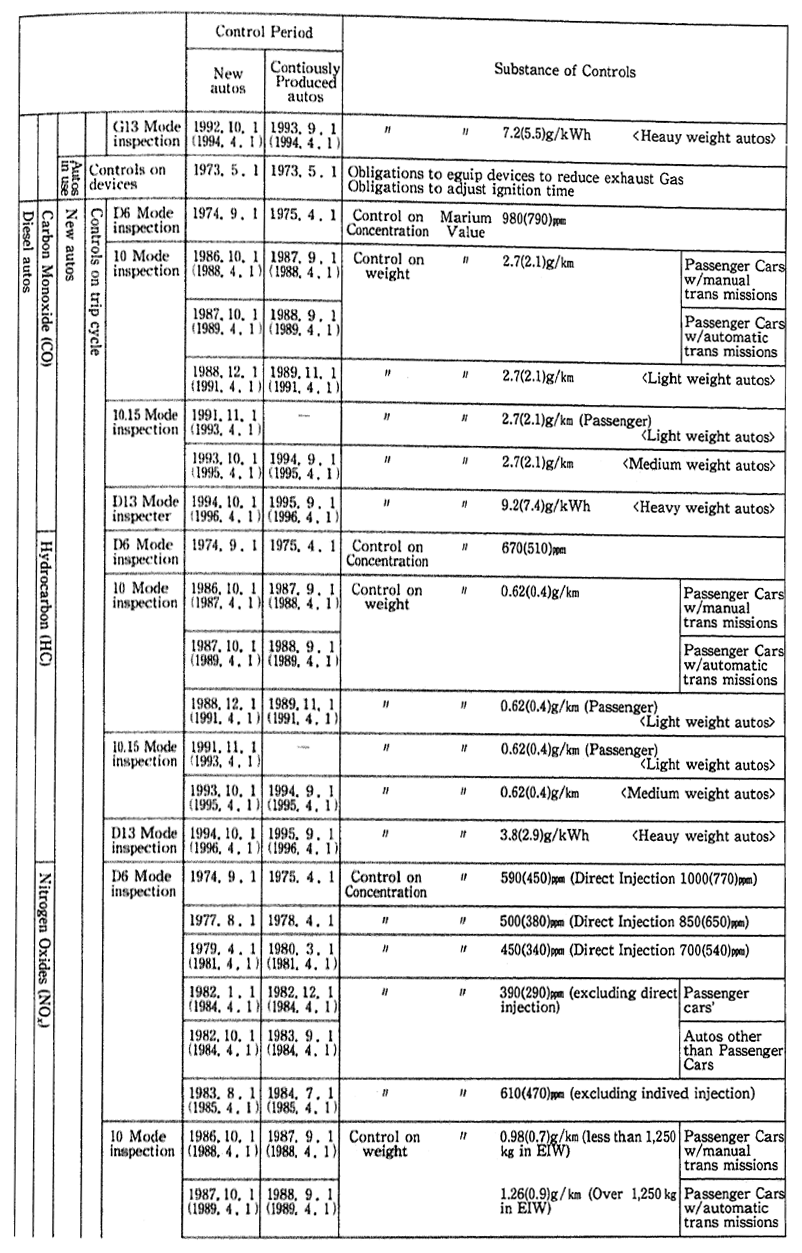

(a) Large Reductions in Emission of Nitrogen Oxides
(A) 30-60 reduction in the emission levels of nitrogen oxides from diesel vehicles
(B) Reduction of the emission level of the direct injection type to the level of the chamber type
(C) Setting of reduction targets designed to reduce diesel vehicles emission to the levels of gasoline vehicles
(b) Drastic Reassessment of Particulate Matter Countermeasures
(A) Reduction of more than 60% in the emission levels of particulate matter from diesel vehicles
(B) 50% reduction in the emission levels of black diesel smoke
(c) Reduction in Sulfur Content of Light Oil
Reduce sulfur content in light oil to a level of one-tenth or so of the convert content.
(d) Review of the driving cycle for exhaust emission test
In accordance with this recommendation, the driving cycle were changed in 1991, and in March 1991, the Environment Agency revised the permissible limits of automobile exhaust gas and the Ministry of Transport revised safety regulations for road vehicles. As regards long-term targets, Environment Agency made the first technical assess-ment based on the hearing of manufacturers. According to the assess-ment, it is possible to achieve long-term targets in 10 years after the recommendation, but as things now stand, it is difficult to determine the precise year of achievement. While encouraging car makers to develop technology, it was decided to continue to make technical assessments and achieve the targets as early as possible.
In order to reduce the content of sulfur in light oil and abandon outdated diesel trucks and buses and to encourage shift to trucks and buses which will satisfy the latest controls on exhaust gas, measures for tax cuts and various systems of low-interest loans have been added or newly established.
b. Measures Against Noise
As measures designed to reduce the magnitude of the noise generated by motor vehicles by improving their structure, automobile noise controls are in force for all motor vehicles and motorcycles. The noise controls are classified into three types--accelerated running noise which is the maximum from vehicles, steady running noise, which is generated during constant speed, proximity stationary noise which can be easily measured in the road-side.
Controls on new vehicles have been strengthened since 1971. Since the latest regulations are 6-11 hours stricter than those in 1971 (75-92% reduction in terms of energy level), it is expected that the noise level will fall as the use of vehicles which satisfy new controls spread. The proximity stationary noise controls, which represent a simple monitor-ing method on the road, were started in 1986. They are instrumental in controlling illegally altered automobiles.
However, as the achievement rate of environmental noise quality standards had remained low due to increases in the automobile traffic volume and other factors, the Central Council for Environmental Pollu-tion Control was asked about "Measures for Reductions in the Noise of Motor Vehicles in the Future" in June 1991, and deliberations are currently progressing at the council. On the basis of its recommenda-tion, it has been decided to implement measures for reductions in the noise of motor vehicles themselves.
(4) Traffic Control
It is important, for the sake of reductions in the air pollution, noise and vibration caused by motor vehicle traffic, to direct and maintain traffic in a safe and smooth manner. The measures taken by police from the standpoint of road supervision for the prevention of road traffic pollution are as follows:
a. Measures for Arterial Roads
(A) Reduce number of departures and steps at intersection using the traffic control system, advanced traffic signals, improvement of func-tions for collecting and offering traffic information.
(B) Distribute and guide traffic flows using reductions in the number of departures and stops at intersections.
b. Measures in cities with a population more than 30,000
(A) Implement the "life zone regulation", traffic regulation in residen-tial area including off-limits to large sized motor vehicles and limits on the maximum speed.
(B) Shift to the use of public mass transit, such as by designating bus lanes and by introduction of the park and ride system.
(C) Introduce high-speed driving restraining system and regulate the driving with extremely high noise and speed
(D) Regulate overload vehicles
(5) Improvements in Road Structure and Roadside Environment
The measures as seen from the standpoint of the road structure are as follows:
(A) Diversion and smoothing of road traffic with the development of bypasses and loops
(B) Elimination of places with traffic congestion, such as by improve-ment of road structure and development of new transport system
(C) Research and development of new commodity distribution system which will utilize the space under arterial roads
(D) Development of environmental facility zones and noise arresters, planting trees along roads, improvement in road surface
The roadside measures are as follows:
(A) Sharing of costs for the construction of buffer structures, subsidi-zation of the construction of noise arresters and non-interest loans for land purchases by municipalities based on the program provided by the Law Concerning the Development of Areas Along Arterial Roads
Five routes with a total length of about 103 kilometers were taken up as subjects as of the end of fiscal 1991. Of them, projects were conducted for 56.4 kilometers in 26 districts, including 0.8 kilometer in Nerima Ward along the Haneda-Takaido-Iwabuchi Route (Loop No. 8).
(B) Subsidization of the noise insulation work for dwellings surround-ing national expressways
The soundproofing for about 44,000 houses was done as of the end of fiscal 1991.
(C) Low-interest financing for construction of buildings helpful to improvement of the oad-side environment since fiscal 1985
(D) Enforcement of Guidance and Control on Trucks with overload, Etc.
(6) More Efficient Commodity Distribution
The following measures are in effect for the formation of traffic systems which will not give rise to traffic pollution.
(A) Formulation of preferential tax measures and financial support measures necessary for development of the infrastructure to encourage a shift in transport from trucks to less-polluting means of mass transit, such as railway and shipping
(B) Encouragement of the use of business trucking which are superior in freight transit efficiency than owner operated trucks, and promotion of combined loading by business trucks
(C) Consolidation and reasonable location of warehouse complexes, truck terminals, etc.
6-4-3 Measures Against Aircraft Noise
The use of jet aircraft has raised the convenience of transport remarkably, on the one hand, and has posed issues about the noise of aircraft around airports. Particularly in conjunction with urbanization around airports, lawsuits were instituted for a ban on landings and take-offs at night and the reparation of damages, at Osaka International Airport and Fukuoka Airport, which are civilian airports, and Komatsu Air Base, Yokota Air Base, Atsugi Air Station and Katena Air Base, which are defense facilities. The lawsuits other than that which is related to Osaka International Airport have yet to be settled. As regards Osaka International Airport, the mediation was concluded and it was decided in December 1990 to retain the airport as a result of the adjustment of views between the mediators' group, which was formed by residents around the airport and other people, and the related local governments, and to continue implementing measures against noise.
(1) Establishment of Environmental Quality Standards
a. Environmental Quality Standards
The environmental quality standards (December 27, 1973), which would serve as the targets of various measures to prevent aircraft noise pollution, are so designed that the weighted equivalent continuous perceived noise level (WECPNL) is set, according to the classification of areas, at less than 70 for areas which are used only for houses and less than 75 for areas where there is the need to maintain a normal mode of life.
As of the end of fiscal 1990 the classification of areas had been made by prefectural governors for areas around 54 airports in 31. prefectures.
b. Achievement of Environmental Quality Standards
When it comes to airports and so forth for which the deadline for the achievement of environmental quality standards or for the achieve-ment of 10-year improvement targets came at the end of December 1983, the environmental quality standards had yet to be achieved with the exception of some of them. But there are signs of an overall improvement in areas around Osaka, Fukuoka and other airports from the time when the environmental quality standards were put into force, insofar as the noise was concerned.
As regards heliports and so forth whose numbers are increasing across the nation, there are many which are so small in scale that environmental quality standards cannot be applied. The Environment Agency notified local governments in September 1990 of a guideline which would contribute to environmental conservation.
(2) Measures Against Noise Sources
Insofar as measures against sources are concerned, the introduc-tion of less-noisy aircraft models and the implementation of operation systems with reduced noise are being promoted. These are basic and the most effective measures.
a. Introduction of Less-Noisy Aircraft Models, Etc.
A ban on the operation of aircraft whose noise exceeds prescribed levels has existed since 1975. Along with the introduction of less-noisy models (such as the B-767), the decommissioning of noisy aircraft is being stepped up. In principle, the operation of highly noisy models, such as B-707 and DC-8, was prohibited, in January 1988 and the last B-727 retired from domestic airlines in April 1990.
b. Controls at Take-offs and Landings
The following controls are exercised at take-offs and landings except emergencies.
(A) New Tokyo International Airport at Narita and Tokyo Interna-tional Airport at Haneda A ban on the take-offs and landings of jets from 11 p.m. to 6 a.m.
(B) Osaka International Airport
A ban on the take-offs and landings of jets from 10 p.m. to 7 a.m.
No schedules may be set for regular flights after 9 p.m.
Since October 1977, the frequency of take-offs and landings has been set at 370 times a day, including 200 times for jets for Osaka International Airport. In December 1988, an additional permit of jet take-offs and landings was set (50 times a day) as the YS-11s would be replaced by new jet models. This permit is a transitional measure until a new international airport of Kansai will open.
c. Flight Operations with Less Noise
Depending on conditions for the location of each airport, use of a specific running and air route by which less noise would be reached the ground, a chandelle method, a rapid climb method, a low-flap angle take-off and landing method and a delayed flap approach are adopted in order reduce aircraft noise.
(3) Measures for Areas Around Airports
For areas which will not be free from the noise caused by aircraft even when measures against noise sources are taken, some measures are taken in accordance with the Law Concerning the Prevention of Haz-ards Caused by Aircraft Noise in Areas Around Public Airports. With * Tokyo International Airports at Haneda, Osaka International Airport, Fukuoka and 13 other airports included in those measures, the noise insulation works are subsidized for schools, hospitals, dwellings and other facilities for joint use. In addition, compensation for moves is made, green buffer zones are developed, and television subscription fees are subsidized under the Law (Table 6-4-4).
Also for Osaka International Airport and Fukuoka Airport which are designated according to the above mentioned Law, the Organization for the Development Around the Airport carries out urban renewal projects, projects for the development of alternative sites and other projects, as their near-by areas are urbanized.
As a result of the execution of projects for surrounding areas, the noise insulation work for dwellings was almost completed in fiscal 1985, making it possible to retain indoor environment of the kind which is specified in the Environmental Quality Standards Associated With the Noise of Aircraft.
Table 6-4-4 Measures for Areas Around Airports
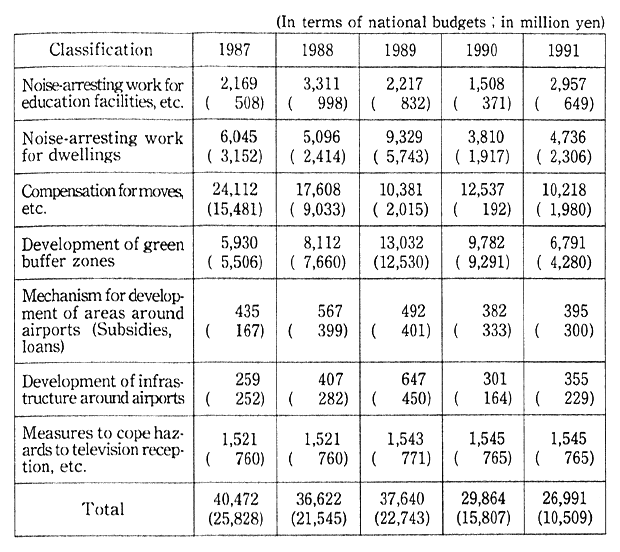
Remarks:1. Surveyed by the Ministry of Transport.
2. the figures in parentheses are the amount of budgets for Osaka International Airport.
3. The expenditure for surveys are excluded.
(4) Measures Against Aircraft Noise Around Defense Facilities
When it comes to aircraft noise in areas around airfields in use by the Self-Defense Forces and the U. S. Armed Forces, it is difficult to work for reductions in the engine noise in light of the essential function and raison d'etre of the Self-Defense Forces and the U.S. Armed Forces. The use of noise mufflers, controls on flight patterns and so forth are main measures. In measures against noise sources and those on opera-tions by the U. S. Armed Forces in Japan, cooperation is sought through the U. S.-Japan Joint Committee, etc.
The surrounding-area measures associated with the airports in use by the Self-Defense Forces and the U. S. Armed Forces, center on the Law Concerning the Improvement of the Living Environment around Defense Facilities in subsidizing the noise insulation works for schools, hospitals, dwellings and so forth, compensating for the move of buildings, and subsidizing the land purchases, the development of green buffer zones and television subscription fees, among others (Table 6-4-5).
Table 6-4-5 Projects Associated with Measures Against Noise around Defense Facilities
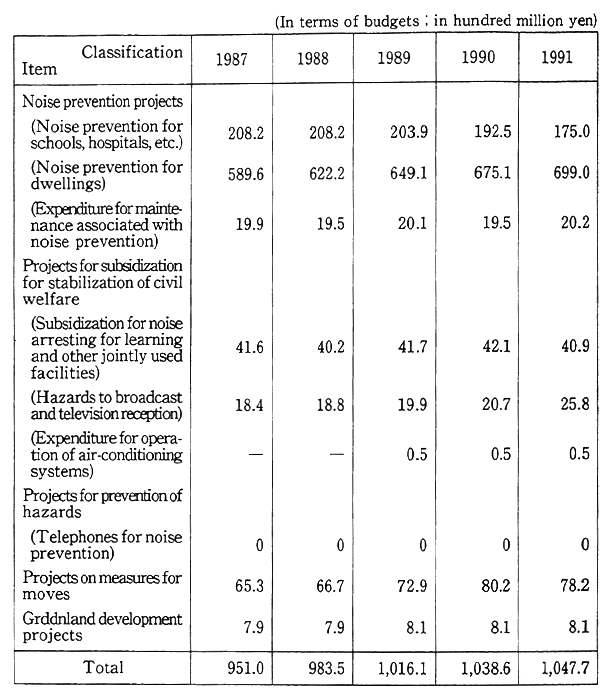
Remarks:1. Surveyed by the Defense Agency.
2. The figures in the table include some of those for measures other than those against aircraft noise.
3. As each figure in rounded to the nearest whole number, they do not coincide is some cases with the totals in terms of fractions.
As of the end of fiscal 1991, the subsidization of the noise insula-tion works for dwellings and other measures were implemented for areas around 25 airports.
6-4-4 Measures Against Noise and Vibration of Shinkansen Trains
The Shinkansen system of bullet trains has developed as a means of high-speed mass transport since the Tokaido Shinkansen Line was put into operation in 1964. As regards the Nagoya area along the line, a lawsuit was filed in March 1974, in attempts to demand the stop of noise and vibration pollution and the reparation of damages. In April 1986, the case came to an amicable settlement, including a further promotion of measures against noise and vibration sources.
(1) Establishment of Environmental Quality Standards
a. Environmental Quality Standards
In the "Environmental Quality Standards Associated With the Noise of Shinkansen Trains" (July 29, 1985) which serve as targets for measures against the noise of Shinkansen trains, it is stipulated that the noise level shall be less than 70 phons for areas which are to be used primarily for housing purposes and less than 75 phons for areas which are to be used for commercial, industrial and other purposes, and that efforts shall be made for the achievement or maintenance of those levels.
It is also stipulated that the classification of trackside areas shall be made by prefectural governors, and it is done by all prefectures (21) through which Shinkansen railway lines run.
The Government approved at its Cabinet meeting in March 1976 the Outline of Measures Against the Noise of Shinkansen Trains in which basic matters were stipulated. In conjunction with the decentrali-zation and privatization of the Japanese National Railways, the Cabinet once again approved the Promotion of Measures Against the Noise of Shinkansen Trains after the Reorganization of the Japanese National Railways in March 1987, As for the vibration generated by Shinkansen Trains in March 1976, the Director-general of the Environment Agency required the Minister of Transport on "Urgent Measures for Environ-mental Conservation to cope with Vibration by Shinkansen Trains."
b. Achievement of Environmental Quality Standards
A check of the achievement of environmental quality standards concerning noise for the Tokaido and Sanyo Shinkansen Lines and the Tohoku and Joetsu Shinkansen Lines (areas north to Omiya) indicates that there are a considerable number of areas where the environmental quality standards are not achieved, as indicated in Table 1-1-8, Chapter 1, Part 1. Given this situation, the Environment Agency required related institutions to further promote measures, such as the reduction of noise levels to less than 75 phons, in areas very much densely populated along the Tokaido and Sanyo Shinkansen Line and in "densely populated areas" along the Tohoku and Joetsu Shinkansen Lines (called "areas with the noise level set at less than 75 phons") by the end of fiscal 1990. In fiscal 1991, the Environmental Agency checked the degrees to which the measures based on those requirements had been achieved. The findings showed that the noise levels in the area with the noise level set at less than 75-phon featured a high of 78 phons, higher 75 phons, but that the average noise level of all points remained at 73.7 phons. The points where the target of 75 phons had been accomplished accounted for 76% of all points (Table 6-4-6) -The Environment Agency required related institutions to take necessary measures to attain the target level of 75 phons, to maintain the Environmental Quality Standards where achieved, and to expand "75 phons areas" and take measures to achieve the target level of 75 phons in expanded areas.
Table 6-4-6 Noise in areas with "75-phons Mesures" Taken
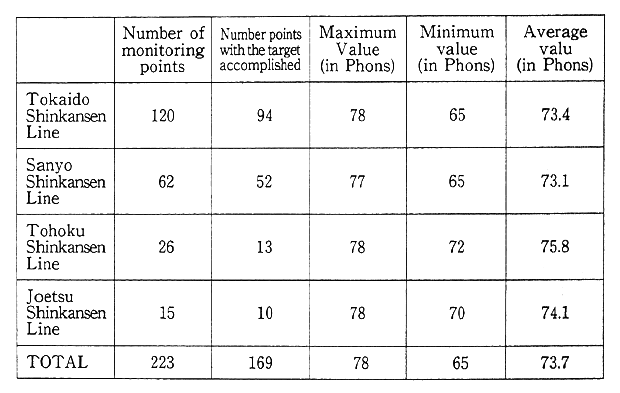
Note 1: Number of points with the target accomplished: Number of monitoring points witregistered at less than 75 phons.
2: Rate of compliance with 75 phons(%): Number of points with the target accompli of montoring points ×100.
As regards vibration, a check of the degrees to which the guide-line value (70 dB) based on the aforementioned requirement of the Director-general of the Environmental Agency was achieved, revealed that the guideline value was met in most areas, minus some areas closer to the railway tracks, along the Tokaido and Sanyo Shinkansen Lines after the revision of the train schedules in November 1986, and that the guideline value (70 dB) was met at all points along the Tohoku and Joetsu Shinkansen Lines.
(2) Implementation of Measures
East Japan Railways, Japan Railways Tokai and West Japan Railways have implemented the following measure against noise sources, against vibration sources and for prevention of hazards again t daily life:
a. Measures Against Noise and Vibration Sources
* Tokaido and Sanyo Shinkansen Lines--Promotion of comprehensive measures against noise sources, such as strengthening of the maintenance of tracks and cars and the laying of balance mats
* Tohoku and Joetsu Shinkansen Lines--Construction of reversed L-type noise arresting walls, installation of additional noise absorbers, and the deeper shaving/smoothing of rails.
b. Measures for Noise Prevention
The noise insulation works have been subsidized for houses in areas with the noise level in excess of 75 phons and for schools, hospitals in areas where the noise level exceeds 70 phons, and measures are taken for all houses for which the implementation of measures is requested. The insulation works against vibration for houses etc. in areas with the vibration level is excess of 70 dB, have been subsidized and the moves from these areas have been compensated. These measures have been taken for all houses for which these measures are required.
(3) Noise and Vibration of Conventional Railway Trains
Also as regards the so-called conventional railway trains other than the Shinkansen lines, problems are posed, such as complaints and demands about their noise and vibration. In particular, problems have cropped up about noise and vibration as the Tsugaru Strait Line was opened in March 1988 and the Seto Ohashi Line in April of the same year, and a wide variety of measures has been taken to cope with those problems.
6-5 Noise--Present State and Measures
6-5-1 Present state of Noise
Of all various pollutants, noise is most deeply tied in with every-day life, and there are all kinds of sources, so that it produces the greatest number of complaints in every year.
The number of complaints by type of generation source is shown in Fig. 6-5-1.
Fig. 6-5-1 Breakdown of Griavances about Noise
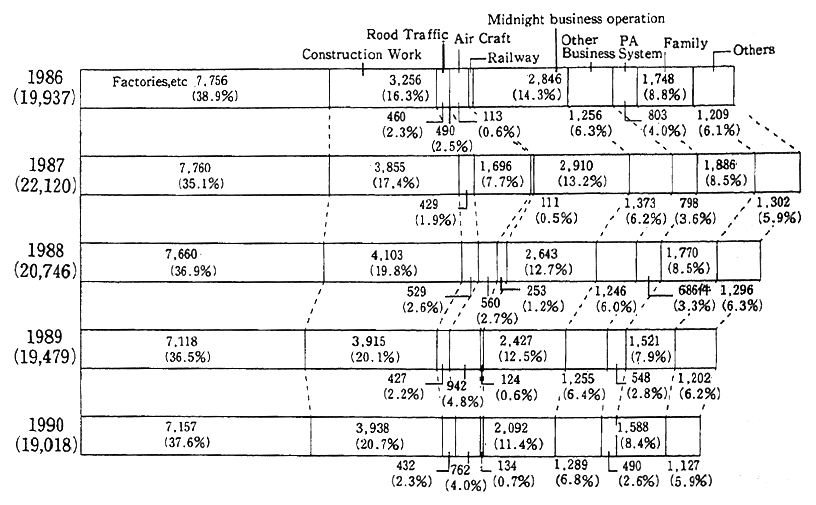
Remarks:1. Surveyed by the Environment Agency (which has tabulated grievances filed with local governments)
2. In computing the number of grievences,grievances about one and the same noise source are considered as one grievance,even when a number of grievances have been filed about it.
6-5-2 Measures Against Noise
(1) Environmental Quality Standards Associated with Noise
Environmental quality standards for noise were formulated on May 25, 1971. Under the standards, the standard values are classified into two sets of values--one for general areas and the other for roadside areas.
For general areas, the standard values are set, depending on the type of area and the classification of time, between "less than 35 dB (A)" during the "nighttime" for "areas for which calmness particularly required" and "less than 60 dB" during the "daytime" for "areas which include commerce, and industrial uses, with a mix of a considerable number of dwellings." For roadside areas, the stand rd value are higher than those for general areas, (or 5-10 phons), and are set, d end-ing on the number of lanes and other factors.
Prefectural governors designate areas to which the classification is applied. The designation of areas was made for 588 cities ,836 towns, 95 villages and 23 special wards in 47 prefectures as of the end of fiscal 1990.
(2) Controls Under Noise Regulation Law
Controls under the Noise Regulation Law are those on the noise which is generated by the operation of factories and other types of work sites as well as construction work in areas which ar designated by prefectural governors and the mayors of cities designated by the Local Government Law.
The designation of areas was done for 652 cities, 1,212 towns, 182 villages and 23 specialwards in 47 prefectures as of the end of fiscal 1990, accounting for about 63% of all municipalities across the nation.
a. Noise of Factories and work sites
Controls exist for factories and work sites where metal fabrica-tion machinery and other facilities specified by Cabinet Order are installed in designated areas (hereinafter referred to as "specified fac-tories"), and the number of specified factories, etc., on which controls were exercised in designated areas stood at 198,019 as of the end of fiscal 1990.
Prefectural governors are empowered to make recommendations for changes in programs and for improvements and issue orders for improvements. There were 6 cases in fiscal 1990 where recommenda-tions for improvement were made. There were 1,546 cases in which administrative guidance was made after the receipt of reports and other inquiries in response to complaints and so forth.
b. Noise from Construction Work
Of all construction work in designated areas, controls are exer-cised on specified construction work, (such as pile driving), which are determined pursuant to Cabinet Order. There were 45,246 cases in fiscal 1990 where reports were filed about the execution of specified construc-tion work.
Prefectural governors are empowered to take measures, such as recommendations or orders for improvements, in relation to noise prevention methods and so on, but neither recommendations nor orders were made for improvements in fiscal 1990. There were 895 cases in fiscal 1990 when administrative guidance was made after the receipt of reports and other inquiries in response to complaints and so on.
(3) Neighborhood Noise
In recent years, it has become an important task to cope with neighborhood noise, such as noise from late night business operations, noise caused by loudspeaker announcement, and noise from everyday activities. Currently, controls have been exercised under administrative decrees of local government on noise from late night business operations in 44 Prefectures and noise from caused by loud speaker announcement also in 44 prefectures.
6-6 Vibration--Present State and Measures
6-6-1 Present State of Vibration
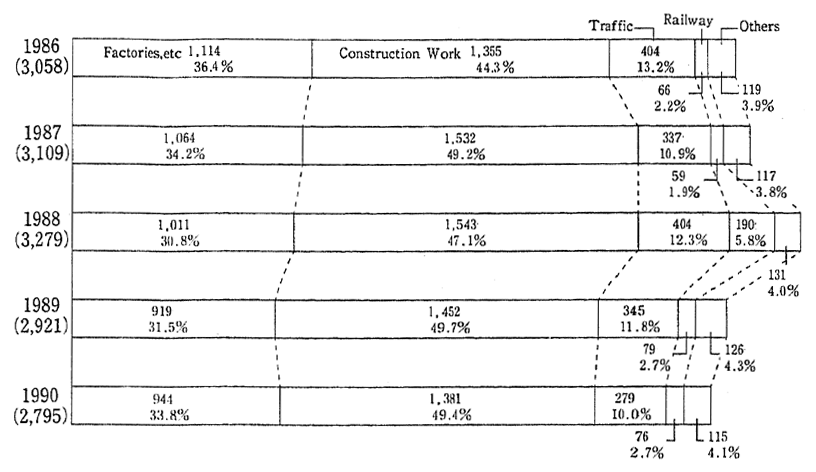
Of all pollutants, vibration is most deeply tied in with everyday life along with noise. The breakdown of, and the fluctuations in, the number of grievances about vibration are given in Fig. 6-6-1.
Fig. 6-6-1 Breakdown of Griavances about Vibration
6-6-2 Measures Against Vibration
(1) Controls Under Vibration Regulation Law
In accordance with the Vibration Regulation Law, prefectural governors and the mayors of cities designated by the Local Government Law are empowered to designate areas and to control vibrations gener-ated in conjunction with the performance of business and construction work at factories and work sites in designated areas, and take measures in response to requests for coping with road traffic vibration.
As of the end of fiscal 1990, vibration control areas were designat-ed in 641 cities, 844 towns and 104 villages in 47 prefectures, accounting for about half of all municipalities across the nation.
a. Vibration at Factories and Work Sites
In designated areas, controls are exercised on factories and work sites where metal fabrication machines and other facilities specified in administrative decrees are installed (hereinafter referred to as "speci-fied factories"), and the number of specified factories, etc., as of the end of fiscal 1990 was 111,844.
Prefectural governors (and commissioned mayors of municipal-ities; this also holds true in the subsequent sentences) are empowered to make recommendations for plan changes or to order on methods of vibration abatement and so forth. During fiscal 1990, neither recommen-dations nor orders were made as measures under the Vibration Regula-tion Law. There were 266 cases where administrative guidance was provided on the prevention of vibration after the collection of reports and other surveys in response to complaints.
b. Vibration by Construction Work
Of all construction in designated areas, controls are exercised specifically on pile driving and other construction work specified by administrative decrees. There were 30,504 cases in which reports were filed about the execution of specified construction work in fiscal 1990.
(2) Measures Against Infrasound
There are more than 20 cases across the nation in which In-frasound which are barely audible by the human ear gives rise to the vibration of glass windows, paper sliding doors (Shoji) and so on (Table 6-6-2).
From the surveys and research that have been performed, no data have been acquired which demonstrate that the human body is affected by Infrasound of the levels existent in the normal environment.
Table 6-6-1 Breakdown of Grievances about Low-Frequency Vibra-tion
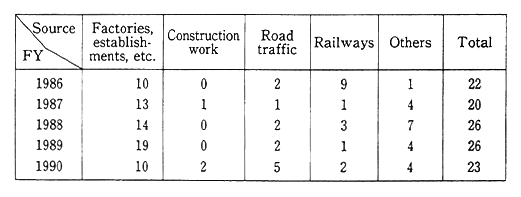
Remarks:1. Surveyed by the Environment Agency (which han tabulated grievances filed with local governments).
2. In computing the number of grievances, grievances about one and the same vibration source are considered as one, even when a number of grievances have been filed.
6-7 Offensive Odors--Present State and Meaures
6-7-1 Present State
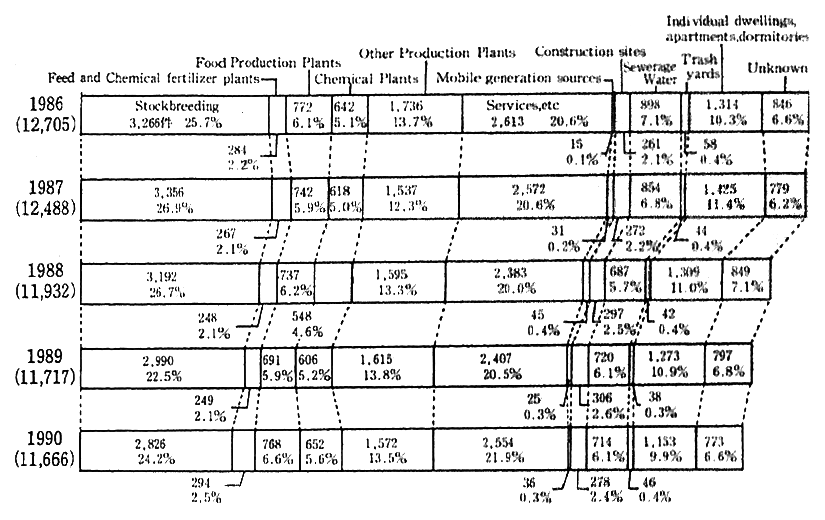
In recent years, there hay be n ign of drop in the number of complaints about offensive odors. The number stood at 11,666 in fiscal 1990. By business type, the number wasgreatest for the livestock indus-try and agriculture with about 24%, followed by service and other industries with about 22% (Fig. 6-7-1).
Fig. 6-7-1 Breakdown of Grievances about Offensive Odor
6-7-2 Preventative Measures
(1) Enforcement of Offensive Odor Control Law
Controls under the Offensive Odor Control I aw are such that prefectural governors (and mayors of cities designated by the Local Government Law) designate areas where controls will be exercised on the emission of offensive odor and formulate control standards.
As of the end of fiscal 1990, areas were designated in a total of 1, 460 municipalities, including 548 cities, 783 towns, 106 villages and 23 special wards (accounting for about 45% of all municipalities across the nation).
Prefectural governors (and commissioned mayors of municipal-ities) are empowered to make recommendations or issueorders for improvements to people who operate business establishments so that they may take measures for the prevention of offensive odors. In fiscal 1990, there were four cases where recommendations for improvements were made but there were no cases in which orders for improvements were issued. In addition to the above measures based on the law, there were 5,246 cases in which administrative guidance was provided to odor-generating business establishments in control areas.
(2) Refinement of Measures
Refinement of the following measures is being carried out:
(A) Detection of offensive odor which originates from uncontrolled substances
(B) Improvements in methods for the assessment of odors
(C) Collection of findings on technology for the prevention of odors, technological application to model business establishments and enforce-ment of dissemination projects
(D) Investigation of measures against the generation of Urban Type odors, such as by the service industry
Chapter7. Water Pollution--Present Situation and Measures
7-1 Water Pollution--Present Situations and Factors
7-1-1 Present Situation
The outline of water pollution based on the findings of surveys on the water quality of public waters across the nation in fiscal 1990 is as follows:
(A) As regards pollutants toxic to human health, the rate of samples which exceed environmental quality standards is exceedingly low. In regard to health related pollutants, such as cadmium, the percentage of in excess of environmental quality standards was 0.01%. For trichlor-oethylene and tetrachloroethylene, the percentage of samples in excess of target values was 0.04% (Table 7-1-1).
Table 7-1-1 Rates of Hazardous Substances Exceeding Enviroumental Quality Standards
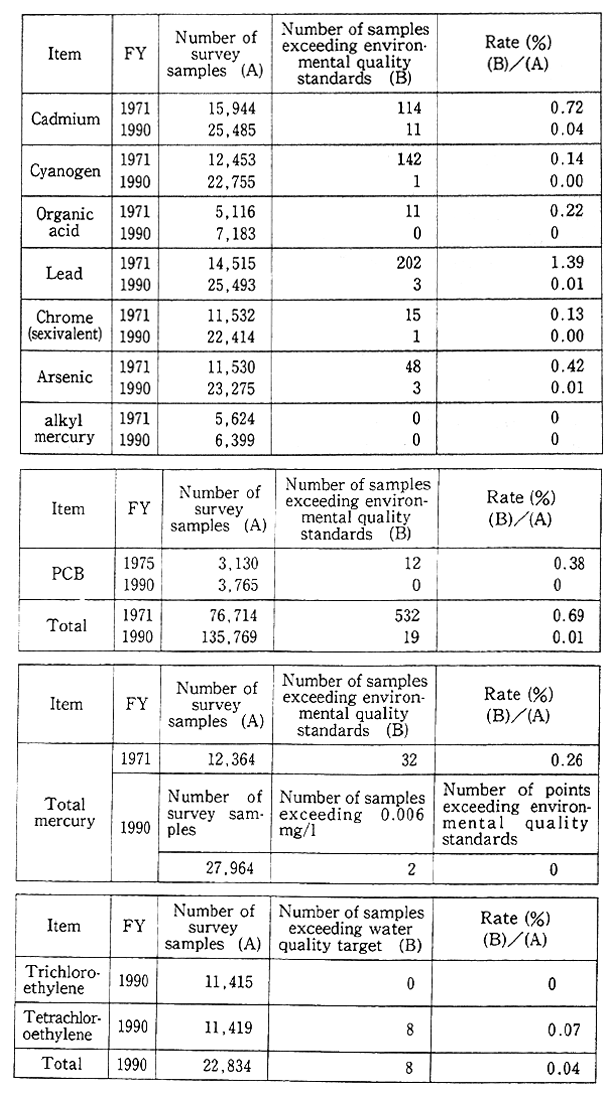
Remarks:1. Surveyed by the Environment Agency.
2. The total for FY1971 does not include PCB.
(B) As regards the water quality associated with conservation of the human living environment, the rate of achieving environmental quality standards was only 73.1% of 3,103 water bodies (including 2,389 rivers, 129 lakes and reservoirs and 585 sea regions), suggesting that about one-fourth of all water bodies did not satisfy environmental quality standards. By type of water body, rivers accounted for 73.6%, lakes and reservoirs 44.2% and sea regions 77.6%, and the achievement rate was low particularly for enclosed water areas, such as lakes and reservoirs, bays, inland seas and so on and medium and small rivers in cities, (Table 7-1-2, Fig. 7-1-1 and Fig. 7-1-2).
(C) As regards other forms of water pollution, pollution by ground water, a wide range of pollution by organic tin compounds, the pollution of public waters by the outflow of hazardous substances due to acci-dents, the long-term pollution of water due to the structure of dams, oxidation due to the natural factors of rivers, lakes and marshes, and the effects brought about on the environment by warm waste water from large-scale power generation plants pose problems.
Fig. 7-1-1 Pollution of Major Rivers (FY 1990)
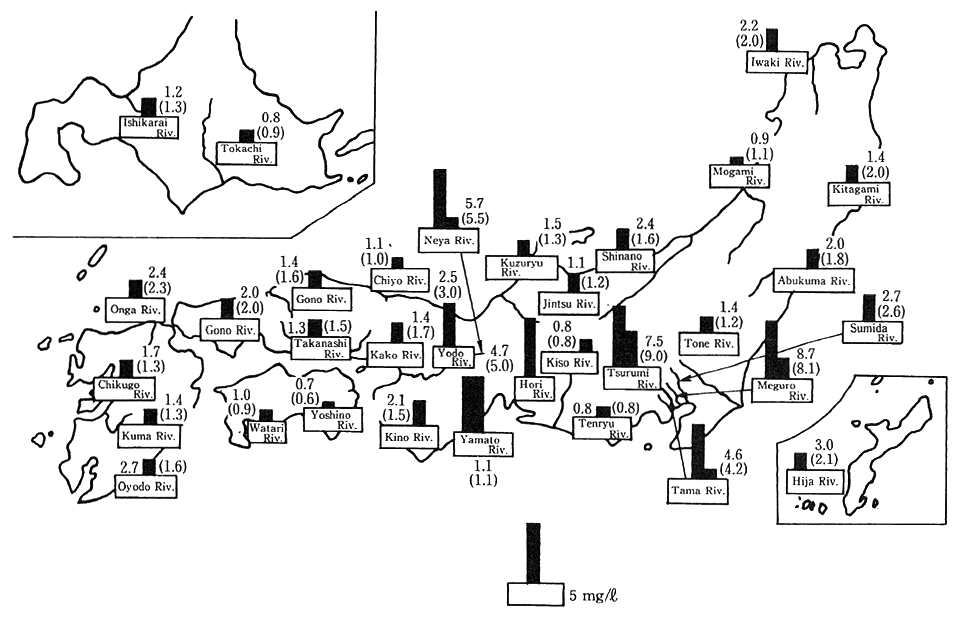
Remarks:1. Surveyed by the Environment Agency.
2. The figuren are the annual average BOD values. (Unit: mg/l)
3. The figures in parentheses are those monitored in FY 1989.
Fig. 7-1-2 Pollution of Major Lakes, Reservoirs and Inner Bays (FY 1990)
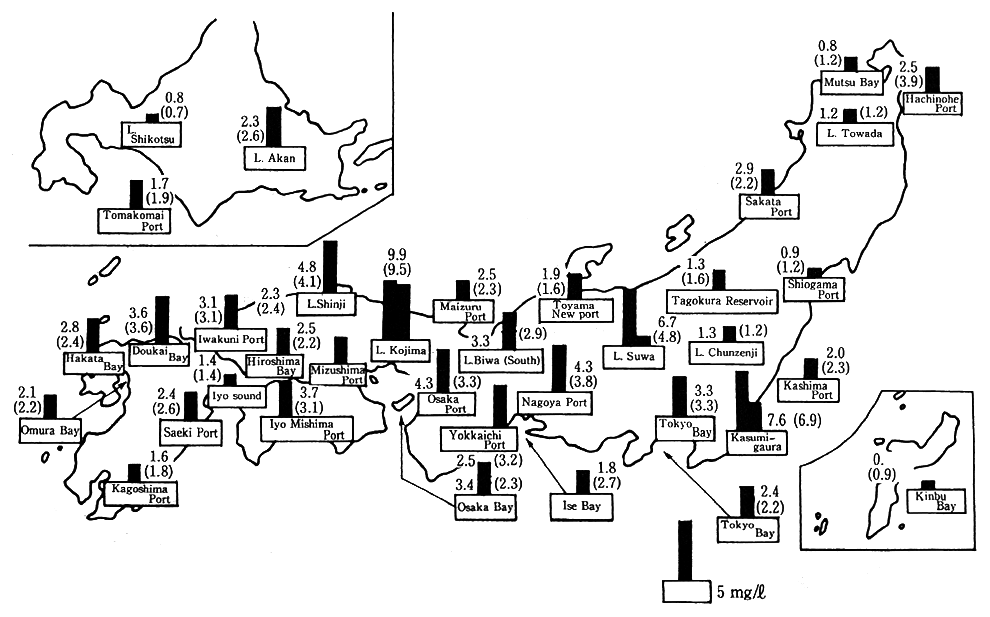
Remarks:1. Surveyed by the Environment Agency.
2. The figures are the annual average BOD figures (Unit; mg/1).
3. The figures in parentheses are those monitored in FY 1989.
7-1-2 Factors
There has been a delay in coping with household waste water, such as the fact that sewage systems and so on are not sufficient. On the other hand, improvement is already evident insofar as waste water from factories and business establishments is concerned.
The reason for the pollution of bays, inland seas, lakes and reservoirs and so forth, is due to physical features unique to closed water bodies. Polluted matter tends to accumulate, It is also due to socioeconomic factors, such as the concentration of population and industry in littoral areas. Concerning rivers in cities and lakes and reservoirs in areas where urbanization is in progress, the development of sewage systems does not catch up with increases in population.
There are problems about non-point water pollution where pollut-ants are washed out by rain and so forth from built-up broad urban areas, sites where land is under development, farmland etc., and water pollution by the discharge of nutrients deposited and accumulated in the bottom.
7-2 Damage by Water Pollution
7-2-1 Pollution of Drinking Water Sources
Of all drinking water sources, surface river and stream water accounts for about 70% and underground source account for about 30%. Drinking water was affected by accidents in which the water sources were affected at 73 places fiscal 1990. Offensive odors caused by the excessive growth of algae affected in 98 water utilities (with an affected total population of about 21,600,000).
The pollution of drinking water sources is coped with, such as by introducing advanced water purification facilities. This turns out to be a heavy burden on water works and becomes a factor for rises in the cost of water purification and processing.
Table 7-1-2 Achievement of Environmental Quality Standards
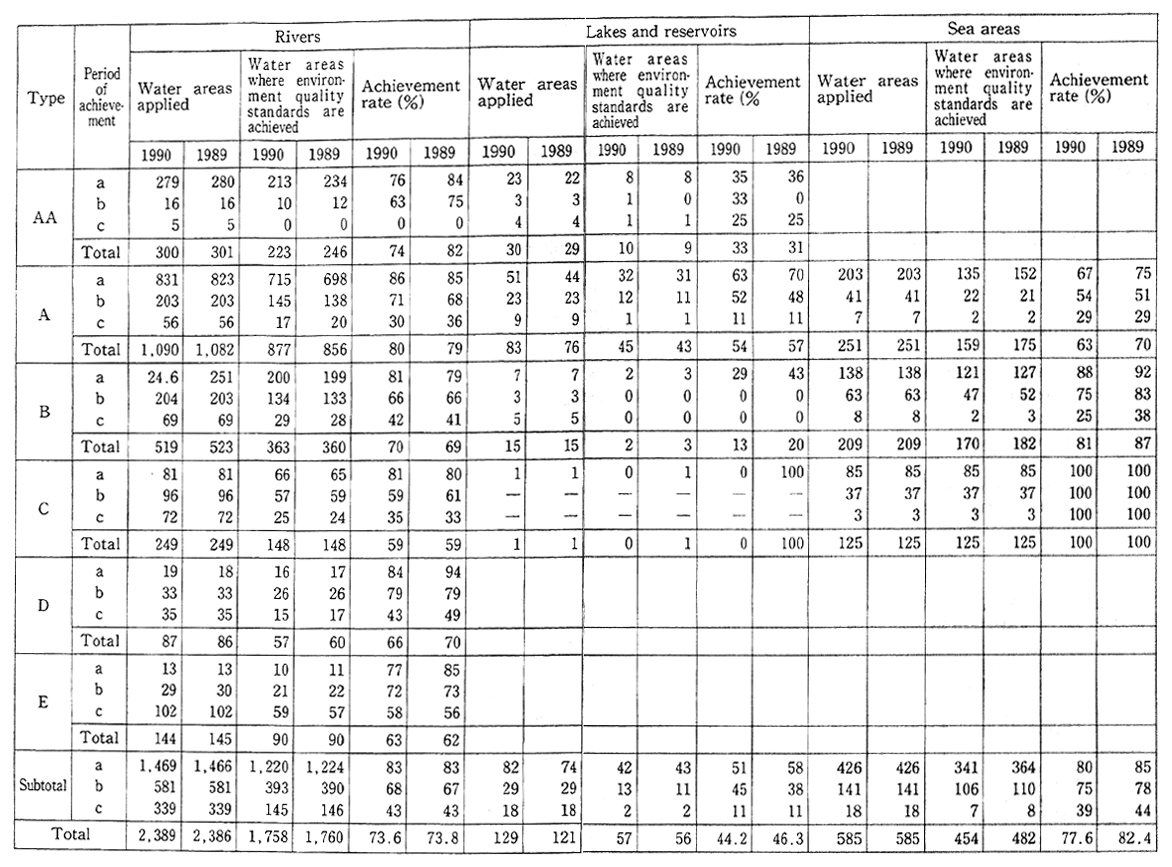
Remarks: Of the water areas to which types were applied, those which, were monitored are tabulated in this table for the FY 1990 survey till FY 1989 and the FY 1989 survey till FY 1988.
7-2-2 Pollution of Industrial Use Water
Surface river and stream water (of which about half is from industrial use water supplies) accounts for 70% of all industrial water, and there are cases in which industrial water is affected by the pollution of river water. Also in the qualitative treatment of water, there are cases in which problems in treating water arise due to the generation of sludge by river pollutants.
7-2-3 Damage to Agriculture
In recent years, the flow of polluted urban water into agricultural water has given rise to problems that cannot be passed unnoticed in terms of agricultural production, the living environment of rural com-munities and so on.
The present situation of agricultural damage caused by the pollution of agricultural water is indicated in Table 7-2-1. The damage caused by polluted urban water is the greatest, accounting for 844% of the total area of affected farmland. A comparison of the findings of this survey with those of the survey done in fiscal 1985 is as follows:
Number of affected districts Up 10%
Area of affected farmland Down 2.9%
Area where damage is newly About 24,000 hectares
occurred (91% by polluted urban water)
Table 7-2-1 Number and Area of Districts With Agricultural Water Affected by Source of Pollution
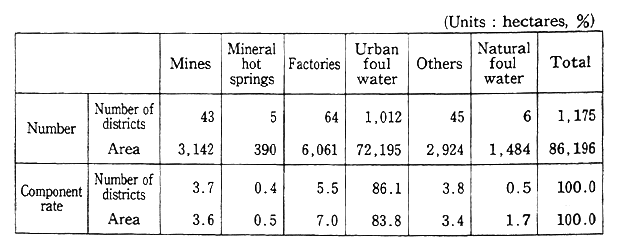
Remarks: Surveyed by the Ministry of Agriculture, Forestry and Fisheries
7-2-4 Damage to Fisheries
The damage caused by water pollution to fisheries take on the following patterns.
(A) The deterioration of fishing grounds and damage to fishing in conjunction with the sedimentation of floatage on the water surface and throwaways.
(B) Extinction of aquatic organisms, growth impotence, etc., due to oil pollution, the generation of red tides, etc.
(C) Unsalability of hauled fish or drops in fish price due to the bioaccumulation, absorption, etc., of heavy metals, PCBs and other toxic pollutants
(D) Staining, erosion, etc., of fishing vessels and gear by oil pollution and so forth
An outline of idiopathic damage to fisheries due to water pollu-tion, etc., in fiscal 1990 is given below:
Number of cases occurred 295 (285 in fiscal 1989)
Damage by oil pollution on the sea surface 48(71 in fiscal 1989)
Damage by red tides 42(22 in fiscal 1989)
Damage in value ¥3,321,600,000 (¥1,973,000,000 in fiscal 1989)
Damage by oil pollution ¥1,250,000,000 (¥737,000,000 in fiscal 1989)
Damage by red tides ¥1,650,000,000 (¥819,000,000 in fiscal 1989)
Given the pollution of fish and shellfish, self-controls on fishing were done or dietary guidance was provided as in the past for mercury in nine water regions, one water region for PCB and seven water regions for "drin type" insecticides (as of the end of December 1991).
7-2-5 Other Damage
According to a water survey conducted by the Environment Agency on bathing beaches and so forth (in fiscal 1991), none of the 415 sampled bathing beaches was found to require improvement, the first time ever since the Environment Agency started this survey.
7-3 Measures for Prevention of Water Pollution
7-3-1 Establishment of Environmental Quality Standards
Two sets of environmental quality standards are formulated --one for protection of man's health and the other for conservation of the human living environment. In the former set, environmental quality standards are formulated for nine pollutants--cadmium, cyanogen, organic phosphorus, lead, hexavalent chrome, arsenic, total mercury, alkyl mercury and PCBs. For trichloroethylene and tetrachloroethylene, water environmental quality targets are set. In the latter set, environ-mental quality standards are formulated on BOD, COD and DO for each type of water. As regards lakes and reservoirs, additional environmen-tal quality standards are formulated on total nitrogen and total phos-phorus to prevent eutrophication,
Concerning the removal of sediment containing toxic pollutants, provisional removal standards are formulated, respectively, for sedi-ment containing mercury and those containing PCB.
7-3-2 Strengthening of Effluent Controls
(1) Establishment of Additional Effluent Standards
In accordance with the Water Pollution Control Law, nationwide uniform effluent standards were established, but more strict controls have been added to them by all prefectures since 1975.
(2) Expansion of Control Subjects
(A) Expansion of Control Subjects Under Water Pollution Control Law
Immediately after the enactment of the Water Pollution Control Law, about 500 out of 1,100 all industries were set as controlled subjects, but their number was gradually increased. As of the end of fiscal 1991, about 600 of the 1,100 industries or so were controlled. (B) Expansion in Total Pollutant Load Control Areas
In total pollutant load control areas, a system of "specified facilities in designated areas" was instituted, and on April 1, 1991, septic tanks with a capacity of 201-500 persons were controlled.
(C) Addition of Controlled Pollutants
Controls were started on trichioroethylene and tetrachioroeth-ylene as new hazardous substances in October 1989. In July 1991, purification and distilling facilities using those two substances were made controlled subjects.
(3) Investigations of Uncontrolled Items
As regards1, 1, 1-trichloroethane and other substances, fact find-ing surveys were done on discharge from factories and other facilities, and water surveys on public waters. Surveys and studies were also made to understand the degeneration of the marine environment, such as reduction of transparency. Findings were also gathered on heated waste water.
(4) Measures to Cope With Water Pollution Accidents
The Water Pollution Control Law was partially amended in June 1989 to update its provisions, such as obligating entrepreneurs to take emergency measures in the case of a water pollution accident and file reports with their respective prefectural governors about the measures taken.
7-3-3 Measures Against Household Effluents
Household effluents play a significant role in water pollution. Given this, there is the need to streamline sewage and household effluent treatment facilities and enhance residents' consciousness. For this purpose, the following measures are taken:
* Environment Agency Formulation of the Guideline for Guidance on the Promotion of Measures to Cope With Household Effluents (1988) Holding of the Water Environment Forum (annual) Partial amendment of the Water Pollution Control Law (June 1990)
(A) Clarification of administrative work on measures to cope with household effluents and of the people's obligations
(B) Systematic promotion of measures to cope with household effluents In accordance with the amended law, priority areas are designat-ed by prefectural governors. As of March 31, 1992, 50 districts and 155 municipalities in 29 prefectures were designated.
* Ministry of Health and Welfare and Ministry of Construction Designation of "Sewage System Promotion Day" (September 10 of each year)
* Environment Agency, Ministry of Health and Welfare and Ministry of Construction Designation of "Septic Tank Day" (October 1 of each year)
7-3-4 Development of Sewage Systems
The development of sewage systems is being promoted under a five-year sewage system development program. The Seventh Five-year Sewage System Development Program was started in 1991 with a total outlay of ¥16,500 billion. The breakdown is shown in Table 7-3-1.
Table 7-3-1 Project Expenditures under 7 th 5-year Sewer System Development Program by Project
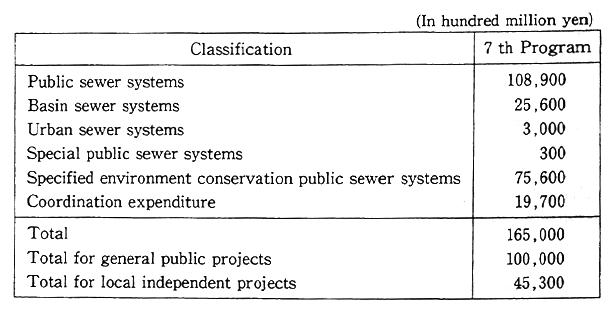
Remarks: Based on data from the Ministry of Construction.
(1) Sewage Construction and Management Projects
An outline of the sewage construction and management projects scheduled for fiscal 1991 is given below:
Total project expenditure: ¥2,387,.2 billion (initial)
Execution of public sewage construction and management projects 1,150 places
Execution of basin sewage construction and management projects 106
Execution of urban sewage channel constructi and management projects 411
Execution of specified public sewage construction and management projects 3
Execution of specified public sewage construction and management projects for environmental conservation 297
As a result, the percentage of the population for whom processing is done is expected to come to 45% by the end of fiscal 1991.
(2) Comprehensive Sewage Development Program by Watershed
For the formulation of a comprehensive sewage development program, which would serve as the basic program for the development of sewage systems, a survey had been conducted at 184 places by fiscal 1990-In fiscal 1991, it was performed along the Karino River and one more place. A comprehensive sewage development program by water-shed had been formulated for 73 places by the end of fiscal 1990.
(3) Technical Development, Surveys and Studies, Etc.
To contribute to the effective promotion of sewage development and management projects, surveys were performed on the basic policy for the development and management of sewage systems and rationali-zation and other issues. And the practical use of a new waste water treatment system (bio-focus WT) which uses biotechnology is being promoted.
(4) Japan Sewage Development and Management Project Corporation
The Japan Sewage Development and Management Project Corpo-ration carries out the following projects:
projects for construction of terminal treatment plants,
training of sewage technicians,
qualification tests on technology,
development of technology,
tests and studies on sewage systems,
surveys for assessment of new technologies,
inter-jurisdictional sewage and sludge treatment projects (Ace plans: 3 places in fiscal 1991)
7-3-5 Development of Surveillance an Monitoring
(1) Surveillance of Water in Public Waters
The Environment Agency subsidizes costs for the formulation of monitoring programs for the continuous surveillance of water in public waters by prefectures and administrative ordinance designated cities, costs for surveys on the water quality, the installation of automatic water surveillance and monitoring devices (at 166 places as of the end of fiscal 1990), and the streamlining of water analyzers at local environ-mental pollution research institutes and other organizations. Given improvements in the performance of automatic monitors, monitoring with automatic monitors, automatic water surveillance and monitoring devices were added to the monitoring methods associated with environ-mental quality standards in relation to pH and DO in December 1991.
Acting as a river custodian, the Ministry of Construction also monitors the pollution of water in the major water areas of Class I rivers across the nation, promoting the installation of automatic water surveillance and monitoring devices (128 places along 55 water systems as of fiscal 1990) and starting the use of telemeters (112 places) in the concentrated surveillance of water.
Also, the Environment Agency and the Ministry of Construction carried out surveys on the water quality as related to aquatic animals with the involvement of private citizens.