

Quality of the Environment in Japan 1992
PartI
Chapter1. State of the Environment
Deterioration of the environment in Japan began to become visible in the mid-1960s, after which strong public opinion stimulated private and public interests to deal with the situation. In the Western industrialized countries as well, environmental issues became a major social problem in the 1960s and 1970s, and stringent controls began to emerge as a result. These environmental problems burst on the scene with explosive impact after years of neglect while the industrialized countries were busily focusing their energies upon reconstructing their post war economies and providing their citizens with greater prosperity each passing year.
Over almost a quarter century, from the rapid economic growth of the 1960s until the present, the protection of the environment has developed into an urgent problem from a different perspective. In Japan, air pollution caused by nitrogen oxides has worsened as a result of the most vigorous economic activity centered in the cities since the eco-nomic boom of "Izanagi" in the midst of this country. How to dispose of an increasing volume of waste has also become a major problem, as we are faced with a scarcity of disposal sites, and as disorderly as well as illegal disposal becomes more flagrant. The demand for leisure facilities, as well as the development of regional areas that are desper-ate for an influx of population, has led to the so-called resort develop-ment boom which is responsible for much destruction of the natural environment. In addition, there are various other data released this year, which show that the environment in Japan is deteriorating more than in the past. Although the specific problems may differ for those of the 1960s, it is undeniable that their negative impact upon the environment is the same.
In particular, what sets the current situation apart from that of a quarter century before is that related elements of the natural environ-ment are deteriorating as a result of their own interrelationships. Moreover, the effect of the damage to the environment is spreading beyond the narrow confines of particular national or geographic regions. Previously, the damage may have been restricted to a particu-lar environmental element in a particular area, but now we are finding that the problems threaten an interconnected global stock of environ-mental elements. For example, even slight alterations in the composi-tion of the atmosphere is predicted to have widespread effects ranging from global warming to world-wide climatic change. These changes will have grave consequences for the ecosystem and may exert a profound effect upon the habitat and economic foundation of future generations of human beings.
Now, once again, environmental problems have become an urgent issue from a new, and much more serious perspective.
1-1 Pollution and Other Environmental Problems
When society's waste disposal takes place at the expense of environmental pollution, then the resource supply function which the environment is expected to fulfill becomes impaired, and the conse-quences of the pollution can even cause physical injury to human beings. As a result of some of the measures taken over the past twenty years, the extreme pollution produced by some industries has lessened consid-erably. However, in addition to the pollution that stems from large-scale, specific sources, that which results from the overall economic and social activity of modern society does continuous damage to the envi-ronment. Moreover, the accumulated effect of pollution, as well as those effects that extend to the earth as a whole, deteriorate the environment as stock.
1-1-1 The Atmosphere
(1) Nitrogen dioxide
Nitrogen dioxide has a harmful effect upon respiratory organs. In Japan, the government has set environmental quality standards pertain-ing to the concentration of this substance in the atmosphere and various regulations have been applied to sources from which this substance enters the atmosphere. Nitrous oxides such as nitrogen dioxide are chiefly produced through the combustion of fuel, and therefore the major sources of this pollutant can be categorized in terms of fixed sources such as boilers, and mobile sources such as automobile engine exhausts.
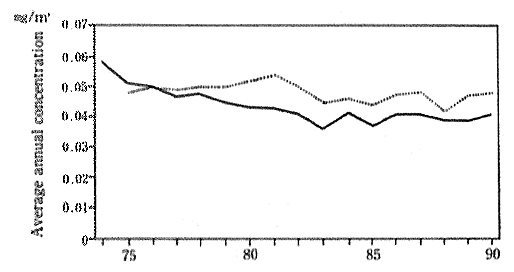
In 1990, the average concenttration of nitrogen dioxide was calculated at 0.028 parts per million (ppm). This figure was based upon continuous monitoring carried out at 15 Air pollution monitoring sta-tions collecting data since 1970 for the purpose of monitoring pollution in the atmosphere. The average concentration of nitrogen dioxide in the vicinity of traffic roads, as measured by 21 automobile exhaust gas monitoring stations continuously collecting data since 1971, was 0.041 ppm. Both of these figures are unchanged from those of 1988 and indicate the worst level of concentration since monitoring first started. Examining this trend in detail, we see that the air pollution monitoring stations registered 0.028 ppm in 1979, and the automobile exhaust gas monitoring stations registered 0.043 ppm in 1980. A slight improvement was evident until 1985, but thereafter the figures got worse or stayed the same (Figure 1-1-1).
Fig. 1-1-1 Concentration of NO2 (Average of Continuosly Monitoring Stations)
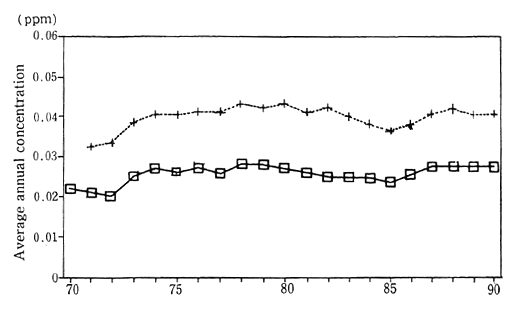
?Average for 15 air pollution monitoring stations
+Average for 21 automobils exhaust monitoring stations
Source : Environment Agency
As yet, there has been insufficient explication of the effect of this level of nitrogen dioxide concentration upon human health. However, over the five year period from 1986 to 1990, follow-up surveys on the health of 5,000 infants, reveled that children living in areas with a yearly average concentration of nitrogen dioxide greater than 0.003 ppm (envi-ronmental standards specified for concentration of nitrogen dioxide are based on a daily average, the upper limit of which works out to 0.003 ppm average yearly concentration) had a higher incidence of initial asthma symptoms than children living in areas with lower concentra-tions (Figure 1-1-2).
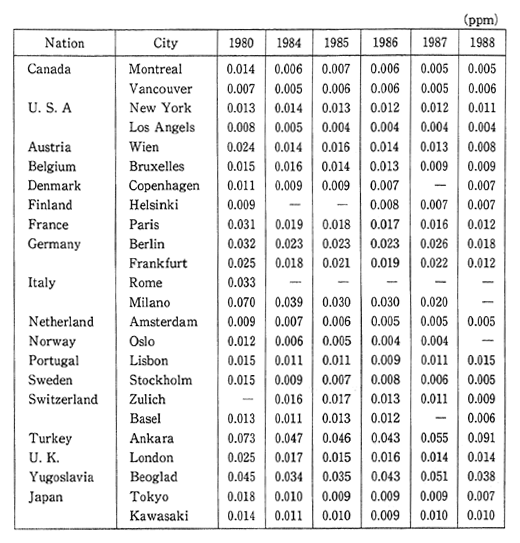
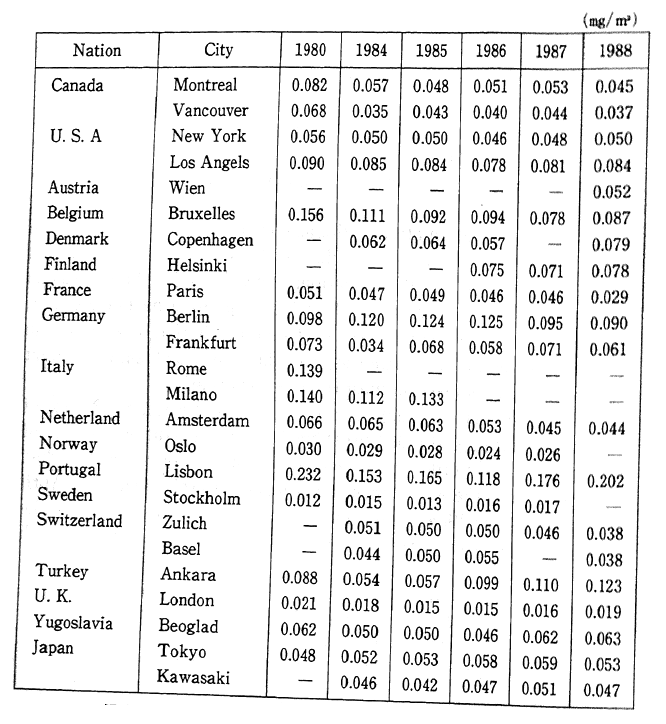
The deadline for attaining the environmental quality standards was set for 1985, however there are still some areas, particularly large cities and their vicinity, where these standards have yet to be reached. In order to prevent the detrimental effect upon human health, quickly meeting these environmental standards is becoming a major issue. In addition to the direct effect upon respiratory organs that results from inhaling nitrous oxides such as nitrogen dioxide, these substances are also responsible for acid rain. In Europe and America as well, the concentration of nitrogen dioxide has increased slightly since the latter part of the 1980s, and efforts are currently underway to take corrective measures (Table 1-1-1).
Fig. 1-1-2 New Incidence of Asthma-Like Symptoms
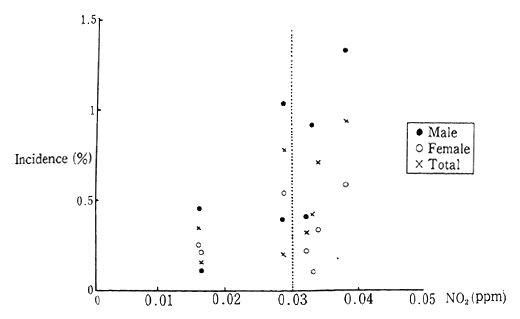
Source: Environment Agency
Note: Group with no symptoms at the start of the survey.
9 Years' Average Concentration of NO2
(2) Sulfur dioxide
Sulfur dioxide also has a harmful effect upon respiratory organs and is known to be one of the factors that causes Yokkaichi asthma. This substance is also known as contributor to acid rain. Sulfur dioxide is produced by the combustion of sulfur-containing fossil fuels such as petroleum or coal.
Japanese industrial zones formerly had very high concentrations of sulfur dioxide. Environmental quality standards to be achieved and maintained were set in order to protect the health of the populace living near these areas. Strict measures were established in order to meet these objectives. Consequently, in 1990, the annual average concentration of sulfur dioxide was calculated at 0.010 ppm, as measured by 15 air pollution monitoring stations continuously monitoring since 1965. The average concentration of sulfur dioxide as measured by 16 automobile exhaust gas monitoring stations collecting data since 1973, was 0.011 ppm. This is equivalent to two thirds of the maximum level of atmo-spheric pollution designated by the environmental quality standards. Since achieving environmental quality standards virtually nationwide in 1980, the atmospheric concentration of this substance has fallen even further (Figure 1-1-3).
Table 1-1-1 Trends of Nitrogen Dioxide Concentration in Selected Cities
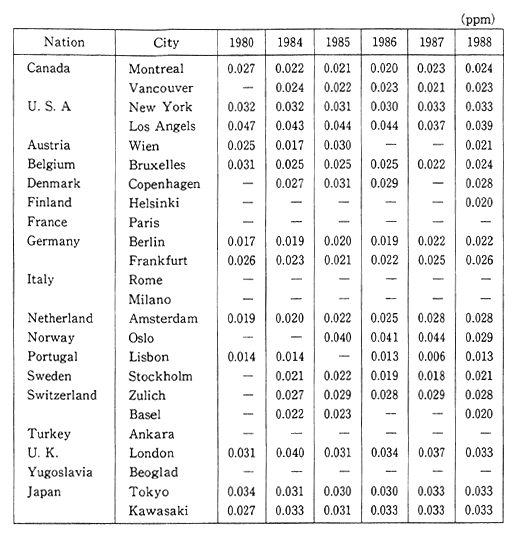
Source OECD Environmental Data Compendium 1991
Note: The Readers should be cautious when interpreting this table, especially because large differences of number of monitoring site and method of monitoring among countries. A comparison between two or more cities does not seem to be advisable, a compaison of trends is preferable.
Fig. 1-1-3 Concentration of SO2 (Average Concentra-tion for Continuosly Monitoring Stations)
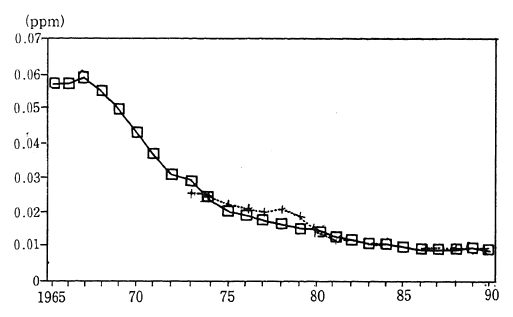
Average annual value
? Average for 15 air pollution monitoring stations
+ Average for automobile exhaust monitoring stations
Source: Environment Agency
International comparisons show that major improvements in the atmospheric concentration of sulfur dioxide have also been achieved by the other OECD member countries (Table 1-1-2). However as we shall examine in further detail below, cities in the developing countries, particularly those that are rapidly industrializing, and in countries that rely predominantly upon fossil fuels which contains high level of sulfur as a source of heating energy, are displaying serious levels of sulfur dioxide concentrations in the air.
(3) Photochemical oxidants
Photochemical oxidants are oxidizing secondary pollution sub-stances such as ozone that are produced when nitrogen oxides and hydrocarbons are irradiated by solar light. Photochemical oxidants give rise to so-called photochemical smog which effects vegetation such as agricultural grains, as well as human health by irritating mucous membranes and respiratory organs.
In addition to setting environmental quality standards for photo-chemical oxidants, various other measures are taken such as broadcast-ing an official warming in order to avoid outdoor activities when the meteorological conditions are such that a sustained hourly level of greater than 0.12 ppm has been reached. In 1990, there was an average 2.2 days when these levels were exceeded in the case of ecah air pollution monitoring station and 1.1 days in the case of each automobile exhaust monitoring station. In either case this represents a considerable increase over the conditions existing in 1988 (Figure 1-1-4).
Table 1-1-2 Trends of Sulfur Dioxide Concentration in Selected Cities
Source: OECD Environmental Data Compendium 1991
Note: The Readers should be cautious when interpreting this table, especially because large differences of number of monitoring site and method of monitoring among countries. A comparison between two or more cities does not seem to be advisable, a compaison of trends is preferable.
International comparisons show that in the case of the United States, environmental quality standards on ozone, a principal compo-nent of photochemical oxidants, is set at an hourly level of 235ug/m3, however records show that with the exception of Minneapolis, all of the other major cities exceed this level. This indicates that 75 million people in the United States are regularly exposed to levels in excess of those standards.
Fig. 1-1-4 Number of Days per Station with Photochemical Oxidant Concentra-tion at More Than 0.012ppm
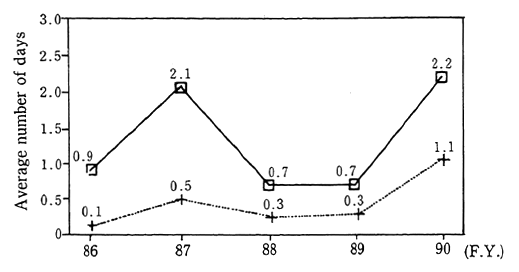
? Air pollution monitoring station
+ Automobile exhaust monitoring station
Source: Environment Agency
(4) Non-methane hydrocarbons
With the exception of methane, which exhibits a low photochemi-cal reactivity, other hydrocarbons all contribute to photochemical smog. Sources of these non-methane hydrocarbons are organic solvents, and the discharge into atmosphere from volatile fuels or from mobile sources such as automobiles. There are no environmental standards for non-methane hydrocarbons, but in order to prevent the formation of photochemical oxidants, guidelines on target concentration values have been established and a number of measures are implemented to meet those targets.
Trends in the concentration of non-methane hydrocarbons, as recorded at the 6 air pollution monitoring stations continuously measur-ing this substance since 1978, indicate that the level has essentially leveled off in recent years. In 1990, this level was 0.54 ppmC (hydrocar-bons are measured relative to the number of carbon atoms) which was a slight decrease from the previous year. Records from the 9 automobile exhaust gas monitoring stations continuously measuring this substance since 1977, also show that the level has remained largely unchanged in recent years. The level recorded in 1990 was 0.54 ppmC which is also a slight drop from the year before (Figure 1-1-5).
Fig. 1-1-5 Concentration of Non-Methane Hydrocarbon at 6-9 O'Clock (Aver-age Concentration for Continuously Monitoring Stations)
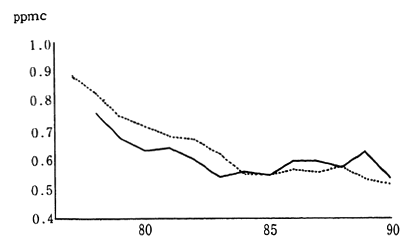
Note:━━Average concentration for 6 air pollution monitoring stations
··· Average concentration for 9 automobile exhaust monitoring stations
Source Environment Agency
The performance for other countries show that while some countries have decreased the amount of hydrocarbons released into the atmosphere (amount of decrease from 1970 to 1988 was 29 percent for the United States, 10 percent for Germany, and 29 percent for the Netherlands), other countries have increased this volume (15 percent for Great Britain). On balance there has been little change or some deterio-ration.
(5) Carbon monoxide
carbon monoxide attaches itself to the hemoglobin molecules in human blood where it interferes with the ability of blood to transport oxygen. Carbon monoxide is released into the atmosphere as a result of incomplete fuel combustion. The major source of this pollutant is believed to be automobiles. Japan has set environmental standards for this substance and automobile exhaust gases are controlled to meet these standards. Carbon monoxide also deserves particular attention as it is known to prolosb the existence of atmospheric methane which contributes to the greenhouse effect.
The concentration of carbon monoxide in 1990, as measure by 5 standard environmental measuring stations carrying out long term measurements, was an average 0.7 ppm. In the same year, the average concentration as measured by 14 automobile exhaust gas measuring stations continuously collecting data since 1971, was 2.3 ppm. Even this latter figure represents a level of atmospheric pollution roughly half of that permissible by the environmental quality standards. In 1979, these standards had virtually been attained nationwide, and consistent improvements have been observed since then (Figure 1-1-6).
Fig. 1-1-6 Concentration of CO (Average Concentra-tion for Continuously Monitoring Stations)
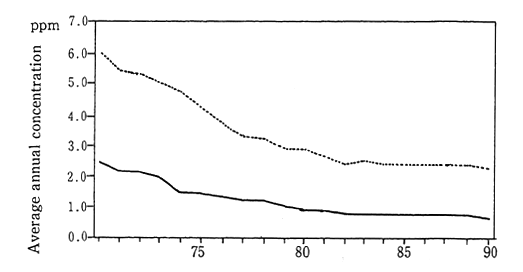
Note:━━Average concentration for 5 air pollution monitoring stations
··· Average concentration for 15 automobile exhaust monitoring stations
Source: Environment Agency
(6) Suspended particulate matter, particulate dust etc.
Suspended particulate matter in the atmosphere consists of microscopic particles less than 10 um in diameter. As a result of their minute size, these particles will remain suspended in the atomosphere for long periods of time, and if inhaled, they can cause damage to respiratory organs such as the lungs and bronchial tubes. There are many sources of suspended particulate matter including soot and smoke from factories or other work places, black smoke from diesel exhaust fumes and particulate which are made from nitrous oxides, and sulfur oxides by chemical change particles, and natural sources such as dust which the wind stirs up from the soil. On a nationwide basis it has been estimated that the particles from diesel exhaust comprise 20 to 40 percent of total suspended particles emissioned.
There has been a slight improvement in the concentration of suspended particulate matter since 1974. In 1990, the average value for the year, as measured by 40 air pollution monitoring stations continu-ously sampling the atmosphere since 1974, was 0.04lmg/m3. The 6 automobile exhaust as monitoring stations continuously collecting data since 1974 recorded an average of O.048mg/m3 for 1990. In either case, these data show a deterioration in the concentrations compared with the previous year (Figure 1-1-7). Trends of concentration of suspended particulate matter in foreign countries are shown in Table 1-1-3.
The particulate matter in the atmosphere that falls back to the earth's surface is referred to as dust fall. Long term measurements continuously carried out at 16 locations show that in 1990 there was an average of 3.3 tons/ km2 /month of such precipitating particulate dust This is a major improvement over past severe pollution of greater than 10 tons/ km2/ mouth. Nevertheless, the data for 1990 show a slight deterioration in comparison with the previous year.
In pIaces that are subject to snow and cold weather, the use of tires with metal pins (studded tires) has become an additional source of particulate dust. In order to prevent the production of particulate dust by studded tires, the use of these tires has been prohibited since April 1991 in areas specifically designated by the Director-General of the Environment Agency. Furthermore, the Environment Disputes Coordination Commission made the mediation that ordered all seven tire producers to cease the production of studded tires as of the end of March 1991. Trends in the volume of particulate dust that percipitates in winter and is attributed to studded tires for places such as Matsumoto in Nagano Prefecture, are shown in Figure 1-1-8. The removal of studded tires is beginning to show effect in gradual improvement in the data and it is expected that this improvement will continue.
Fig 1-1-7 Concentration Suspended Particulate Matter (Average Concentration for Continu-ously Monitoring Stations)
??Average concentration for 40 air pollution monitoring sta-tions
··· Average concentration for 6 automobile exhaust monitoring stations
Source : Environment Agency
Table 1-1-3 Trendsof Suspended Particulate Matter in Selected Cities
Source: OECD Environmental Data Compendium 1991
Note : The Readers should be cautious when interpreting this table especially because large differences of number of monitoring site and method of monitoring among countries. A comparison between two or more cities does not seem to be advisable, a compaison of trends is preferable.
Fig. 1-1-8 Fallout Dust in Matsumoto, Sendai and Sapporo Cities (Supposed to be caused by use of studded-tires)
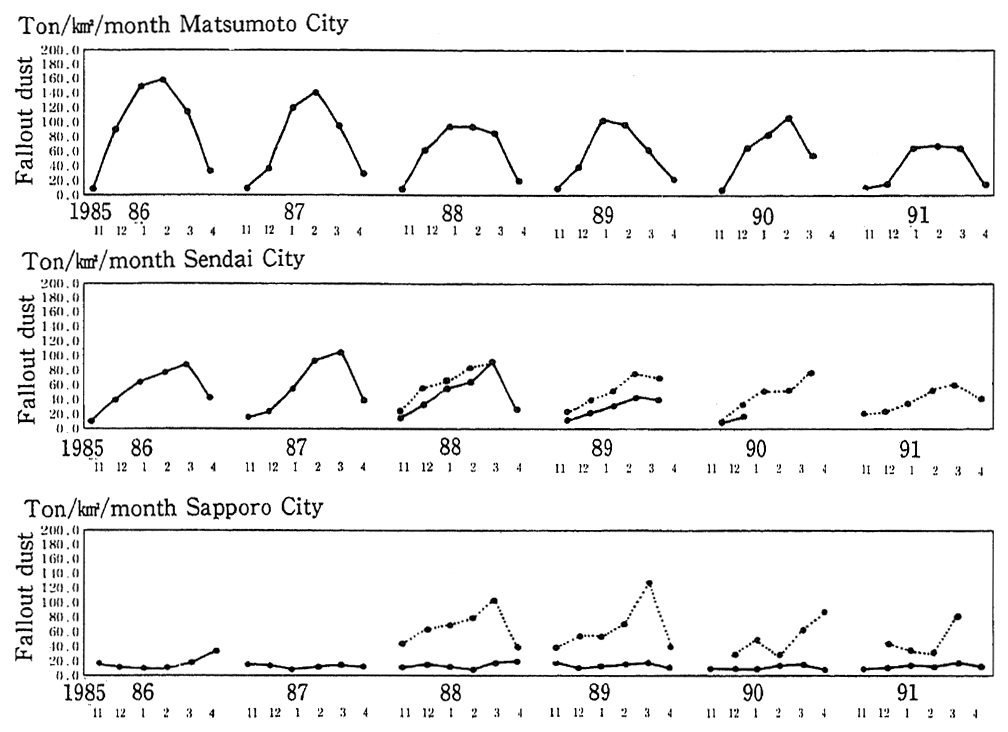
Source: Environment Agency
(7) Chlorofluorocarbons (CFCs) and statospheric ozone
In the stratosphere there is an ozone layer containing ozone molecules produced by the effect of solar energy upon oxygen mole-cules. This ozone layer absorbs most of the potentially harmful ultravio-let radiation contained in solar radiation and thus protects living organ-isms on the surface of the earth from its harmful effects. It is this invaluable function that gives rise to the metaphor of the ozone layer as a sort of space suit. Furthermore, it is believed that the fluctuations in the warming action of the ozone molecules in the ozone layer play an important regulatory role for the earth's climate.
In recent years however, a decrease in the ozone layer has been observed. A phenomenon called an "ozone hole" has been observed to exist over a wide area above Antarctica from September,which is the beginning of spring in the southern hemisphere, until October. In the mid-1980s, this ozone hole was observed to expand and contract in a roughly two year cycle. However over the three year period from 1989 to 1991, a large ozone hole was observed each year. In 1987, the ozone hole was the largest observed to that date, and this was followed in 1989 and 1990 with the third largest and second largest holes respectively. In 1991, the size of the hole, and the decrese in the concentration of ozone, were the greatest on record (Figure 1-1-9). As a result of meteorological conditions, a similar size ozone hole over the other polar region, the Arctic, has not been observed. However, a large scale survey of the Arctic region conducted from 1991 to 1992 revealed extremely high concentrations of chlorine monoxide which is part of a reaction which results in depletion of the ozone layer. This indicates a strog possibility that a conspicuous decrease in the ozone layer may also occur over the Arctic region.
Fig. 1-1-9 Distribution of Total Ozone Over the Antarctic
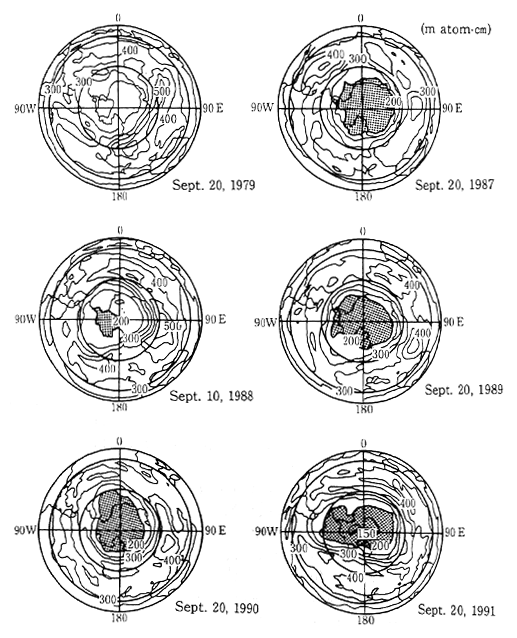
Source: Meteorological Agency
Notes: The meshed parts represent areas with less than 200 m atom-cm. Prepared by the Meteorological Agency with a comparison of NASA data with the values monitored with Dobson spectrophotometers. Monitored by TOMS loaded in Satellite Nimbus-7.
In Japan, observations of the ozone layer have also been carried out in places such as 'Tsukuba City, Ibaragi Prefecture, and Sapporo. Results of these observations indicate that, in the case of Sapporo, the decrease in the ozone layer recorded for December 1991 was greater than for the same month in any previous year since observations began in 1958 (Figure 1-1-10).
It is feared that this decrease in the ozone layer will result in an increase in harmful ultraviolet rays (UV-B). Increased UV-B radiation threatens human health through greater risk of skin cancer and cata-racts. It also obstructs the growth of vegetation. In order to monitor changes in the level of ultraviolet radiation that results from a decrease in the ozone layer, Japan has been conducting observations of ultravio-let radiation since 1990.
Fig. 1-1-10 Distribution of Total Ozone Over Japan (All Year)
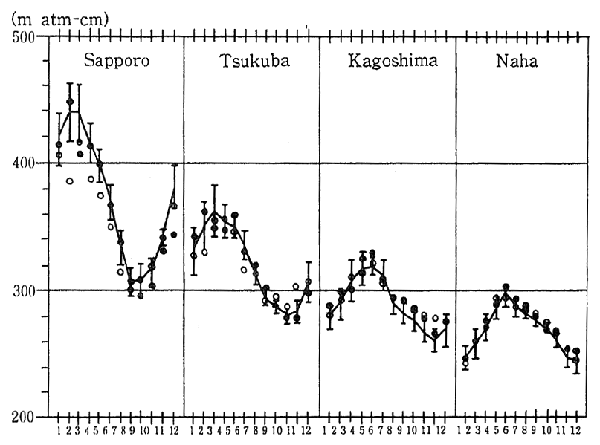
Source: Meteorological Agency
Note: The line graphs indicate values in an average year (average value of those of 1961-1990), and vertical lines in the figure indicate standard deviations.
?is monthly average value of 1991.
?is monthly average value of 1990.
The Montreal Protocol established international standards for the atmospheric concentration of CFCs and carbon termchloride in recognition of their destructive effect upon the ozone layer. Results of measurements of atmospheric CFCs are shown Figure 1-1-11. While the concentration of ozone distracting substances such as CFCs in the mid-latitude regions of the northern hemispcere is growing, the increase in CFC-11, 12, 113 has recently begun to level off. The concentration of atmospheric CFCs in the southern hemisphere is also increasing, although it is roughly 10 percent less than the concentration in the northern hemisphere.
Figt. 1-1-11 Atmospheric Concentrations of CFC and Other Halocarbons Over North-ern Hemisphere (at intermediate lati-tude {42-45 O N, Hokkaido}
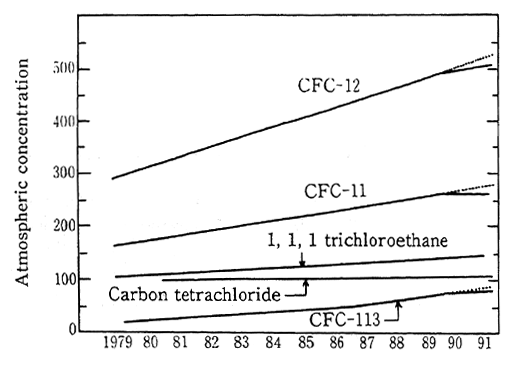
Sources; Ken Tominaga and Yoshihiro Makide: Journal of Japan Chemistry Association; T. Tominaga Pure and Applied Chemistry, 64. 529(1992); Yoshihro Makide and Ken Tominaga: Lec-ture at the 63rd Spring Annual Meeting of the Japan Chemistry Association.
Finally, as will be discussed below, substances such as CFCalso have close relation to the greenhouse effect. The warming effect of CFC is greater than that of carbon dioxide, but according to a recent report, these substances also have indirect adverse effect on global warming owing to their ozone layer depleting function.
(8) Carbon dioxide
Among the various global environment problems that we face today, global warming together with its consequence effects is one of the most urgent issues requiring prompt and specific actions. Global warming means the rise of atmospheric temperature in a short-time period compared to history of the earth, caused by the increase of atmospheric concentrations of greenhouse gases such as carbon dioxide, methane and nitrouns oxide, through human activities. Those green-house gases in the atmosphere absorb infrared radiation from the earth' s surface and re-emit thermal radiation therefore, raising the atmo-spheric temperature. It is anticipated that global warming would be accompanied by climate change, sea level rise, changes in precipitation and changes in the structure of ecosystems, and producing significant effects on the living environments of humans and other animals, agricul-ture and forestry.
According to the report of the Intergovernmental Panel on Climate Change (IPCC), the average global temperature of the earth surface has risen by between 0.3 and 0.6 degrees centigrade in the past 100 years as indicated in figures 1-1-12. The average sea 1evel has also risen by between 10 and 20 centimeters.
Fig. 1-1-12 Average Temperature of the Earth
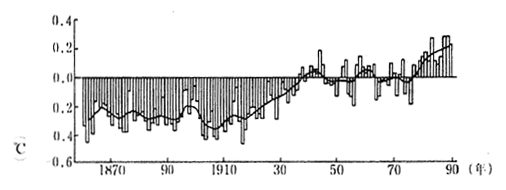
Source IPCC
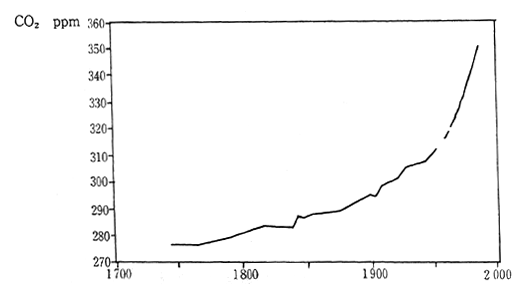
The contribution of each greenhouse gas to global warming can be expressed using two factors; the global warming potential each greenhouse gas possesses (radioactive forcing) and the length of time each greenhouse gas remains in the atmosphere. Carbon dioxides contri-bution to global warming has been about 55% during the 1980s (Figure 1-1-13 and 1-1-14). There are various sources of CO2, however, it is estimated that combustion of fossil fuels has represented 80% of the CO2 emissions and remaining 20% has arisen from deforestation and other activities. According to measurements at the Maunaroa station in Hawaii, which is the oldest observation point in the world, the atmo-spheric concentration of carbon dioxide was 353 ppm in 1991. Measure-ments of CO2 concentration taken at a location in Japan with relatively little human activity, showed 356.7 ppm in 1990 and 358.2 in 1991. The concentration of CO2 is judged to have increased 0.5% annually.
Fig. 1-1-13 Contribution of Each Man-Made GHG to Global Warming (1980s)
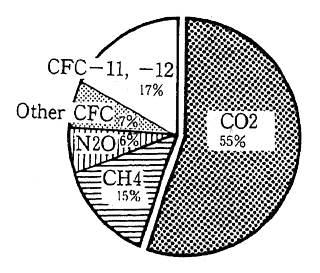
Source: IPCC
Fig. 1-1-14 Atmospheric Concentration of CO2
Source: sample, Maunaroa
(9) Methane
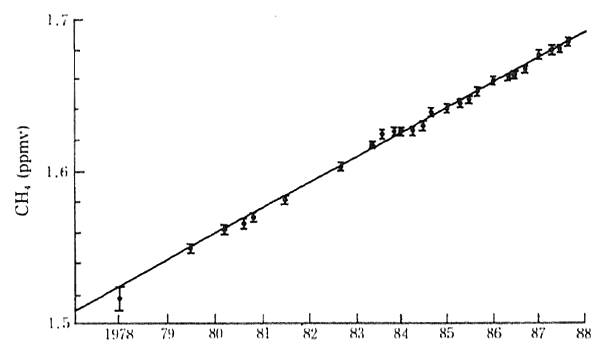
Methane is another contributor to the greenhouse effect. The current average global concentration is 1.72 ppm and reflects an aver-age annual increase of 0.9 percent between 1978 and 1988. In 1980. its degree of contribution to global warming was estimated at 15 percent (Figure 1-1-15).
Fig. 1-1-15 Atmospheric Concentration of Methane in the Earth
Source Blake&Rowland 1988
Methane sources inculde natural sources such as swamps, ter-mites, oceans and fresh water and human-related sources such as coal mining, natural gas, domestic animals, paddy fields, biomass combus-tion and land reclamation. The IPCC report estimates that causes for the increase in the atmospheric concentration are traceable to the human-related sources.
(10) Nitrous oxide
Although the concentration of nitrous oxide is an extremely low 310 parts per billion (ppb) this substance has a very large potential warming effect. In 1980 it was estimated that nitrous oxide's contribu-tion to global warming was 6 percent. Natural sources include tropical and subtropical lands and forests, and oceans, and human-related sources include fertilized agriculture, and biomass combustion. The IPCC report estimates that the increase in the atmospheric concentra-tion is due to human-related sources.
Fig. 1-1-16 Concentration of N20
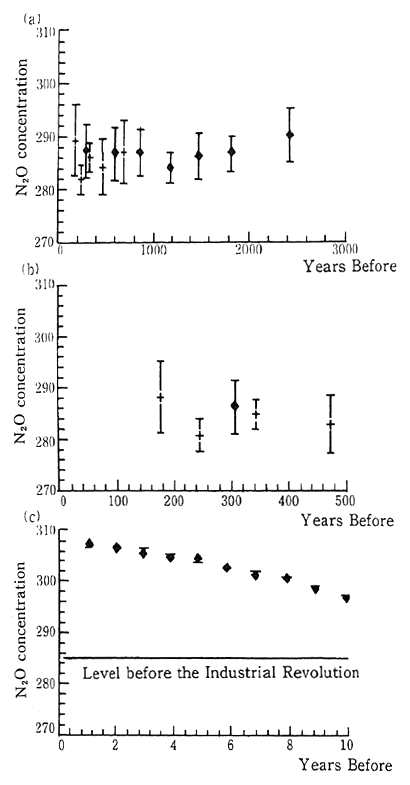
Source: Date on ice sheets are averages for 50-400 years.
(+) is based on data from the Arctic, and
(?) is based on data from the Antarctic.
(11) Other air pollutants (hazardous substances)
Substances which are subject to emissions regulations under the Air Pollution Control Law (eight substances including chlorides), as well as substances which are not subject to emissions regulations under this law but which must be observed in order to prevent a potential influence upon the environment, are presently being monitored. Environmental monitoring was carried out for formaldehyde and dioxins in l990, and for asbestos, mercury, and organo chlorine agents such as trichloroeth-ylene in 1989.
Also, the Overall Checkup Program for Environmental Safety of Chemicals examines different chemical substances each year in order to determine their residual concentration in the atmosphere isolated from specific emission sources. According to the survey carried out in 1990. six substances such as 1-Nitropyrene, out of a possible sixteen sub-stances were detected in the atmosphere, but there was no particular evidence to suggest that there might be any new problems Since these surveys detected residual amounts of chemical substances in the atmo-sphere such as trichloroethylene, which are designated by the "Law Concerning the Examination and Regulation of the Manufacture, Etc. of Chemical Substances," it has been decided to continue these surveys in the future. Also, since a higher concentration of Dioxins was detected than in the previous survey for this substance in 1988, it has become important to continue monitoring these substances as well as to identify their sources.
Measures to deal with hazardous air pollutants are being stren-gthened the world over. In the United States, the Clean Air Act was revised in 1990 in order to expand the list of hazardous substances to include 189 pollutants and start control measures on hazardous air pollutants. The environmental committee of the OECD is also examin-ing measures to deal with hazardous air pollutants.
1-1-2 Water quality
(1) Heavy metals and toxic chemicals in river and sea water
Japan has set environmental quality standards to maintain good water environment in sea or fresh water at or below desired maximum levels of concentration. The pollutants with standards include cadmium, cyanides, organic phosphorus, lead, hexavalent chromium, arsenic, total mercury, alkyl mercury, and PCB. Target values for environmental quality management have also been established for the concentration of trichloroethylene and tetrachloroethylene in water. The Water Pollu-tion Control Law was created to achieve and maintain these environ-mental quality standards and thereby to prevent pollution and the accompanying damage to human health and the environment.
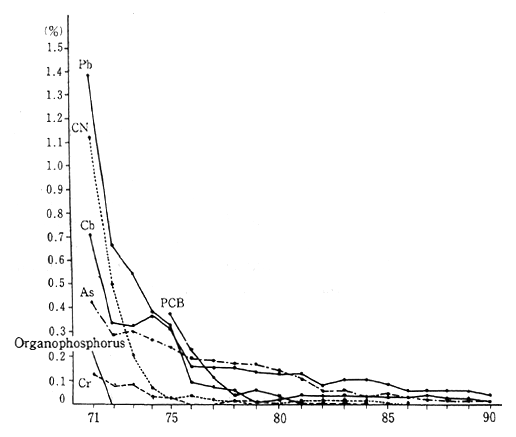
In 1990, the following situation pertaining to environmental stan-dards and the achievement of environmental water pollution target values existed. Organic phosphorus, total mercury, alkyl mercury, and PCB and trichloroethylene all met the standards and targets at all measurement stations, while cadmium, cyanides, lead, hexavalent chro-mium, arsenic, and tetrachloroethylene were just slightly above maxi-mum limits. Overall, only 0.02 percent of samples failed to meet the standards. This was a vast improvement over twenty years ago, but was virtulally unchanged from the previous year (Figure 1-1-17).
Fig. 1-1-17 Rates of Failures to Meet Environmental Quality Stan-dards on Water Associated with Health Items (By Item)
Source: Environment Agency
Note : The rate of failures for alkyl mercury since fiscal 1971 has been 0%
In order to deal with potential pollution problems before they occur, measurement of the residual concentration of chemical sub-stances not regulated by the Water Pollution Control Law is also carried out, The General Inspection Survey of Chemicals also surveys a number of different substances every year for the purpose of determin-ing what chemical substance residues exist in the ordinary environment (rivers, lakes and reservoirs, ocean). In 1990, eight substances such as aniline, among the twenty-two for which tested was done, were detected in water Although substances do exist that warrant continued regular inspection and close monitoring of concentration trends, there is nothing to suggest an immediate problem. Finally, long-term monitoring of water quality has been carried out in regard to substances for which residual concentrations are confirmed, and since substances such as dichlorobenzene were detected, it has been decided to continue such monitoring in the future.
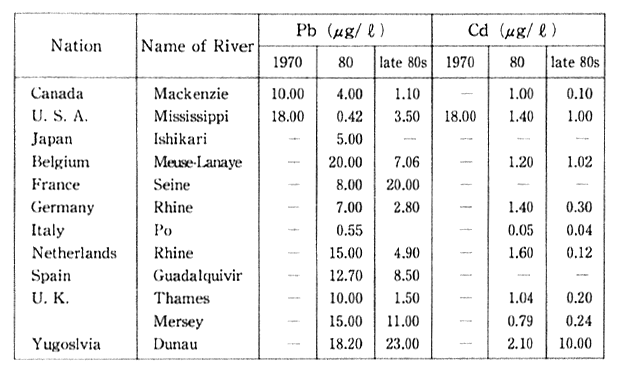
Table 1-1-4 Concentration of Pb and Cd in major Rivers of 0ECD Countries
Source: OECD Environmental Data Compendium 1991
Note Measured at the mouth or downstream frontier of river. The Readers should be cautious when interpreting table, especially because large differences of number of monitoring site and method of monioring among countries. Acomparison between two or more cities does not seem to be advisable, a comparison of trends is preferable.
Surveys are also conducted on residual concentrations in the ordinary environment (rivers, lakes, ocean) of chemical substances designated by the Law Concerning the Examination and Regulation of Chemical Substances. Here as well, the detection of organic tin com-pounds means that monitoring will be continued in the future.
The situation regarding lead and cadmium pollution in the maul rivers of other industrialized countries is detailed in Table 1-1-4. In particular, there has been an improvement regarding lead in almost every country.
(2) Organic substances in river and sea water
Japan has established environmental quality standards for maintaining and preserving water quality needed to sustain the human living environment These standards are concerned with the concentra-tion of five items such as biochemical oxygen demand (BOD) in rivers, five items such as chemical oxygen demand (COD) plus total nitrogen and total phosphorus in lakes and reservoirs, and five itjms in addition to COD in the sea areas, Water areas are classified according to water usage, and different environmental quality standards are applied to each specific area. Various measures such as effluent controls have been implemented in accordance with the Water Pollution Control Law in order to achieve and maintain these environmental quality standards. Water areas are strongly affected by organic soluble pollution, shown mainly in BOD and COD Values, Evaluation of water conditions related to the conservation of living environment are shown as follows.
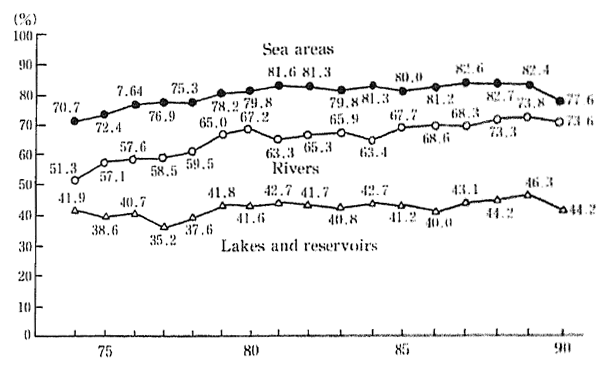
Examining the degree to which environmental quality standards for BOD and COD have bee achieved since 1974, we can see that in 1974, ocean areas registered 70.7 percent, lakes and ponds 41.9 percent, and rivers and streams 51.3 percent compliance. In 1990, these same three water areas registered 77.6, 44.2, and 73.6 percent respectively. This shows that although a considerable improvement was evident for rivers and streams, the improvement to ocean areas or to lakes and reservoirs was not nearly so remarkable. In fact, the figures for 1990 show a slight deterioration when compared with those for the previous year (Figure 1-1-18).
The level to which environmental quality standards have been achieved remains low in lakes and reservoirs and in enclosed coastal seas. Environment quality standards for COD have not been achieved in typical lakes such as Kasumigaura (Ibaragi Prefecture), Suwako (Nagano Prefecture), and Biwako (Shiga Prefecture). The quality of lake water is deteriorating and resulting in problems such as increasing eutrophication, offensive odors in drinking water, impaired filtering at water purifying plants, harmful effects upon fish, and decreased water clarity. Steps are being taken in the case of 9 lakes such as kasumigaur-a which have been designated by the Law Concerning Special Measures for the Conservation of Lake Water Quality and although a certain amount of improvement has been noted, the water quality of these lakes still falls short of the environmental quality standards.
Fig. 1-1-18 Achievement Rate of Environmental Quality Stan-dards (BOD or COD) (by Water Area)
Source Environment Agency
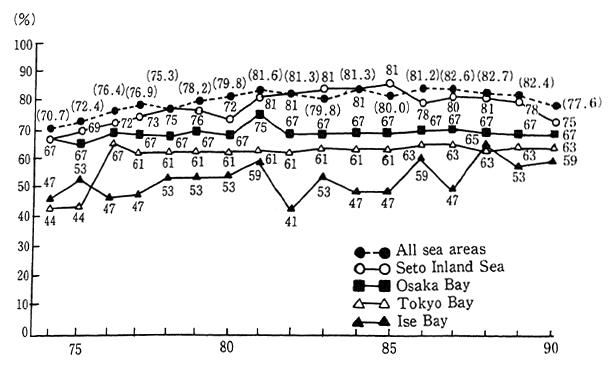
The semi-closed ocean areas of the Tokyo Bay, Ise Bay and the Seto Inland Sea, are subject to area-wide total COD water pollutant load control established in accordance with the Water Pollution Control Law etc. In reviewing the compliance status for COD standards for these three areas, it is apparent that particularly in the cases of Tokyo Bay and Ise Bay, the conditions are quite inferior to the overall ocean areas. Poor conditions also exist in sirens such as Osaka hay of the Seto lnland Sea. The dincharge of nutrients such as nitrogen compounds and phos-phorus compounds into these types of semi-closed ocean areas is also responsible for eutrophication. Furthermore, the occurrence of red tide and blue tide has produced conditions that have harmed fisheries and damaged ocean swimming areas, created offensive odors, and polluted beaches. Since these semi-closed ocean areas are subject to poor water exchange with the open sea areas, they are prone to accumulating these polluting substances (Figure 1-1-19).
Fig. 1-1-19 Achievement Rates of Environmental Quality Standards (COD) in Closed Water Areas
Source Environment Agency
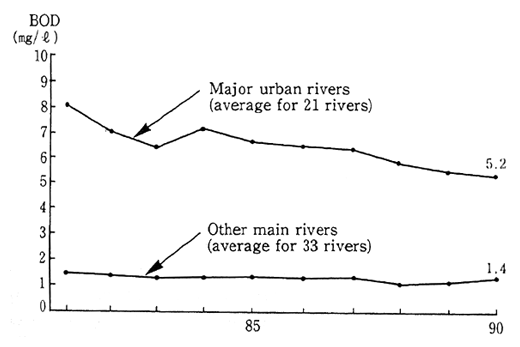
Fig. 1-1-20 Water Quality of Rivers
Source Environment Agency.
There has also been no improvement in the conditions of the severely polluted urban rivers. Examining the conditions of urban rivers and other main rivers on the basis of BOD, it is apparent that in 1990 the pollution of urban rivers was as serious as ever. Urban lifestyles bear a significant share of the blame for this type of urban river pollution and it is therefore necessary to implement much more stringent pollution control measures (Figure 1-1-20).
Table 1-1-5 Water Quality of Major Rivers and lakes in OECD Countries (BOD, Total Phosphorous, Total Nitrogen)
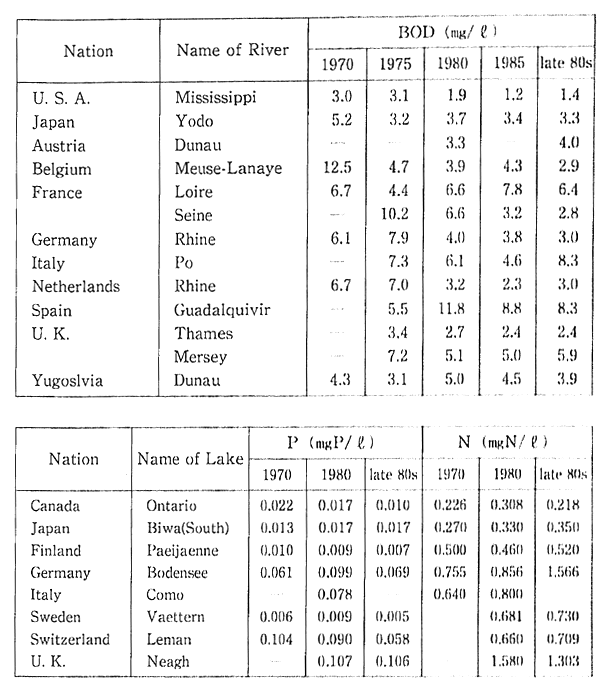
Source OECD Environmental Data Compendium 1991
Note Water Quality of Rivers are measured at the mouth or downstream frontier of the rivers, The Readers should be cautious when interpreting this table, especially because large differences of munber of monitorring site and method of monitoring among countries. A comparison between two or more cities does not seem to be advisable, a comparison of trends is preferable.
Water quality conditions of the major rivers and lakes in indus-trialized countries over the past twenty years are shown in Table 1-1-5. It will be noted that come of these rivers show no significant improve-ment even over the long term.
(3) Water and sediment quality in neighboring oceans
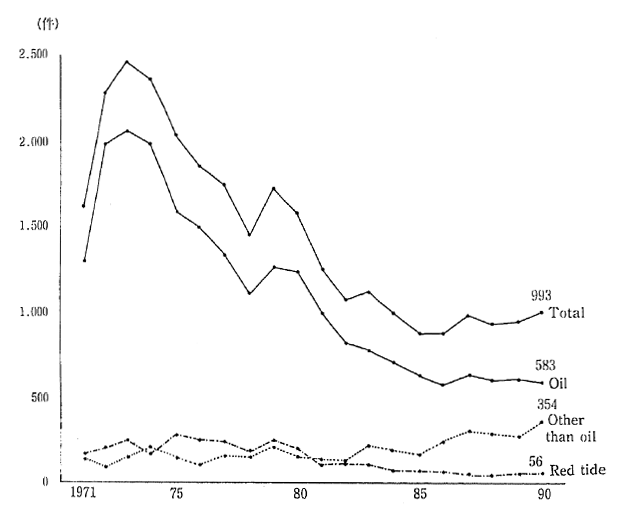
The number of cases of marine pollution that have been con-firmed in the ocean waters neighboring Japan have fallen from 2460 in 1973, to 993 in 1990. This is largely due to the decrease in the number of cases of oil-related pollution from 2060 to 583. On the other hand, the number of confirmed cases of non-oil-related pollution, such as waste disposal, increased from 154 in 1973, to 354 in 1990 (Figure 1-1-21).
Fig 1-1-21 Number of Ascertained Cases of Marine Pollution
Source: Maritime Safety Agency
The Marine Pollution Control Law prohibits, in principle, the dumping of waste at sea. The disposal of specific types of waste is permitted if conducted according to designated disposal methods, and in designated areas (e. g. offshore at Boso, Shikoku, Sanriku and the Japan Sea) where the marine conditions are judged suitable for such disposal (Figure 1-1-22). According to a 1990 survey conducted by the Maritime Safety Agency on pollution levels in neighboring ocean waters where wastes are being disposed, water quality was at about the same level as before. and there was no particular worsening of pollution level.
Fig. 1-1-22 Wastes Dumping Areas in the Sea around Japan
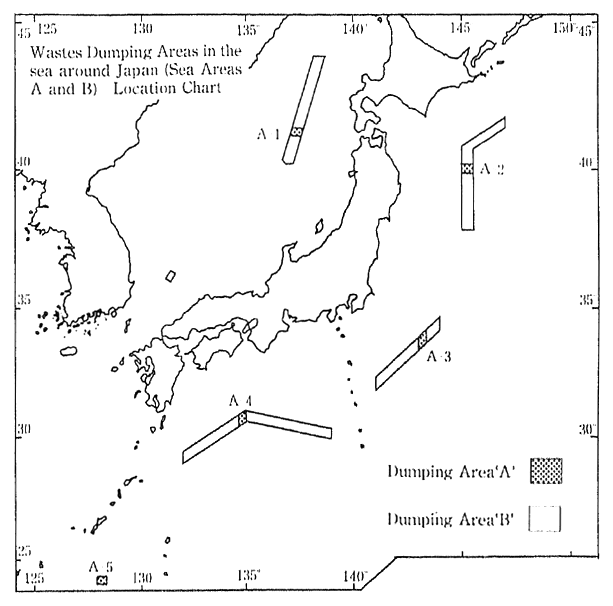
Source Environment Agency
According to monitoring by the Maritime Safety Agency, there was a notable decrease in the number of tar balls drifiting in the sea or floating ashore during the early 1980s. Nevertheless, there are still numerous drifting tar balls near the Southwestern Islands, and near the south coast of Honshu, and there are numerous tar balls floating ashore in the Southwestern Islands, the south coast of Honshu, and the west coast of Kyushu. A survey of floating debris has also been conducted by the Environment Agency offshore of Boso, Shikoku, Sann-in and the Southwest Islands. The results of this survey, as shown in Figure 1-1-23, indicate that there is a great deal of man-made floating debris.
According to a survey conducted by the Fisheries Agency in 1990 on the distribution of floating debris in the North Pacific Ocean, the majority of floating debris (55.4 percent) was discovered to be plastic material, most of which was found in the central Pacific Ocean and in the adjacent seas of Japan.
Fig. 1-1-23 Numbers and Compositions of Drifting Materials Observed
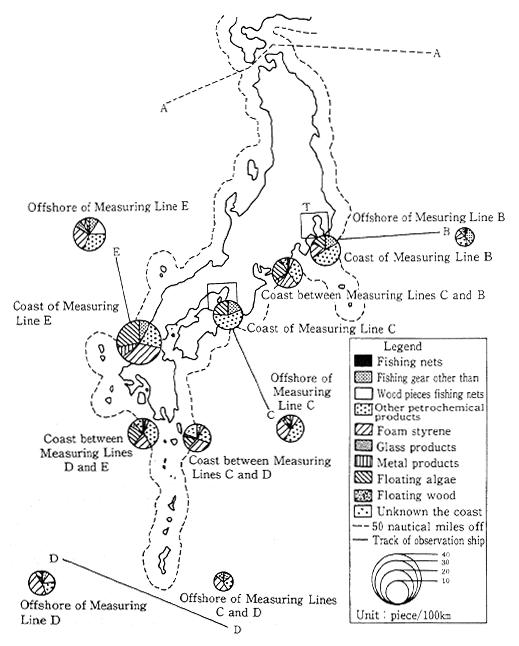
Source. Environment Agency
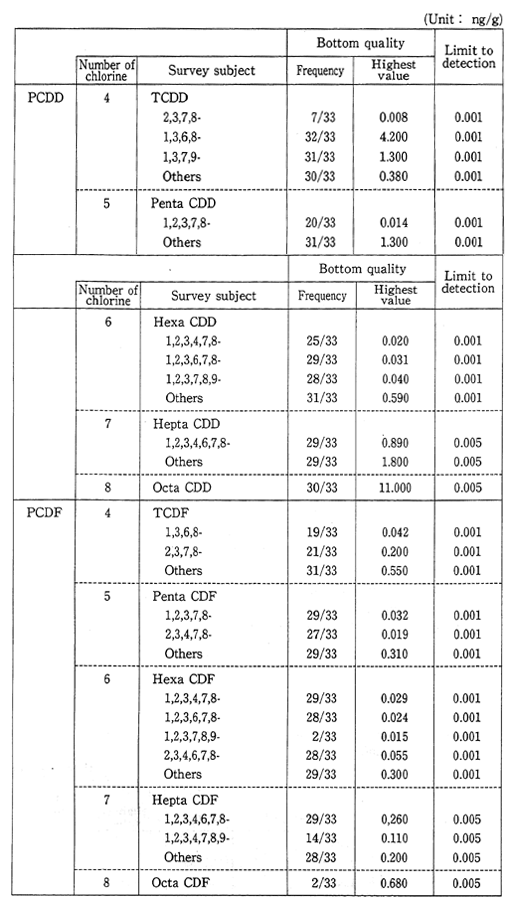
It is believed that chemical substances are apt to accumulate in the bottom sediment of water areas. As a result, an environmental survey to detect the presence of chemical substances is carried out each year in the bottom sediments of rivers, lakes, and oceans not subject to the direct effect of any speciffic source of effluent in order to determine the type and concentration of residual chemical substances. The survey examines different substances every year. In 1990, the survey focused on 22 substances, of which 10, such as aniline, were detected. Certain substances, for which it is necessary to observe trends over fixed intervals, do exist. However, it is not believed that any substances detected to date suggest any immediate problems. Bottom monitoring is carried out in order to make long term observations of pollution by chemical substances whose detection in the environment has been confirmed. As a result of the detection of chlordane and DDT com-pounds, it is necessary to continue monitoring.
Surveys are carried out in the bottom sediments of rivers, lakes and oceans for residual concentrations of dioxins and other unintention-ally produced toxic substances, as well ans of chemical substances designated by the Law Concerning the Examination and Regulation of the Manufacture of Chemical Substances. These surveys will continue as a result of the detection of dioxins and toxic tin compounds (Table 1-1-6).
Table 1-1-6 Dioxins Concentration in Bottom Sediment 1990 (Bottom quality) Source Environment Agency
(4) Ground Water
Ground water is widely utilized as a source of high quality water. At present approximately 30 percent of municipal tap water is ground water. However, concerns about the quality of ground water have grown since the late 1970s, when ground water contamination from trichloroethylene and other chemical substances first appeared. In order to deal with this problem, the Water Pollution Control Law prohibits the discharge onto the ground of water containing toxic chemicals.
In the late 1970's, periodic inspections of ground water quality began. According to monitoring in 1990, the percentage of wells in which concentrations of chemical substances exceeded assessment standards were as follows: trichloroethylene 0.8%, tetrachloroethylene 1.4%, lead 0.03%, hexavalent chromium 0.03%, arsenic 0.02%, total mercury 0.1%, 1,1,1-trichloroethylene 0.02%, and carbon tetrachloride 0.05%. The vicinity well contamination survey, designed to determine the perimeter within which wells are contaminated, as well as periodic monitoring continuously conducted in the past, show that pollution is even more pervasive. There are wells that supply drinking water whose contamina-tion levels exceed assessment standards. Measures are being implement. ed to counter this pollution in wells, but it is also necessary to take preventive measures to ensure that non-polluted wells remain clean.
(5) Acid rain
Acid rain is defined as that where the hydrogen ion concentration results in a pH level of 5.6 or less. It is produced as a result of rain coming into contact with an atmosphere containing substances such as sulfur oxides, and nitrogen oxides. Measurements of sulfates and nitrates taken by Japanese national air monitoring stations show that there has been a considerable drop in the concentration of sulfates in accordance with the decrease in sulfur oxides discharged into the atmosphere. However there has been no drop in the concentration of nitrates. Acid. rain spreads contamination through rain drops falling to the earth, as well as by drifting through the air in the form of mist. In the latter case it is referred to as acid mist.
Acid rain affects our lives and ecosystem in various ways: Direct exposure to acid rain or acid mist causes trees and their vegetation to atrophy, it effects forests and the ecosystem through soil acidification, and by entering lakes and rivers it causes them to acidify, thereby effecting the aquatic ecosystem and depleting the populations of fish as well as other plants and animals. In cities, corrosion caused by acid rain damages architehtural structures and cultural assets.
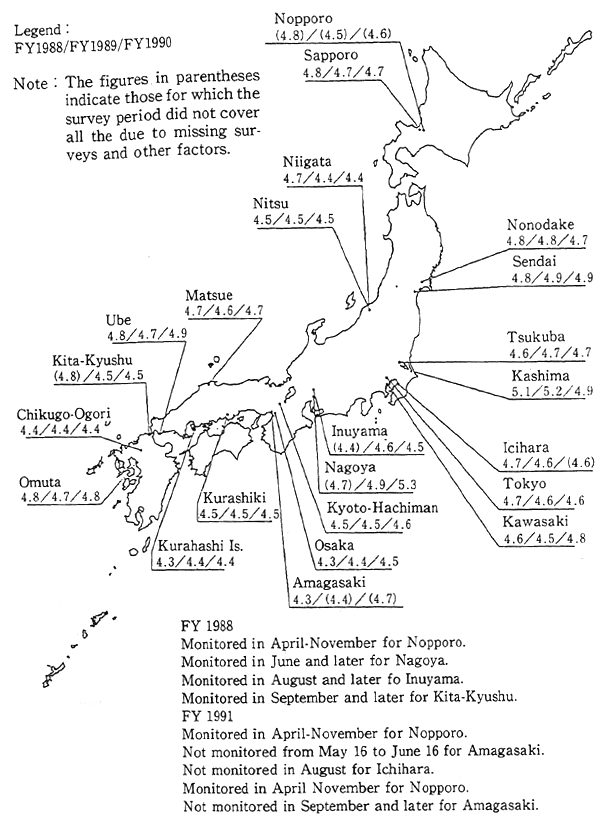
Fig. 1-1-24 pH Distributon of the Rainfall in Japan
Source Environment Agency
In Japan, the first phase five-years program of acid rain study was conducted from 1983 to 1987. Survey results showed an annual average pH reading ranging from 4.4 to5.5. Almost all lakes registered a neutral pH level of 7, and there was also no evidence of a trend towards soil acidification. However, the possibility of direct damage to vegetation as a result of acid rain cannot be dismissed. The acidification of soil and vegetation may occur gradually in the future. For this reason, a second five-years program of acid rain study, lasting until 1992, is currently being conducted (Figure 1.1-24).
International comparisons of acid rain do not reveal significant differences in terms of measured pH levels, however serioun damage attributed to acid rain has already been observed in other parts of the world. In particular, major damage has occurred in Europe, North America, and mainland China. In these places, high acidity rains falling over very large areas have damaged lakes and forests. Much of this is attributable to inaction and overdue measures to contain factory sulfur oxide emissions (Figure 1-1-25). Each Nation in beginning to take steps to deal with acid rain. In Europe, the Helsinki protocol of 1985, and in the United States, the 1990 rdvision of the Clean Air Act are strong measures to decrease acid rain by reducing the volume of sulfur oxides dincharged into the atomosphere.
Fig. 1-1-25 pH Distribution of th Rainfall in Europe, North America and China
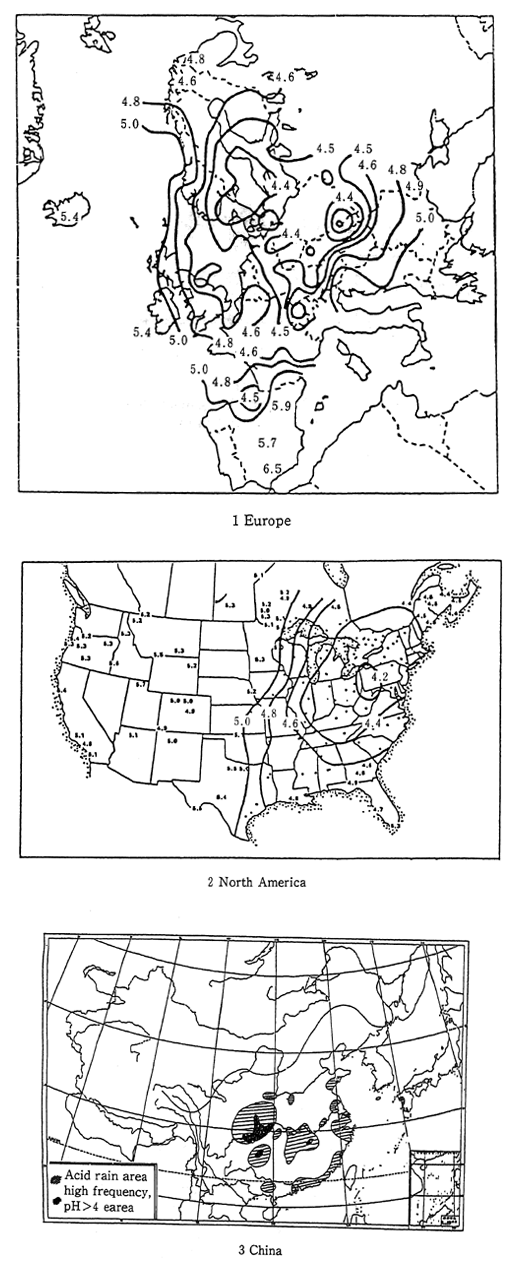
Source: Europe EMEP Data Report 1989 North America NAPAP Interim Assessment 1989 China Recent Environmental Problem in China, Acid Rain and others-; Zyen Kou
1-1-3 Soil, ground
(1) Soil
Soil pollution has one of the longest histories of all types of environmental pollution. Pollution of agricultural land in the Watarase River basin was already a social problem in the Meiji era. Major pollution problems also arose after the Pacific War, when substances such as cadmium were detected in places such as agricultural land in the Jinzu River basin. In order to deal with the problem of agricultural land pollution, the Agricultural Land Soil Pollution Prevention Law estab-lished standards for cadmium, copper, arsenic and their compounds, as well as special measures for dealing with land that exceeded those standards. As of 1990, surveys revealed that a total of 7,050 hectares of farmland exceeded the standards, of which 6,150 hectares were designat-ed for clean-up operations (Figure 1-1-26).
Fig. 1-1-26 Progress of Farmland Pollution Treatment Project
Source: Environment Agency
Table 1-1-7 Number of Cases with Measures Taken Against Soil Pollution in Urban Areas by Business and by Pollutant
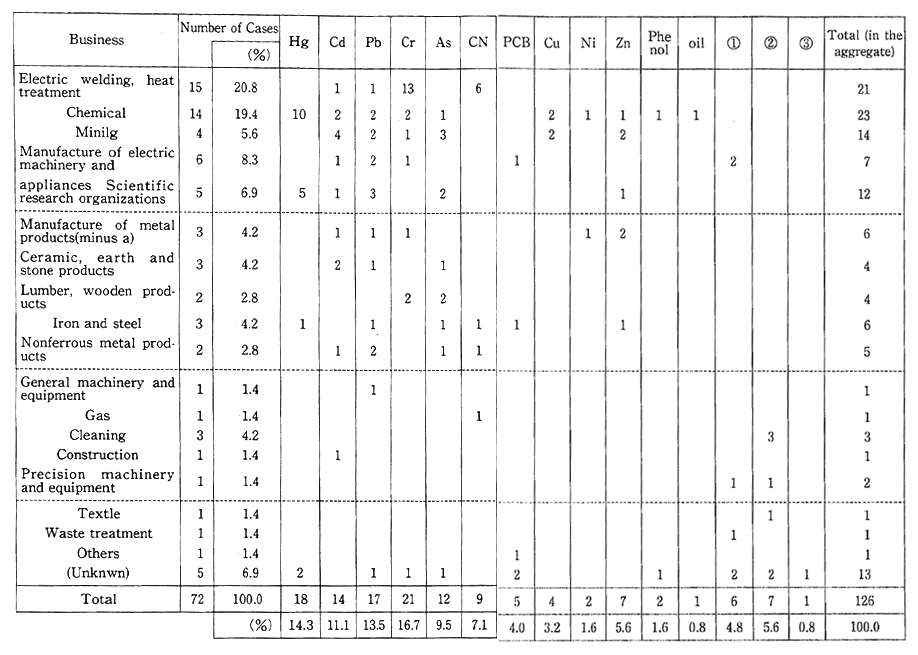
Note: (1) trichloroethylene.
(2) tetrachloroethylene,
(3) 1,1,1,-trichloroethylene
Source : Environment Agency
Urban redevelopment also reveals many cases of soil contamina-tion with toxic substances at the site of former factories or research laboratories. This type of urban land pollution mainly began to appear after 1975. So far, a total of 72 cases have been reported to the Environ-mental Agency by municipalities and other local governments. The main sources of such pollution are leakage from damaged manufactur-ing process facilities, inappropriate disposal of wastes in the sites of factories dating back to the days before enactment of the Waste Disposal and Public Cleansing Law, and unsuitable treatment of toxic substances. The types of industries responsible for most of this pollution are electroplating, heat treatment, and chemical plants. Most of the toxic substances are hexavalent chromium, mercury, lead, and cadmium (Table 1-1-7). In an effort to deal with this problem, a new set of environmental quality standards applying to agricultural and non-agricultural land were established in August 1991.
In the Ulited States, major soil pollution problems are now coming to the fore as a result of organic solvents leaking from factories, or pollution from waste disposal sites that were established in the days before stringent anti-pollution regulatdons.
(2) Ground Subsidence
Ground subsidence is grought about by the excessive extraction of ground water.
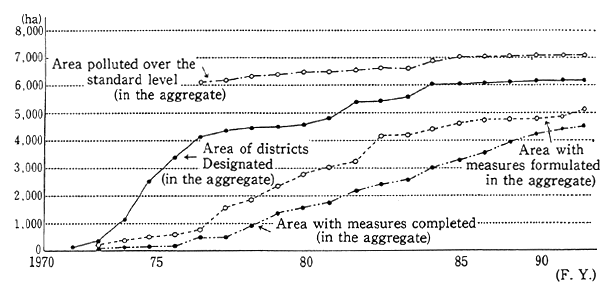
Once it has subsided, ground cannot return to its former level. This can cause severe damage and problems to architectural structures. Ground subsidence was already observed in Tokyo's Edo-ku and in West Osaka before the Pacific War. After the war, economic stagnation resulted in a temporary pause, but by the mid-1960s it resumed countr-ywide, with some locations even recording a severe drop of more than 20cm annually. After that, as a result of regulations on the use of ground water, land subsidence has gradually decreased. However, even in 1990, 5 locations (a total of 14km2) dropped by more than 4cm, and 18 loca-tions (totaling 360km2) dropped by more than 2cm. Particularly affected are the Northern Kanto Plain, the Kujukuri Plain in Chiba prefecture. and Chikugo-Saga Plain in Saga prefecture (Figure 1-1-27).
Fig. 1-1-27 Land Subsidence Across the Nation in FY 1991
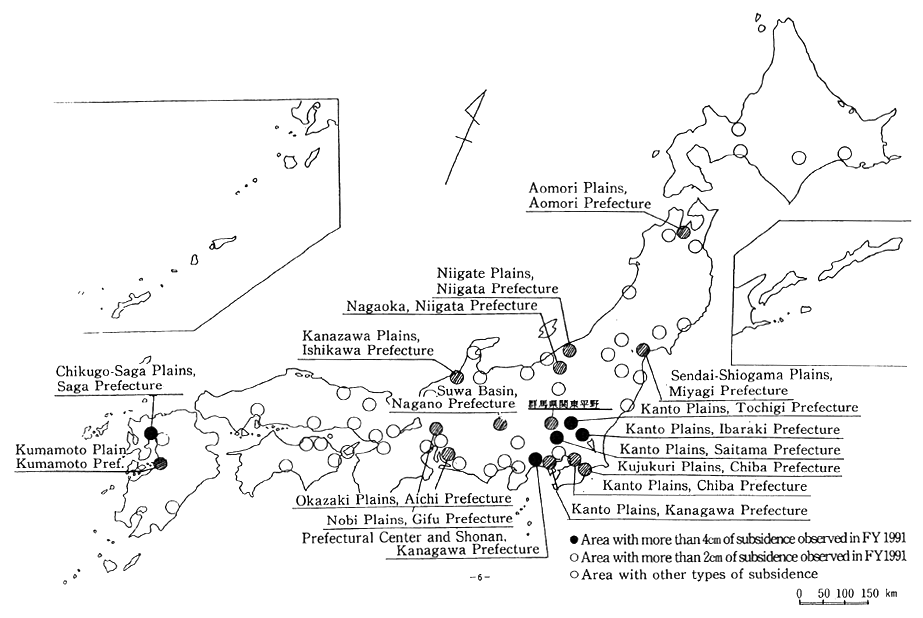
Source: Environment Agency
1-1-4 Noise and Vibration
The noise problem deeply affects our lives. Sources of noise include factories, traffic, construction, late night business activity, as well as noise produced by people in their homes. The single most numerous type of complaint registered with public authorities is related to noise; in 1990 for example, 24.6 percent of all complaints were about noise. In addition, complaints about vibration are often related to noise complaints, and represented 2.9 percent of the total number of pollution complaints (Figure 1-1-28). The major sources of noise are factories and other sites of commercial or industrial activity, followed by construc-tion and late night business activity. Among these, those which are also sources of vibration complaints include construction, followed by fac-tories and other types of industrial and commercial activity.
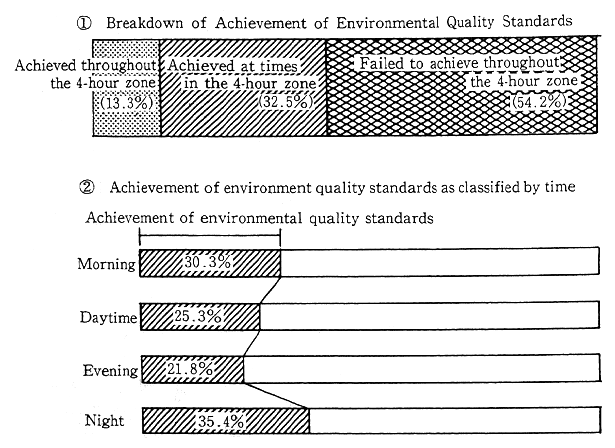
Fig. 1-1-28 Achievement of Environmental Quality Standards on Automobile Noise
Source: Environment Agency
Specific environmental noise standards have been established and measures implemented to deal with the ordinary residential environ-ment and with noise from automobiles, aircraft, and the Shinkansen lines, according to specific times of day as well as with consideration for regional land utilization. Noise created in the vicinity of major transpor-tation facilities is a serious problem.
The rate of achievement of environmental quality standards regarding automobile traffic noise worsens each year. Measurements collected from 4,585 monitoring points nationwide in 1990 indicated that no more than 13.3 percent of the locations met environmental quality standards for all four time periods of morning, noon, evening, and night. Conversely, 54.2 percent of locations failed to meet noise standards during any one or more of the four time periods. The trend for the achievement of environmental standards as revealed by data gathered from 1,056 locations where noise measurements have been continuously made for five years, indicates a steadily worsening trend. In 1990, less than 10% of these locations met the standards. Also, request limits at which local governors ask their public safety commissions to take relevant measures according to the Noise Restriction Law (5 to 15 dB higher than the environmental quality standards) are being exceeded more often than the previous year. 69.0% of all monitoring points met the request level during all 4 time periods. The rate of exceeding request level is increasing, as revealed by data from 1056 monitoring points where noise measurement have been made for 5 years. The rate of sites which meet the request level at all 4 time periods is decreasing, down to 63.6% in 1991 (Figure 1-1-29).
Fig. 1-1-29 Number of Complaints About Noise. Vibration and Offensive Odor
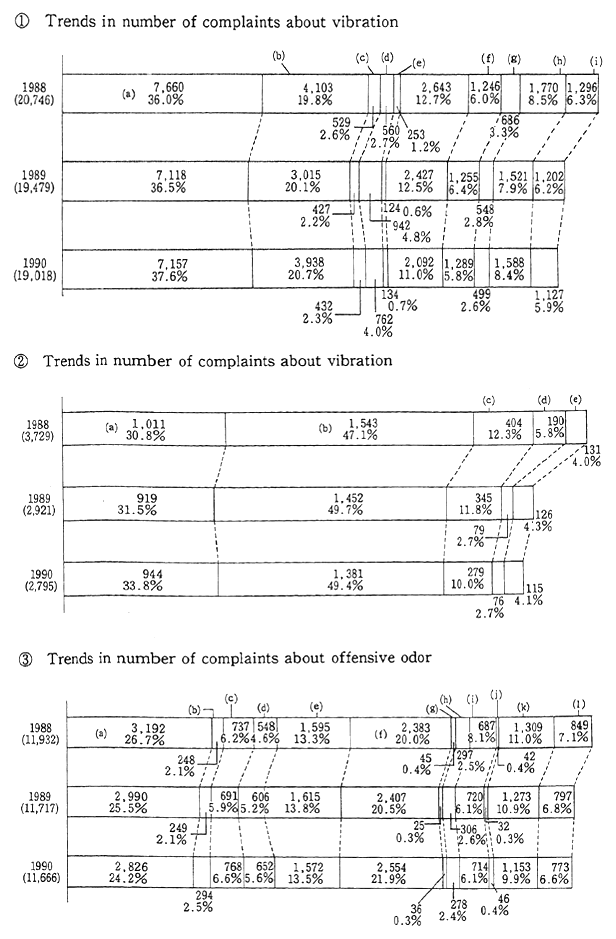
(a). factory
(b). construction
(c). automobile
(d). plane
(e). railway
(f). mid-night business
(g). other business
(h). loudspeaker
(i). family speaker
(j). others
(a). factory
(b). construction
(c). traffic
(d). railway
(e). others
(a). stock farming
(b). feed factory
(c). food factory
(d). chemical factory
(e). otcer factory
(f). service
(g). mobile sources
(h). construction
(i). sewage
(j). waste
(k). apartment
(l). unknown
Aircraft noise has been reduced in vicinities surrounding certain major airports such as Tokyo, Osaka, and Fukuoka, compared with noise levels when the environmental quality standards wore established. But there are few airports where environmental quality standards are met at all monitoring points.
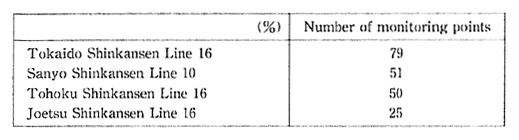
Regarding vibrations caused by the Shinkansen, most of the areas alongside the Tokaido Sanyo Shinkansen, and all of the areas alongside the Tohoku and Joetsu Shinkansens achieve the guideline values of 70 dB. However with regard to noise, there are numerous locations where the environment quality standards for noise fail to be met, although specific noise prevention measure have resulted in considerable improvement. In accordance with efforts in recent years to accelerate the Shinkansen, it will be necessary to take adequate measures to ensure that noise conditions will not deteriorate (Table 1-1-8)
Table 1-1-8 Acrievement of Environmental Quality Standards on Noise by Shinkausen Trains
Source : Environment Agency
Noise and vibration complaints have also been filed about con-ventional trains other than the Shinkaiisea. In particular, a umber of problems with noise and vibration accompanied the opening of the Tsugaru Kaikyo line in March 1988, and the Seto Ohashi line the following April. Measures to deal with these problems are being devised and implemented.
1-1-5 Offensive Odors
Offensive odors constitute sensory nuisances in the same manner as noise or vibration. It is a problem which is very intimately connected with our daily life. In 1990, 15.4% of all complaints received from citizens were related to offensive odor. This was send highest after complaints about noise. Origin of the offensive odors that caused com-plaints broke down as follows: manufacturing plants 28.2%, livestock & agriculture 24.2%, and the service sector 219%. As urban sprawl pushes new residential areas further away from the city, residents frequently find themselves living next to factories that had been located in the rural area for a long time. This is often at the root of such complaints.
1-1-6 Pollutant Residues in Organisms
Chemical substances are recognized to exist in a variety of environmental media such as the air, water, bottom sediment, and soil. The organisms which depend upon these environmental media, and that make them their habitat, may be contaminated by chemical substances. It is also known that organisms accumulate and concentrate specific chemical substances, thus containing higher concentrations of these substances than are measured in their surrounding environment. In addition, since the measured values for organisms stabilize and repre-sent for the integral of a certain period of time, it is possible to obtain a large variety of useful data on pollution level trends, or on the behavior in the environment of chemical substances thought harmful for human health or for the ecosystem by measuring the level of chemical contamination in organisms.
The Comprehensive Environmental Survey on Safety of Chemi-cals, therefore targets different chemical substances each year, for the purpose of determining the concentration of chemical substances of fish in rivers, lakes and oceans that are not known to be directly effected by any specific source of pollution. In 1990, five out of the twenty-one substances tested for were detected, and although some chemical sub-stances that require interval monitoring of concentration trends have been found, there is nothing to suggest an immediate problem.
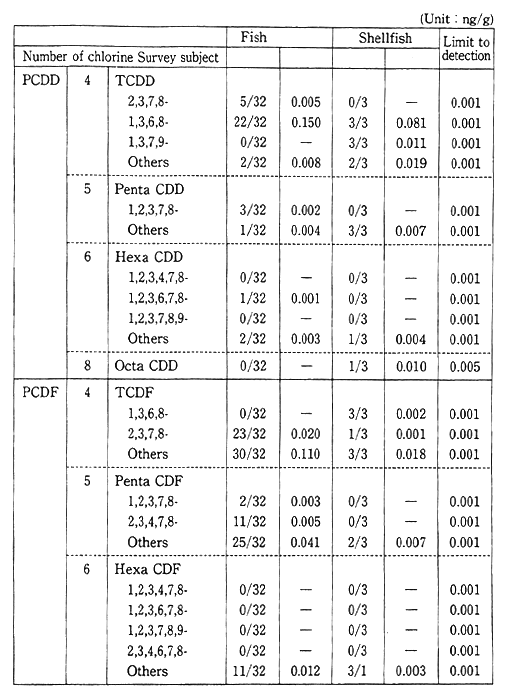
Monitoring for fishes, shellfish and birds, for the purpose of carrying out periodic, long-term observations, has detected PCB, chlor-danes etc. in fish (Table 1-1-9). Surveys are also conducted for dioxins and other harmful chemical substances which are formed unintention-ally. Since these substances were detected in fish, these surveys will also continue (Table 1-1-10). The current level of dioxins in the ordinary environment is not thought to represent a threat to human health. However it is necessary to continue observations and to carry out the study of the pollution mechanism.
Table 1-1-9 Dioxins Concentration in Living Things
Source: Environment Agency
Table 1-1-10 Findings of Biological Monitoring
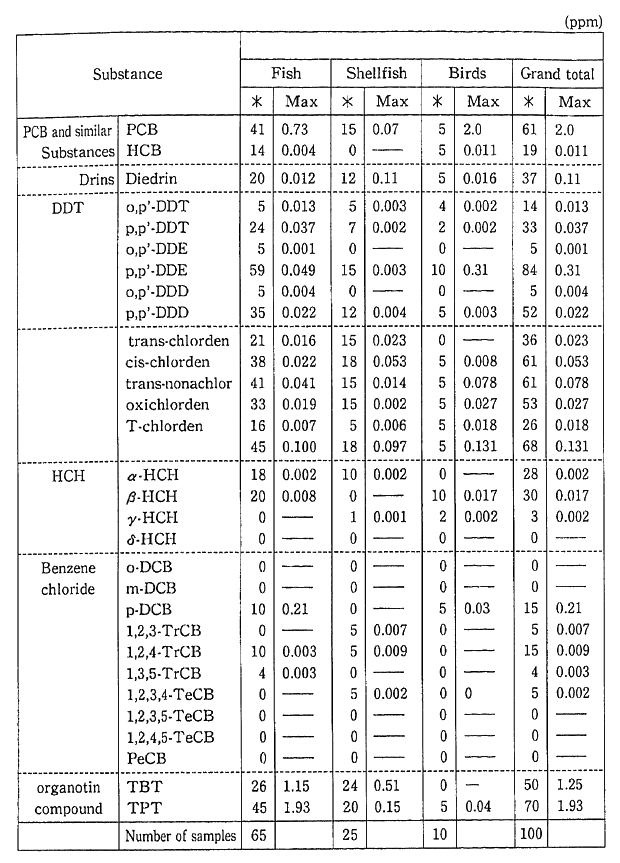
Note For benzene chloride, the value is for FY1988.
Source: Environment Agency
*: Frequency
1-1-7 Solid Waste
The Wastes Disposal and Public Cleansing Law classifies solid waste into two general categories: domestic wastes (household refuse) consisting of raw sewage and other garbage generated by normal human activity, and industrial waste such as sludge that is discharged as a result of industrial activity. In the following section we shall address these two categories of waste as well as the issue of transboundary movement of hazardous wastes to third countries. This latter concern is a transboundary environmental problem that demands urgent attention.
(1) Household waste
In 1989, routine municipal wastes in Japan amounted to 49.973 million tons, or 406.6 kg per person. Both of these figures represent increases over the year before. Trends reaching back to 1985 point to a consistent increase in volume. More diverse lifestyles are also reflected in a growing variety in the types of garbage. There has been an increase in household wastes such as large appliance, which are hard to dispose. Waste disposal sites, and particularly securing final disposal sites, is becoming a major problem. Space for the disposal of municipal waste is rapidly running out. In 1988 it was estimated that there was only about four years worth of space remaining in the municipal waste disposal sites in the capital district consisting of the Tokyo metropoli-tan area, and Chiba, Kanagawa, and Saitama prefectures.
The amount of household waste per person in Japan is not inordi-nately high whet considered in terms of international comparison, however in the five years from 1985 to 1989, the rate of increase in domestic waste per person in Japan was among the highest in the world. For a country such as Japan, where area for waste disposal sites is scarce, keeping a lid on the increase in domestic waste is becoming a major issue.
As a result of the increasing diffusion of flush toilets among the population, the volume of raw sewage has been falling in recent years. In 1989, there was a total of 36.87 billion liters of raw sewage, compared to 37.51 billion liters in 1988. On the other hand, the volume of sewage sludge and digester chamber sludge is increasing (Figure 1-1-30).
Fig. 1-1-30 Trends in Population With Human Waste Water Treatment
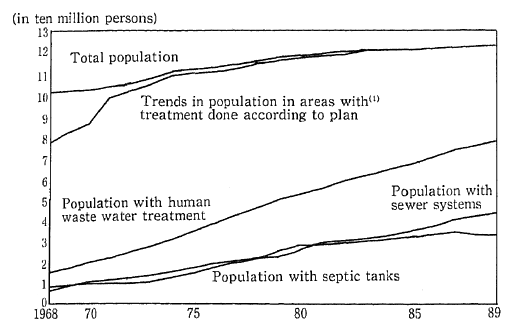
(1) Population of areas with treatment done according to plan (Population of Special Cleaning Areas before (FY 1970)
Source: Ministry of Health and Welfare
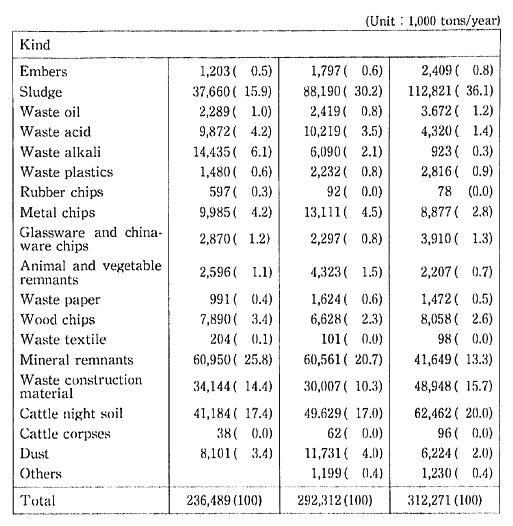
(2) Industrial waste
The volume of industrial waste in 1985 was 312.27 million tons, or about seven times that of household waste. A breakdown by category shows that 36.1% is sludge, 20.0% is livestock excrement, 15.7% is construction materials waste, and 13.3%t is slag. Once every five years, the Ministry of Health and Welfare conducts a nationwide survey of industrial waste. Trends in composition of industrial waste since 1975 indicate that there is a conspicuous increase in the percentage of sludge (Table 1-1-11).
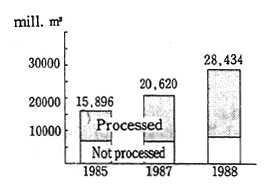
Of the total industrial waste generated in Japan, 90.33 million tons, or 28.9%, which excludes quantity losses from intermediate proces-sing as well as recycled waste products, must be sent to final disposal sites. For this reason, securing sufficient final deposit sites for industrial waste is a major problem. By the end of February 1990. the remaining space in final deposit sites for industrial waste was 156.67 million m3 The situation is particularly acute in the capital region (metropolitan Tokyo, and Chiba, Kanagawa, and Saitama prefectures) where avail-able space has decreased from 20.17 million m3 1986 to 7.14m3 1989 Industrial waste is moved to one prefecture to another prefecture. Lack of disposal sites may cause an increase in illegal dumping which can be a serious problem.
Table 1-1-11 Discharge of Industrial Wastes in Japan
Source: Ministry of Health and Welfare.
Note: The figures in parentheses represent shares in the total discharges.
There are also types of waste whose disposal requires special handling, which threatens the adequate disposal of industrial waste.
Most member countries of the OECD have failed to get an accurate grasp of the quantities of industrial waste they generate. Accurate estimates of quantities involved, not to mention accurate international comparisons are the more difficult for differences between definitions of industrial waste. Nevertheless, the annual production of this type of solid waste by all OECD member countries in the first part of the 1980s was estimated at about one billion tons, in the mid-1980s at 1.3 billion tons, and in 1990 at 1.5 billion tons (Table 1-1-12).
Table 1-1-12 Amount of Industrial Waste in OECD Countries
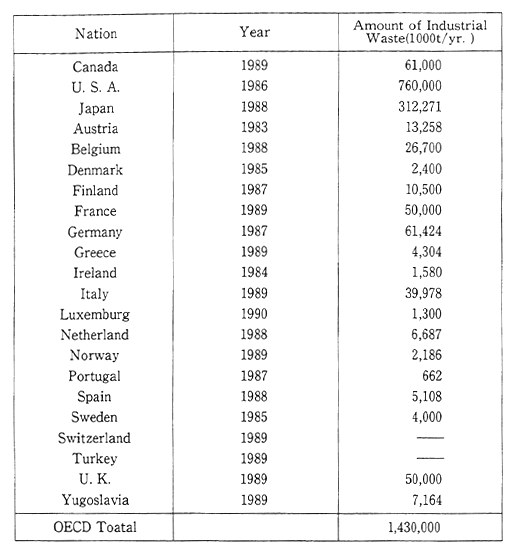
Source: OECD Environmental Data Compendium 1991
Note: When interpreting this table, it should be bourn in mind that definitions vary considerably from country to country.
(3) Transboundary Movement of Hazardous Wastes
Hazardous wastes are apt to be moved from countries where disposal costs are high, to those where they are low, and from countries which have strict regulations on waste disposal, to those which have only loose ones. People fear that hazardous wastes might he disposed in the country which have poor technology for proper disposal of hazard-ous wastes, and might give severe damage to its environment.
A famous case is the Seveso Contaminated Soil Incident. It began with an explosion at an Italian fertilizer plant in 1976 that resulted in quantities of soil becoming contaminated with dioxins. At first this contaminated soil was stored at the plant, but in 1982 it was suddenly missing. Some time later it was discovered in a small village in France. The Koko incident is also well known in which waste including waste toluene originating in Norway was exported to Nigeria and disposed.
The United Nations Environment Program started to establish international rules dealing with this problem, stimulated by the inci-dence described ahove. In March 1989, in Basel Switzerland, UNEP adopted the Basal Convention on Control of Transboundary Movement of hazardous Wastes and Their Disposal.
The number of signatory countries reached 20 which is necessary for the Convention to come into force, the Basel Convention took effect on 5th May 1992. Japan should also he a signatory to this treaty and is in fact taking steps to do so in order to cooperate the international movement and prevent pollution caused by transboundary movement of hazardous wastes.
1-1-8 Pollution in the developing countries
The developing countries, and particularly those firmly on a path of industrialization, fare serious problems of air and water pollution. Problems are especially acute in the major cities where the population and economic activity concentrate.
We shall begin by examining the air pollution conditions in the major cities of developing countries located mainly in Asia. Concentra-tions of sulfur dioxide are indicative of the degree of air pollution. According to dots published in 1988, the average number of days per year that this substance exceeded 150ug/m3 was 68 days for Beijing, 87 days for Seoul, and 104 days for Teheran. The annual average number of days that total suspended particulates exceeded 230ug/m3 (date from high volume air sampler) was 272 days for Beijing, 268 days for Cal-cutta, and 174 days for Teheran. For the purpose of comparison, the annual average number of days that these conditions were exceeded in Tokyo was zero for sulfur dioxide, and 2 for total suspended particulate. This underscores the serious nature of the air pollution affecting major cities in the developing countries (Table 1-1-13).
Table 1-1-13 Air pollutants Concentration in Major Cities of Develop-ing Countries
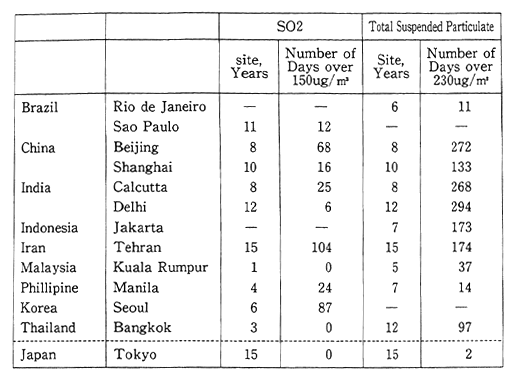
Source GEMS 'World Resources 1990-1991'
Note: l5Oμg/m3 of SO2 and 230μg/m3 are former guideline values of WHO. At present, guideline values of WHO. are 125オg/m3 24h average for SO2, 120μug/m3 24h average for total suspended particulate.
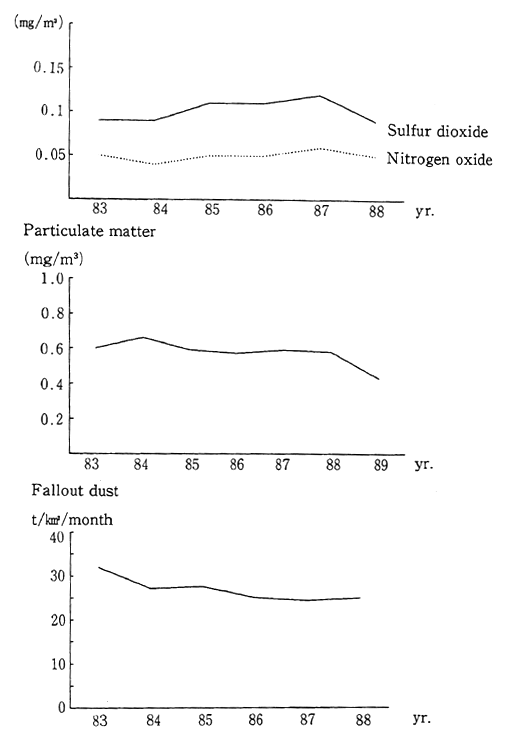
Taking China as an example of a country neighboring Japan, Figure 1-1-31 shows average nationwide data in the 1980s for sulfur dioxide, nitrogen oxides, suspended particulate matter, and precipitat-ing dust. Although the data indicate that these conditions have been improving, they remain much worse than in Japan.
In the case of river pollution, Table 1-1-14 shows three-year period data from 1979-81 to 1985-87 reflecting changes in median value BOD for nine major rivers in developing countries. These data show that river pollution is particularly severe in the Lerma River in Mexico, and the Sabarmati River in India (Ahmedabad). Other rivers such as the Kulung River in Malaysia display rapidly increasing levels of pollution. As is evident from the case of the heavily polluted Sabarmati River which flows through Ahmedabad (pop. 2.06 million), the severity of urban pollution is often reflected in such river conditions.
Fig. 1-1-31 Air Quality in China
Source: China Environment Science Society, "China Environmental Science Yearbook"
The Kulung River in Malaysia is polluted by many small, old factories such as textile, metallurgical, distillation, tapioca, or coconut factories. Substances such as ammonia nitrogen exceed provisional water quality standards set by the Malaysian government. In the case Karachi, Pakistan, about 237 tons of BOD flows into rivers every day. About 84.5 percent of that is produced by approximately 800 factories discharging untreated effluent.
Pollution in these developing countries is closely related to their socioeconomic conditions as well as to the international economy. The background of pollution in developing country is discussed in Chapter 3.
Table 1-1-14 Water Quality of Major River in Developing Countries
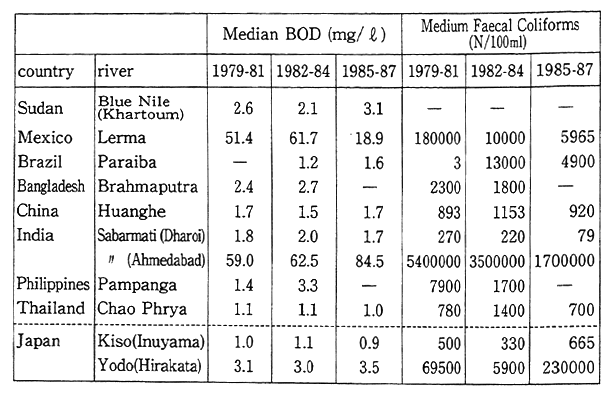
Source GEMS, 'World Resources 1990-1991'
1-1-9 Pollution in Eastern Europe and the Commonwealth of Independent States (CIS)
The countries of Eastern Europe and the CIS have been pursuing democratic reforms since 1989. Before introducing the market economy, these countries were under the control of a central planned economy. Environmental pollution reached extremely serious levels under the impact of these planned economies. The most common problems in Eastern Europe and the CIS are river and ground water pollution stemming from the excessive use of agricultural chemicals and ferti-lizers, and the discharge of sulfur oxides from power plants and heat supplying facilities. Under orders to increase production, the efforts by factories to protect the environment were not evaluated as an achieve-ment of the factories. As a result, anti.pollution measures including environmental impact assessment were largely disregarded, and indus-trial activity that was inefficient and that generated a wide variety of environmentally hazardous side-effects tended to be the norm. Eco-nomic policies placed very low prices upon petroleum or water for irrigation. Consequently these resources were squandered, and pollution and damage to the environment frequently resulted. Because of under-developed democracy, there were few protest movements by the victims of pollution, and it was difficult to implement such policies to improve the situation even after pollution had already taken its toll.
Democratization of Eastern Europe, sparked by the protest movements against pollution and destruction of nature formerly oppres-sed, exemplifies the extreme social significance of conserving the environment. Based on environmental reports issued by these countries' governments, we shall examine the state of the environment in the CIS, and in two of the Eastern European countries with the longest industrial tradition, namely Czechoslovakia and Poland.
(1) The CIS
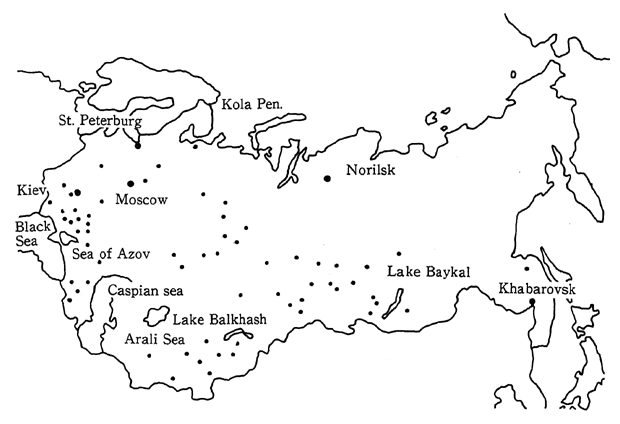
The CIS neighbors Japan just across the Japan Sea. The closeness of these two countries is illustrated in a number of ways including the fact that numerous species of migratory birds regularly bridge the gap. As a result of perestroika, knowledge concerning the state of the environment in the CIS is now available from a 1988 report on the environment issued by the Soviet National Committee for the Protec-tion of Nature.
Fig. 1-1-32 Emission of Main Air Pollutants in Ex-USSR
Source; Ex-USSR State Committee for Protection of Nature, "Report on the State of the Environment in the USSR 1988"
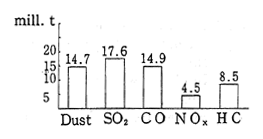
Air pollution in the CIS is conspicuous for sulfur oxides and nitrogen oxides produced by power plants and heat supplying facilities. In 1988, a total of 98.0 million tons of pollutants were discharged into the air, including 17.6 million tons of sulfur dioxide, 14.9 million tons of carbon monoxide, 14.7 million tons of particulate substances, 8.5 million tons of hydrocarbons, and 4.5 million tons of nitrogen oxides (Figure 1-1-32). Of this total, 62.0 million tons of pollutants are attributed to fixed sources and 36.0 million tons are attributed to mobile sources. Compared to 1986 data for Japan, according to which sulfur oxides and nitrogen oxides were estimated at 0.835 and 1.176 million tons respec-tively, it is clear that in the CIS, more than tens times as much sulfur dioxide is discharged into the atmosphere than is the case in Japan. Consequently, air pollution in industrial areas and in the cities with a large emission volume from mobile sources, is particularly severe. In 1988, sixty-eight cities of the CIS were affected by major air pollution. These conditions were concentrated in industrial areas, in capitals of the Republics and in cities with populations of over one million (Figure 1-1-33).
Fig. 1-1-33 Emission of Water Pollutants in Ex-USSR
Source: Prepared by the Environment Agency on the basis of 'the Report on the State of the Environment in the USSR 1988' by the ex-USSR State Corn-mittee for Protection of Nature
Turning to water pollution, over 30.0 million tons of chlorides, sulfides, and organic pollutants were discharged in the water. The sources of these pollutants included the overuse of agricultural chemi-cals and fertilizers, and factory effluent. Pollution is getting worse in inland bodies of water such as the Black Sea, the Caspian Sea, the Sea of Azov, and Balkhash Lake and there are even places (Balkhash Lake) where it is prohibited to eat the fish (Figure 1-1-34).
Fig. 1-1-34 Cities with the Highest Air Pollution Levels in Ex-USSR,
Source: Ex-USSR State Committee' for Protection of Nature, 'Report on the State of the Environment in the USSR 1983"
Extremely serious environmental damage has also resulted from the excessive use of water for irrigation. Major rivers have been dammed in order to supply water for the irrigation of farmland, and as a result, the flow of water to lakes and seas has been decreased. For example, the flow from the Amu Dar'ya and Syr Dar'ya, two major rivers entering the Aral Sea, has been reduced in order to provide irrigation water for cotton plantations. As a result, in less than 30 years from 1960 to 1988, the water level of the Aral Sea has dropped 12 meters, the area of the sea has been reduced to one third of its former size, and the volume of water has decreased by 60 percent. The fishing industry has been destroyed, the volume of agricultural products has been reduced, there are health problems, and the air is polluted with clouds of dust including salt particles stirred up from the dry seabed. The same problems can also be observed in the Sea of Azov, where damage to spawning grounds in river estuaries has severely decreased the size of the catch.
In addition, air pollution has become a serious problem in the industrialized polar regions of the CIS such as the Kola Peninsula, or Norilsk. Pollutants such as PCB and lead have been detected in the Arctic regions in recent years. The impacts from the industrialized polar regions on the environment in the Arctic is concerned.
(2) Czechoslovakia
Czechoslovakia has been one of Eastern Europe's most industrial-ized countries from before the first World War. Environmental prob-lems that are particularly conspicuous in Czechoslovakia are air pollu-tion caused by sulfur and nitrogen oxides, as well as the resulting deforestation.
Table 1-1-15 Emission of Major Air Pollutants in Czechoslovakia 1985-1990
Source: "State of Environment in Czechoslovakia 1991", Federal Committee for Environment, Czechoslovakia
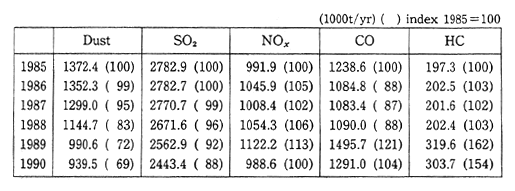
In 1950, the volume of sulfur oxides discharged into the atmo-sphere in Czechoslovakia was about 900,000 tons. By 1985, this figure had rapidly increased to 3.15 million tons. Since then, the volume has been decreasing as a result of a combination of warmer winters and economic stagnation (Table 1-1-15). About 79 percent of this discharge is the result of the combustion of fossil fuels such as coal, lignite, and petroleum. The main source (71 percent) of nitrogen oxides is also related to energy producing facilities, which is followed by transporta-tion (22 percent). As a result of these emissions, the level of air pollution around Prague and the northern industrial area of Bohemia is extremely high. In Prague, observations of sulfur dioxide have been carried out from January 1982 to February 1987 and there have been observations of concentrations in excess of 3000ug/m3(approx. 1.2 ppm), with the highest recorded concentration of 3193ug/m3 (approx. 1.27 ppm). In the northern Bohemia region of Chomutov, there were an average of 117 days per year in which the sulfur dioxide concentration exceeded the Czechoslovakia standard of 150ug/m3. The highest observed levels in northern Bohemia were for January 1982 when 2440ug/m3 (approx. 0.98 ppm) was recorded at Ossek and 2977ug/m3 (approx. 1.19 ppm) was recorded atLitvinov.
There is also a striking amount of pollution resulting from nitrogen oxides. The Czechoslovakia standard for this is lOOug/m3 (approx. 0.05 ppm). A total of 7,985 ha exceeded this value, of which 424. 3 ha exceeded 500ug/m3 (approx. 0.27 ppm). By comparison, while Japanese standards for these substances are lOOug/m3 (approx. 0.05 ppm) in the case of sulfur dioxide, and 75-llOug/m3 (approx. 0.04-0.06 ppm) in the case of nitrogen oxide, actual concentrations measured in Japan in 1990 were at the level of 25ug/m3 and 52.5ug/m3 for sulfur dioxide and nitrogen dioxide respectively. In regard to sulfur dioxide, the level of pollution in Czechoslovakia exceeded the highest-levels in Japan by a considerable margin (Figure 1-1.35).
Fig. 1-1-35 State of Air Pollution in Czechoslovakia
Source: Federal Committee for Environment, Czechoslovakia"State of the Environment in Czechoslovakia, ″1991.
Such extreme levels of air pollution have had an impact upon human health and damaged forests. According to a 1988 estimate by the United Nations European Social and Economic Committee, as much as 70.5 percent of the forests in Czechoslovakia had been damaged. There are even some regions where forest soil acidification has reached pH2. 2 Forests have also died in the Mt. Krkonose National Park, at altitudes over 750-800 meters above sea level, and substitutional vegetation is spreading. The lowest altitude at which forests die from this pollution is said to be gradually descending.
Water pollution is also a major problem. In Czechoslovakia, water quality is classified into four categories. In 1940, about 87 percent of the entire Elbe was judged comparatively clean (quality category 2) but by 1980 this proportion had fallen to only 3 percent. This water pollution is attributed to industry effluent, run-off from agricultural chemicals and fertilizers, and incomplete sewage treatment.
Losses to the economy resulting from damage due to such envi-ronmental pollution in Czechoslovakia is estimated to reach 5 to 7 percent of the national income.
(3) Poland
Poland is also one of Eastern Europe's highly industrialized countries. Environmental pollution is particularly conspicuous in the southern region of Silesia.
In Poland, the annual volume of sulfur dioxide emissions is 4.2 million tons, and of nitrogen oxides (converted to nitrogen dioxide) is 1. 53 million tons. The main pollutant sources are power plants or heat generating facilities which account for 90 percent of the sulfur dioxide and 60 to 70 percent of the nitrogen oxides. The next major source is automobiles which account for 25 percent of the nitrogen oxide emis-sions. Large cities in Silesia exceed the national environmental stan-dards. Emissions that enter Poland from Germany and Czechoslovakia also constitute a major source of pollutants. According to Table 1-1-16, which details the flow of sulfur oxides into and out of Poland, "exports" exceed "imports," and "exports" to regions of the former Soviet Union are especially large. In addition, Poland's mountainous regions of Silesia sustain damage from pollutants that originate in Czechoslovakia and Germany.
Poland faces the Baltic Sea, and in recent years it has added to much pollution in that area. Poland's share of the pollution among the countries on the Baltic Sea is one of the largest (Table 1-1-17). All of the countries bordering the Baltic Sea cooperate to protect the Environ-ment of the Baltic Sea.
Poland's environment, including water pollution and damage to forests, is in very poor condition. The economic losses associated with this environmental pollution are estimated to reach 10 percent of the national income. Most of those losses are concentrated in the southern Silesia region. The province of Katowice, which is located in this area, only accounts for 2.1 percent of the area of Poland, but it has sustained 31 percent of these losses (Figure 1-1-36).
Table 1-1-16 Poland's SO2 Balance (1988 data 1000/yr.)
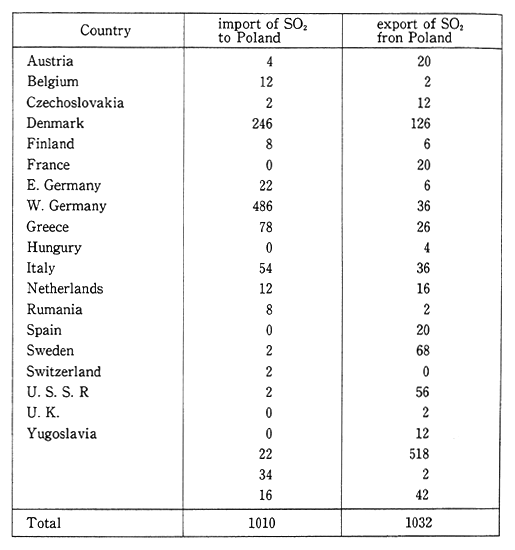
Source: "The State of the Environment in Poland-Damage and Remedy-1991" Ministry of Environmental Protection, Natural Resources and Forestry, Ptland
Table 1-1-17 Emission of nutrient Substances Discharged into the Sea by the Baltic State
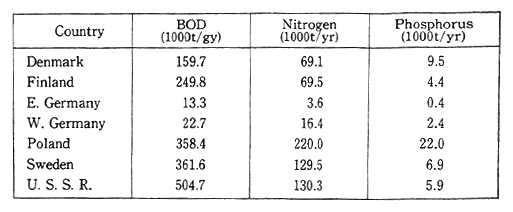
Source; "The State of the Environment in Poland-Damage and Remedy", 1991. Ministry of Environmental Protection, Natural Resources and Eprestry, Poland
Fig. 1-1-16 Economic Losses by Environmental Pollution in Poland
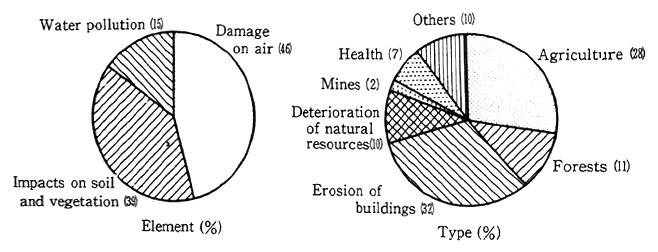
"State of the Environment in Poland-Damage and Remedy", 1991. Ministry of Environmental Protection, Natural Resources and Forestry, Poland.
1-1-10 Pollution resulting from the Persian Gulf Crisis
The crisis in the Persian Gulf began with the Iraq's invasion of Kuwait in August of 1990. From the start of military action by the Allied Forces to the liberation of Kuwait at the end of February 1991, high levels of pollution resulted which had never been seen before. This pollution was not limited to the Persian Gulf but extended to the entire world. During the crisis, vast quantities of crude oil were released into the Persian Gulf. This had an extremely serious impact upon the marine environment and upon the birds and other plants and animals whose habitat is in the gulf. The crude oil was released from oil terminals in the sea along the coast of Kuwait as well as from damaged oil tankers. For various reasons it is difficult to arrive at a precise estimate of the volume of oil that entered the gulf, but it is believed to be millions of barrels. Carried by ocean currents and seasonal winds, this oil drifted down the west coast of the Persian Gulf where it is reported to have had a major impact upon sea birds, turtles, dugongs, and mangrove forests. It is estimated that by May 1991, 20,000 birds had died. In November 1991, still as many as 16 percent of the sea birds captured in the vicinity of Al Jubayl were covered in oil.
In addition, the oil well fires that were part of Iraq's so-called scorched earth strategy, as retreating Iraqi soldiers damaged and set fire to more than 700 Kuwait oil wells, created a tremendous amount of air pollution. With the participation of companies from all over the world that specialized in putting out oil fires, the conflagration was extinguished sooner than was originally thought. Nevertheless, Japanese surveys revealed that during the period from the end of April to May 1991, the regions in the vicinity of burning oil wells experienced a daily average of 1mg/m3 of particulate matter, the major component of which was soot (Japanese environmental standards allow for 0.1mg/ m3 of particulate matter less than 10 um in diameter). As a result of the smoke from these fires entering the atmosphere, soot laden "black rain" was observed as far away as the Himalayan mountains, crop damage as a result of "black rain" was reported in Iran along the east coast of the Persian Gulf, and a reduction in sunlight intensity was even measured in Japan.
This pollution has a long term as well as a short term impact on the environment. The Persian Gulf only has a narrow opening to the sea, and this will aggravate the impact of the oil pollution upon the water and the sea bottom sustaining that ecosystem. Moreover, oil that continued to flow out of the wells after the fires were extinguished is said to remain on the land where it probably continues to do harm to the ecosystem on the land, and to the livestock industry as well.
1-2 State of the Natural Environment
Nature constantly supplies mankind with a wide range of resources. It is therefore vital for mankind to husband and protect this stock of resources for present and future welfare.
Japan is a long, island nation stretching from north to south and situated between the Pacific Ocean and the continent of Eurasia. There is abundant rainfall throughout all of the four seasons, and weather conditions vary from subarctic to subtropical. For a small, narrow country, the climatic diversity defies the imagination. The assorted topography and variety of geographical conditions ranges from steep mountain terrain, to numerous volcanoes, hilly regions, plains, swamps, a jagged coastline and corral reef islands. This topographical, geograph-ical and climactic variety provides a rich natural environment that supports a teeming abundance of plants and animals. It is here that the Japanese people created a characteristic culture and lifestyle in a diversity of forms, that is at one with and indivisible from nature.
However in the short span of one hundred plus years since the Meiji Restoration, Japan has been transformed into a country that is one of the world's economic superpowers. In the process, and as a result of accompanying economic and social activity, some of this natural wealth has been sacrificed or has been subject to major, inevitable change. In the following section we shall take a close look at precisely what has been lost, as well as what parts of nature have changed, or are presently in the process of change.
1-2-1 Natural Environment
(1) Land Utilization in Japan
According to estimation by the National Land Agency, in 1991 land utilization in Japan was classified as 25.26 million ha (66.9 percent of total land area) taken up by forests, 53.8 million ha (14.2 percent) taken up by agricultural land, and 1.59 million ha (4.2 percent) by residential land. The proportion of forested land is very high in compari-son with other industrialized countries. This is thought to be a function of the steep topography and large number of mountains, as well as the humid climate and abundant rainfall. In other industrialized countries, the highest proportion of land is devoted to agriculture (Figure 1-2-1).
Fig. 1-2-1 Land Use in OECD Countries
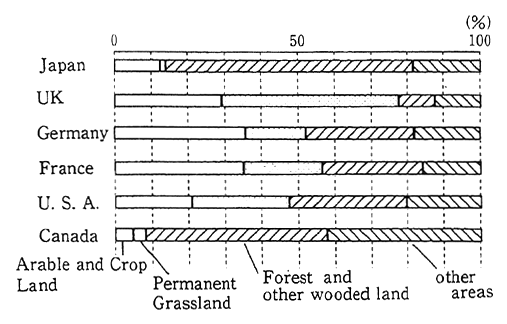
Source: OECD Environmental Data Compendium 1991
As a result of this high proportion of forested land, Japan's land use problems differ from those of other countries. In Europe or the United States, where vast tracts of agricultural land are dedicated to growing wheat and other grains, a major problem concerns the loss of soil. In the United States in the 1980s, it was estimated that each year, approximately 10.5 tons of soil were lost from each hectare of land. In Japan, the nearest problem to this is the loss of red earth in Okinawa. However strictly speaking, this problem is not so much one of losing soil, than it is of this red earth being washed into the sea and effecting the marine ecosystem.
Fig. 1-2-2 Total Area of Nature Parks
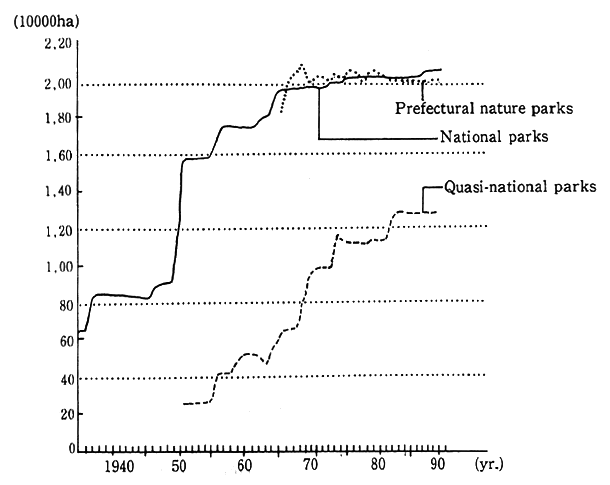
Source: Environment Agency
The land utilization function of natural parks can be thought of from the perspective of preserving the conspicuous natural scenic beauty and promoting proper utilization. Of Japan's natural parks, 28 are national parks, 55 are quasi-national parks, and 299 are prefectural parks. The total area taken up by these parks is 5.33 million ha (14.11 percent of the total land area). National parks were first established in 1936, and quasi-national parks in 1950. Since then, the area of these parks has been expanded each year (Figure 1-2-2).
Fig. 1-2-3 Number of Nature Parks' Users
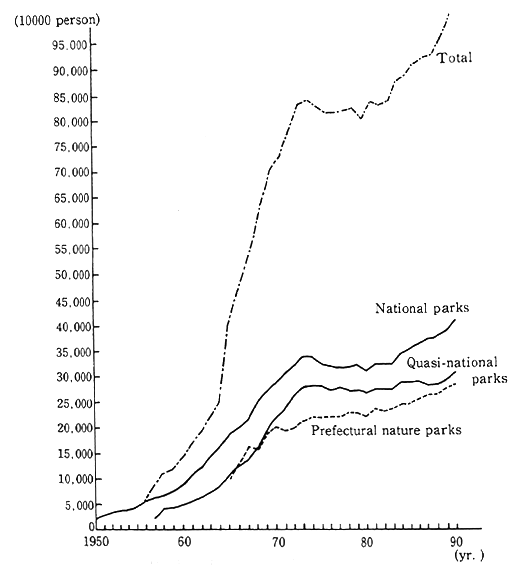
Note: The statistical data began to be compiled in 1957 for quasi-national parks and in 1965 for prefectural nature parks.
Particularly from the mid-1950s through the 1960s, there was a rapid increase in the number of people visiting these natural parks. Destruction of nature due to tourist development, and damage to vegeta-tion resulting from the concentration of large numbers of park visitors has become a problem affecting many park areas (Figure 1-2-3).
(2) Natural Environment
Japan's complex topography, copious rainfall throughout the year, vast expanses of forested land, and diversity of climactic condi-tions, has generated an abundant diversity of vegetation. This vegeta-tion is the foundation that supports a large number of different species of wildlife.
Japan is an island country that, in addition to Honshu and the other main islands (Japan proper), consists of a surprising number of small islands. The coastline is extremely long and offers sandy beaches, tidelands, and reefs. This coastline is the stage for human activity such as fishing and recreation, but it also provides a habitat for a large number of species of wildlife.
However, this natural environment has suffered great change as a result of economic and social activity.
Taking vegetation as an example, we can identify various regions such as natural areas of primary forests, those where vegetation has been influenced by human activity, and others such as residential areas where nature and vegetation have been radically transformed by man. Those areas that have retained the original environment are extremely limited. Today, the impact of human activity upon the natural environ-ment is growing more intense and is taking place on an ever-increasing scale. On the other hand, there are also conspicuous changes in vegeta-tion caused by a decline of earlier utilization by human such as harvest-ing wild plants or collecting firewood-
In order to survey the condition of the natural environment as well as to monitor the changes that are taking place, since 1973 the Environment Agency has conducted the National Survey on the Natural Environment (the Greenery Census) at roughly five year intervals. These surveys targeting land areas (flora, fauna, landscape, geology, natural phenomena) surface water areas (rivers, lakes and marshes) and coastal areas (shoreline, tidelands, reefs etc.)
The results of these surveys aid in understanding the state of natural environment in Japan.