

Quality of the Environment in Japan 1990
(2) Implementation of Measures
East Japan Railway Company, Tokaido Railway Company, Nishi-Nippon Railway Company, given a notification by the Minister of Transport under the General Plan of Measures for Shinkansen Railway Noise Abatement (approved by the Cabinet in March 1976), formulated operating procedures on measures to cope with noise, vibration and hazards by Shinkansen trains, and according to the procedures, carried out measures against noise sources, measures against vibration sources and measures for the prevention of hazards.
a. Measures Against Noise and Vibration Sources
For the Tokaido and Sanyo Shinkansen lines, comprehensive measures against noise sources are in force with a combination of various measures, such as the establishment of new types of noise-arresting walls in areas where population-congested area follows one after another, in addition to a strengthening of the maintenance and control of tracks and trains.
For the Tohoku and Joetsu Shinkansen lines, measures were taken in the construction phase, such as the installation of a reversed-L type of noise-arresting walls, and the installation of additional sound-absorbing boards, the deeper corrective scraping of rails and other measures are implemented in areas where dwellings are concentrated.
b. Measures for Prevention of Hazards
The construction of noise arresters for dwellings in areas with a noise level of more than 75 dB and for schools and hospitals in areas with a noise level of more than 70 dB have been subsidized and other measures have been implemented, and measures are taken for all dwellings for which requests have been made.
The construction of noise arresters for dwellings is subsidized and moves are compensated in areas with a vibration level of more than 70 dB, and measures are taken for all dwellings for which requests have been made.
(3) Research and Development on Technology for Prevention of Noise and Vibration
For a more efficient implementation of measures against noise sources and those for the prevention hazards, the Railway Technical Research Institute, a foundation, which took over the administration of tests and researches of the Japanese National Railways, plays the leading role in carrying on the research and development of technologies done by the Japanese National Railways till fiscal 1986.
In fiscal 1989, the configuration of each part of cars and the arresting of vibration were researched for further reductions in the noise produced by Shinkansen trains.
(4) Noise and Vibration by Conventional Trains
On the so-called conventional railways other than Shinkansen, problems are posed, such as complaints about noise and vibration. Particularly, with the opening of the Tsugaru Undersea Line in March 1988 and the Seto Suspension Bridge Line in April, problems are posed on noise and vibration, and a wide variety of measures is enforced.
The Environment Agency carries out surveys for studies on the guideline against the noise and vibration caused by conventional trains, and makes a point of coping with specific issues with liaison of related institutions.
V. Noise--Present State and Measures
1. Present State of Noise
Of all kinds of environmental pollution, noise is closely tied in with the daily life, and as the sources are diversified, the number of complaints about noise is the largest of all complaints.
A check of the number of complaints by type of source indicates that the number of complaints about factories and business establish-ments is the largest of all complaints, followed by noise from construc-tion work and noise from midnight business operations (Fig.5-5-1).
A check of trends in the number of complaints by kind of noise source reveals that there are signs of a gradual drop in the number of complaints about factories and business establishments but that of complaints about construction work is on the rise.
Fig. 5-5-1 Breakdown of Grievances about Noise
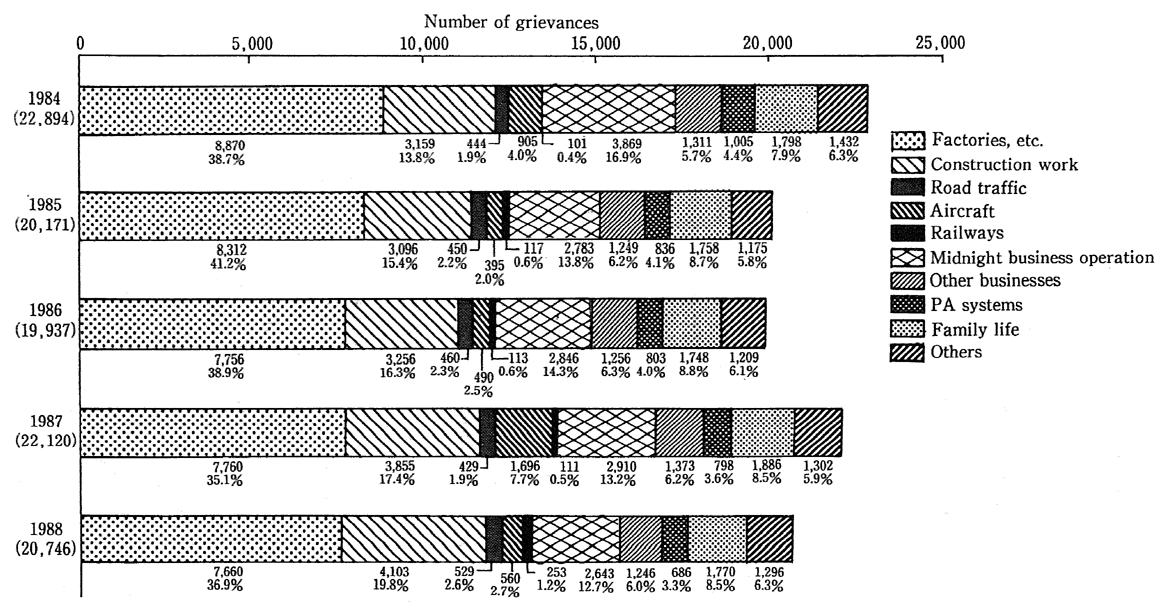
Remarks: 1. Surveyed by the Environment Agency (which has tabulated grievances filed with local governments).
2. In computing the number of grievances, grievances about one and the same noise source are considered as one grievance, even when a number of grievances have been filed about it.
2. Measures Against Noise
(1) Environmental Quality Standards for Noise
Under the provisions of Article 9 of the Basic Law for Environ-mental Pollution Control, the Environmental Quality Standards for Noise were determined on May 25, 1971. According to the standards, the basic values are classified into those for general areas and those for areas facing roads, determined depending on the type of area and the classification of hours.
The basic values in general areas range from less than 35 dB (A) at night for neighborhoods which particularly require tranquillity to less than 60 dB (A) in the daytime for neighborhoods offered for commerce and industry with a considerable number of dwellings, and they are set according to the type of area and the classification of hours. In areas facing roads, higher basic values than in general areas ranging from 5 to 10 dB (A) are set, depending on the number of automobile lanes and other factors.
It is stipulated that prefectural governors shall designate areas to which the types of areas are applied, and as of the end of fiscal 1988, the designation of areas is done for 574 cities, 806 towns, 96 villages and 23 special wards in 45 prefectures.
(2) Controls Under Noise Regulation Law
In the Noise Regulation Law, it is stipulated that areas where the living environment should be protected from noise shall be designated by prefectural governors (mayors for administrative ordinance-designated cities) to regulate the noise affecting a considerably wide area from the business performance of factories, business establish-ments and construction works located in the designated areas. It is also stipulated that the Director-General of the Environment Agency shall determine tolerable limits on the noise produced by automobiles and that prefectural governments may make requests for measures to cope with the noise caused by road traffic.
The designation of areas by prefectural governors (mayors for administrative ordinance-designated cities) was done for 651 cities, 1,207 towns, 182 villages and 23 special wards in 47 prefectures as of the end of fiscal 1988.
a. Noise of Factories and Business Establishments
The subjects for controls include factories and business establish-ments which has installed metal processing machinery and other facil-ities designated by administrative ordinances in designated areas (here-inafter referred to as "specified factories, etc."), and the number of specified factories in designated areas stood at 194,007 as of the end of fiscal 1988.
Specified factories in designated areas are obligated to observe the control standards, and prefectural governors (mayors for adminis-trative ordinance-designated cities) may be to recommend changes in the plans and furthermore order improvements in situations where the noise generated by specified factories do not satisfy the control stan-dards and is deemed likely to impair the peripheral living environment. In fiscal 1988, five recommendations for improvements were made and two orders for improvements were issued. In addition to the measures implemented under the Noise Regulation Law, administrative guidance was provided in 1,945 cases on the prevention of noise after surveys upon receipt of reports based on complaints.
In areas where noise pollution is actually caused and posed as an issue due to the land use which mixes residential and industrial areas, it has become important to take noise prevention measures, such as the installation of noise-arresting walls and measures for the move of factories and business establishments out of the affected areas. But many of the factories and business establishments whose noise is at issue medium and small in scale, finding it difficult to move out of the affected areas in terms of funds and other factors, so that loans are advanced by the Smaller Business Finance Corporation, and the con-struction of buildings by entrepreneurs in group or the development of sites to which factories are to be moved are subsidized by the Japan Environment Corporation.
b. Noise from Construction Work
The subjects for controls are construction projects, such as the hammering of piles into the ground, which are specified in an adminis-trative ordinance, and in fiscal 1988, there were 49,765 cases in which reports were filed on specified construction projects.
Prefectural governors may recommend or order improvements of methods to prevent noise when they consider it likely to extremely impair the living environment as the noise generated in conjunction with construction work does not meet specified standards. In fiscal 1988, neither recommendations nor orders were issued, but there were 943 cases in which administrative guidance was provided on the prevention of noise after surveys on receipt of reports based on complaints.
As regards noise from construction, notice was served on a partial amendment of the Standards Concerning Controls on Noise Generated from Specified Construction Work in November 1988, and the revised standards was put into force on April 1, 1989. With this revision, the standards on the sound volume and the working hours were reinforced. The development and dissemination of construction machin-ery and construction methods with less noise are under way, and with the revision, it is expected that there will be further progress in the development and dissemination.
(3) Neighborhood Noise
In recent years, complaints neighborhood noise, such as about noise from midnight business operations, noise from public-address systems and livelihood noise, accounted for about 40% of all complaints about noise, thus becoming an important task to cope with it,
It is stipulated in the Noise Regulation Law that in regard to controls on the noise at midnight which is caused by the operation of bars and restaurants and the noise caused by the blaring of public-address systems, local governments shall take necessary measures. Up to now, ordinances have been enacted by 31 prefectures on noise from midnight business operations and by 44 prefectures on noise from public-address systems.
As regards noise from public-address systems, the findings of studies done by the Study Group on Measures to Cope with Noise from Public-address Systems have been released, and notice has been served calling on local governments to take appropriate measures. Studies were conducted on the legitimate use of public-address systems.
For the promotion of measures against livelihood and other neighborhood noise, model projects to cope with noise have been perf or-med to encourage a voluntary approach by residents.
VI .Vibration--Present State and Measures
1. Present State of Vibration
Of all types of environmental pollution, vibration is closely affects our daily lives as well as noise. There were signs of a drop in the number of complaints from fiscal 1979 to fiscal 1982, but the number has leveled off in the last seven years, coming to 3,279 cases in fiscal 1988.
A check of the breakdown indicates that complaints about vibra-tion from construction work were the greatest of all complaints, and there have been signs of a rise in their number in recent years. Com-plaints about vibration from construction work were followed by those about vibration from factories and business establishments, in which there have been signs of a drop, but they still shared a high rate as causes of complaints (Fig. 5-6-1).
Fig. 5-6-1 Breakdown of Grievances about Noise
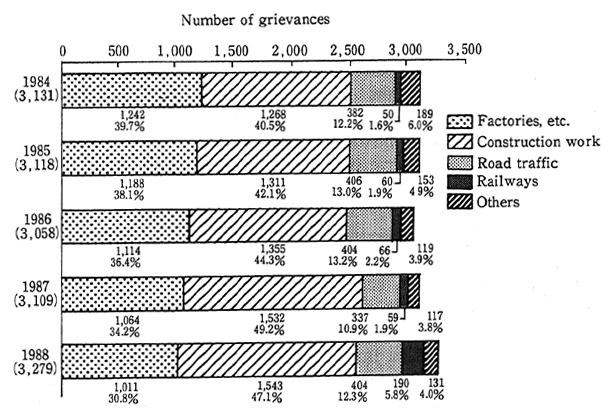
Remarks: 1. Surveyed by the Environment Agency (which has tabulated grievances filed with local governments).
2. In computing the number of grievances, grievances about one and the same noise source are considered as one grievance. Even when a number of grievances have been filed.
2. Countermeasures for Vibration
(1) Controls under Vibration Regulation Law
In the Vibration Regulation Law, it is stipulated that prefectural governors (mayors for administrative ordinance-designated cities) shall designate areas where they deem it necessary to protect the environ-ment from vibration, exercise necessary controls on vibration which is generated in a wide area from factories, business establishments and construction works in designated areas, and determine measures for requests on vibration by road traffic.
a. Vibration from Factory and Other Business Establishment
In designated areas, factories and business establishments of which metal processing machinery and other facilities specified in an administrative ordinance (hereinafter referred to as "specified fac-tories") are subject to controls, and the number of specified factories in designated areas was 109,489 as of the end of fiscal 1988.
Specified factories in designated areas are obligated to observe the control standards, and prefectural governors (mayors for adminis-trative ordinance-designated cities) may recommend changes or improvements in the plans and order improvements when they deem it likely to impair the peripheral living environment by vibration which does not satisfy the control standards. In fiscal 1988, there were 374 cases in which administrative guidance was provided on the prevention of vibration after investigations on receipt of reports based on com-plaints.
In areas where vibration causes environmental pollution with the land use which mixes residential and industrial areas, measures for the prevention of vibration, such as with the installation of vibration pre-vention facilities, and the move of factories and business establishments out of the affected areas have become an important means to cope with environmental pollution. But factories and business establishments for which vibration is at issue are medium and small in scale, making it difficult to work out measures in terms of funds and other factors, so that the advance of loans for the move of factories by the Smaller Business Finance Corporation and other institutions and the construc-tion of buildings by entrepreneurs in group and the development of sites to which factories are to be moved are done by the Japan Environment Corporation.
b. Vibration from Construction Work
The hammering of piles into the ground and other construction works specified in an administrative ordinance and done in designated areas are subject to controls, and there were 31,370 cases in which reports were filed on the execution of specified construction work in fiscal 1988.
Prefectural governors may be able to recommend or order improvements of methods on the prevention of vibration, when they deem it likely to extremely impair the living environment by vibration which generated in conjunction with specified construction projects, does not satisfy specified standards. In fiscal 1988, there were 526 cases in which administrative guidance was provided on the prevention of vibration after investigations on receipt of reports based on complaints.
As regards vibration from construction work, the development and dissemination of construction machinery and construction methods with less vibration are promoted (Table 5-6-2).
(2) Infrasound
Infrasound hardly audible by man is reported as jostling glass windows and doors and shoji (traditional Japanese paper sliding doors) and affecting human bodies. The number of complaints about such vibration across the country exceeds 20 every year (Table 5-6-2).
Table 5-6-2 Breakdown of Grievances about Low-Frequency Vibration.
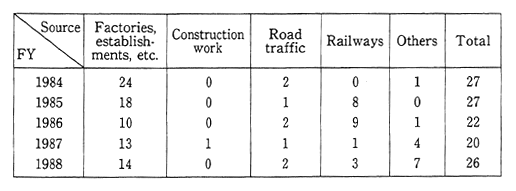
Remarks: 1. Surveyed by the Environment Agency (which has tabulated grievances filed with local governments).
2. In computing the number of grievances, grievances about one and the same vibration source are considered as one, even when a number of grievances have been filed.
The findings of surveys thus far made produce no data verifying the production of effects on human bodies by infrasound existent in the general environment.
VII. Offensive Odors--Present State and Measures
1. Present State of Offensive Odors
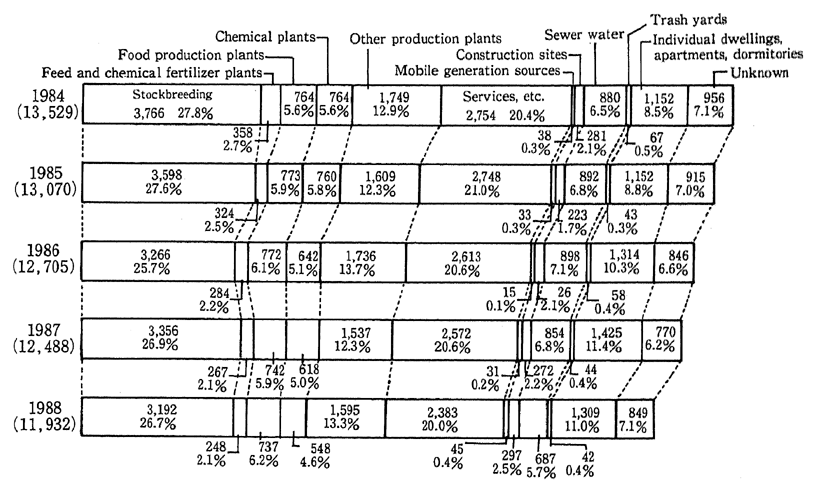
In recent years, the number of complaints about offensive odor has leveled or there have been signs of a slight drop with 11,932 cases in fiscal 1988. By line of business, the diary industry shared the highest rate with about 27%, followed by the service industry and others with about 20% (Fig. 5-7-1).
2. Measures for Prevention of Offensive Odors
In the Offensive Odor Control Law, it is stipulated that prefec-tural governors (mayors for administrative ordinance-designated cities) shall designate areas where controls will be imposed on the discharge of offensive odors generated in conjunction with the business performance of factories and other business establishments and formulate control standards. The designation of areas was done for a total of 1,411 municipalities including 545 cities, 755 towns, 88 villages and 23 special wards in 47 prefectures and 10 administrative ordinance-designated cities as of the end of fiscal 1988 (about 43% of all municipalities).
Fig. 5-7-1 Breakdown of Grievances about Offensive Odor
It is stipulated that prefectural governors (with their authority delegated to municipal mayors) may recommend or order improve-ments, demanding the persons who have installed facilities to take measures for the prevention of offensive odors when they deem it likely to impair the living environment of residents as the discharge of matter with offensive odors, generated in conjunction with the business perfor-mance of business establishments in designated areas, does not satisfy the control standards. In fiscal 1988, there were 6 cases in which recommendations for improvements were made, but no orders for improvements were issued.
In addition to the measured based on the law, there were 5,254 cases in which administrative guidance was provided to business estab-lishments in designated areas where offensive odors was generated.
(2) Strengthening the Offensive Odor Control Law
As there is considerable number of complaints every year about offensive odors which seem to have been caused by substances other than ammonia and 7 other chemicals which are designated as matter with offensive odors and on which discharge controls are imposed, surveys and researches are under way, including the retrieval of those substances and a review of the existing regulations and criteria.
In fiscal 1989, 4 substances with offensive odors--propionic acid, buthric acid, valeric acid and isovaleric acid--which are main causes of offensive odors from stock farms, dead-animal processing plants and starch production plants were additionally designated as matter with offensive odors on the basis of the findings of past surveys.
Chapter6. Water Pollution--Present State And Measures
I. Water Pollution--Present State and Cause of Pollution
1. Present State
The findings of a survey on the water quality of public water areas across the country in fiscal 1988 reveal that on cadmium and other substances hazardous to human health, the ratio of samples exceeding environmental quality standards to all of the samples included in the survey was extremely low with O.02%(Table 6-1-1).
As regards items on the conservation of the living environment from BOD, COD and other indices, a check of water areas where environmental quality standards for BOD (or COD), which is a represen-tative parameter of environmental quality standards, indicates that the water areas where the standards were attained accounted for 73.7% (70. 1% in fiscal 1987) of 3,083 water areas (2,378 rivers, 120 lakes and reservoirs and 585 sea areas) to which categories of environmental quality standards had been applied by fiscal 1987, suggesting that the remaining 26.3% had yet to attain the standards.
By type of water area, the ratio stood at 73.0% for rivers (68.3% in fiscal 1987), 43.3% for lakes and reservoirs (43.1%) and 82.7% for sea areas (82.6%), and the attainment rates were low particularly for lakes and reservoirs, inland bays, inland seas and other closed water areas and small rivers in urban areas (Table 6-1-2, Fig. 6-1-3, Fig. 6-1-4).
When it comes to other forms of water pollution, the pollution of groundwater with trichloroethylene and other chemicals; the broad-range pollution of estuaries and inland bays with organic tin compounds ; the contamination of public waters due to the outflow of hazardous substances by accidents; the protracted turbidity of some waters due to the construction of dams; the acidification of rivers, lakes and reser-voirs due to natural causative factors in volcanic areas; and the effects of thermal effluents from large-scale power generation plants on the environment,
Table 6-1-1 Rates of Hazardous Substances Exceeding Environmental Quality Standards
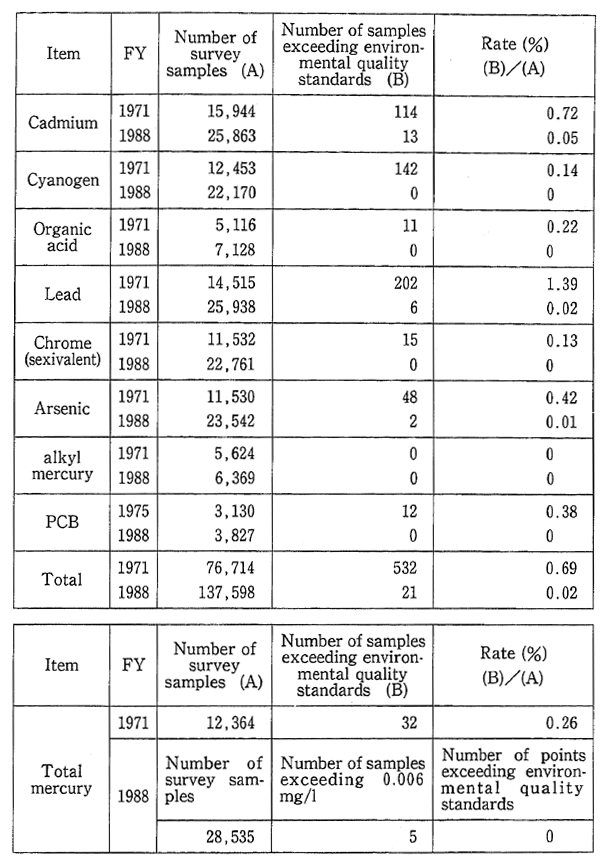
Remarks: 1. Surveyed by the Environment Agency.
2. The total for FY1971 does not include PCB.
Table 6-1-2 Achievement of Environmental Quality Standards
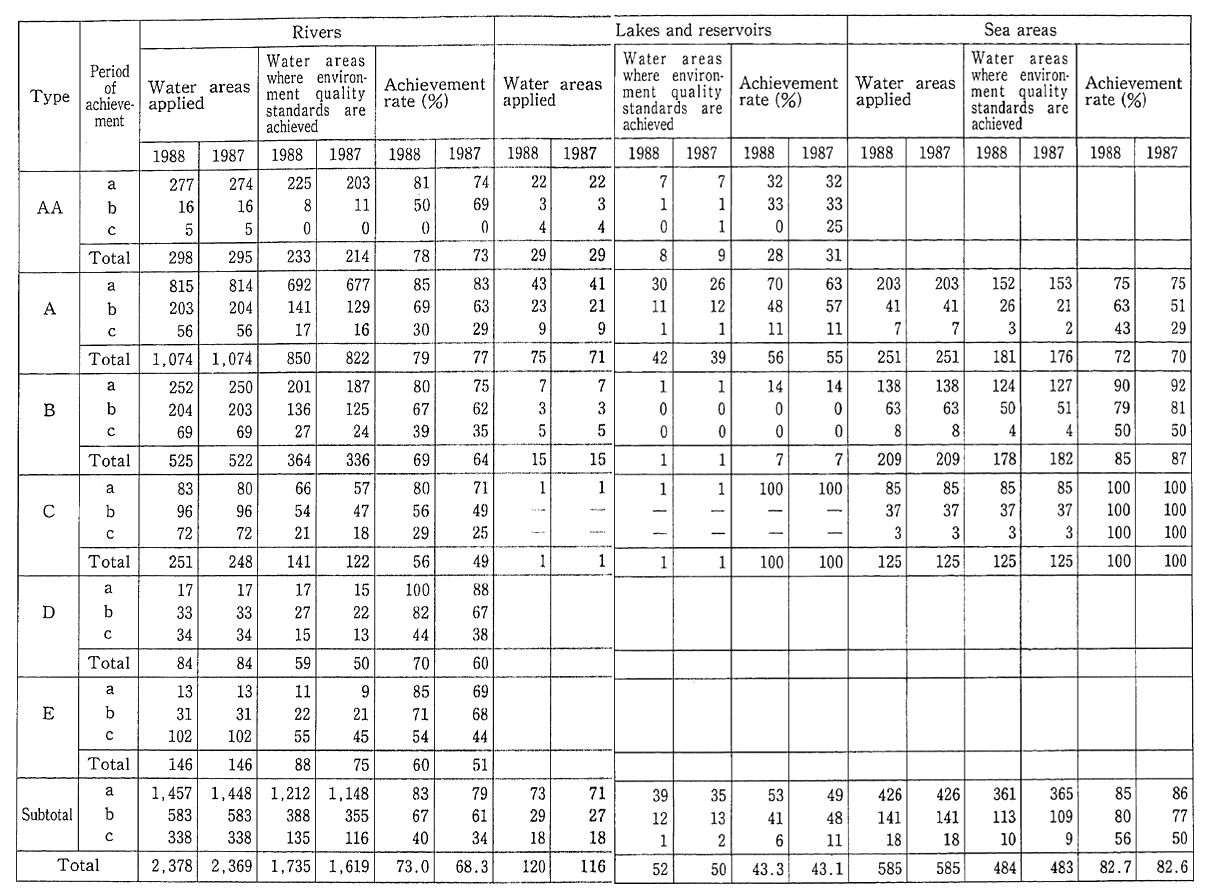
Remarks: Of the water areas to which types were applied, those which were monitored are tabulated in this table for the FY 1988 survey till FY 1987 and the FY 1987 survey till FY 1986.
Fig.6-1-3 Pollution of Major Rivers (FY 1988)
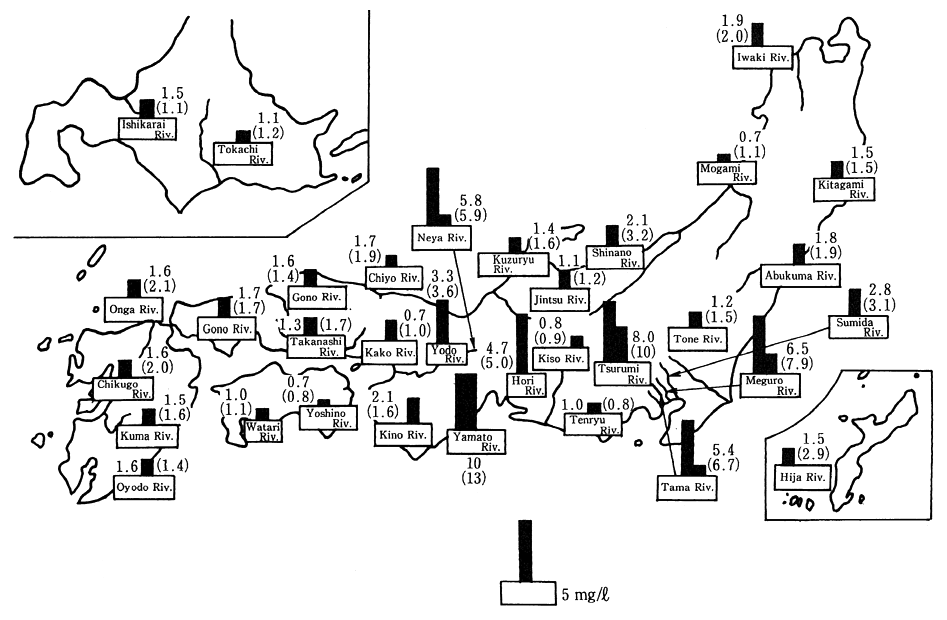
Remarks: 1. Surveyed by the Environment Agency.
2. The figures are the annual average BOD values. (Unit mg/l)
3. The figures in parentheses are those monitored in FY 1987.
Fig.6-1-4 Pollution of Major Lakes, Reservoirs and Inner Bays (FY 1988)
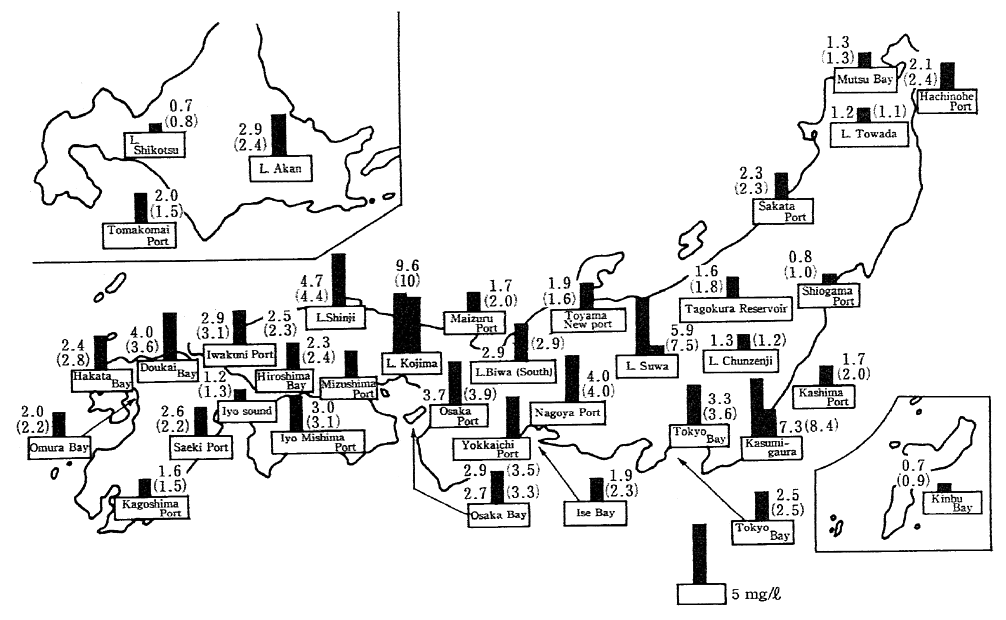
Remarks: 1. Surveyed by the Environment Agency.
2. The figures are the annual average BOD figures (Unit:mg/l).
3. The figures in parentheses are those monitored in FY 1987.
2. Causes
For the background of pollution we have just seen, the strengthen-ing of controls is of effect on waste water from factories and industries, whereas in regard to domestic waste water, it is generally conceivable that there is a delay in the implementation of measures to cope with domestic waste water as the development of sewer systems is still inadequate, etc.
Particularly in respect of the pollution of inner bays, inland seas, lakes and reservoirs, the physical characteristic of semi-closed water areas where water stays immovable and pollutants tend to be readily accumulated and the socioeconomic factor that population and industry are concentrated in the littoral areas of inner bays and inland seas constitute important causes of pollution.
For urban and other rivers in the basins of which population and industry are concentrated and for lakes and reservoirs, like Teganuma and Inbanuma, in the basins of which urbanization is in progress, the development of sewer systems and other facilities does not catch up with increases in population, making domestic waste water have a large share in the total pollutant load.
As measures to protect the water quality of those water areas, it is necessary to step up the development of sewer systems and control waste water in a thoroughgoing manner. For areas where sewer systems have yet to be developed, there is the need to work for the promotion of measures to cope with domestic waste water, depending on the actual situation of the local areas, with consideration given to sewer system development and other programs, and to maintain and control septic tanks in a thoroughgoing manner.
Particularly in lakes and reservoirs, which are semi-closed water areas and vulnerable to pollution, it is necessary to carry out measures to cope with domestic and industrial waste water and work for a reduction of the pollution load by effluents from livestock and fishing operations.
As we have just seen, the urgency of measures to cope with domestic waste water has risen in recent years, centering on pollution by organic matter in general terms. In addition, there is the need to come to study the actual situation of pollution by so-called non-point sources of pollution, which is typically caused by outflows from built-up urban areas, sites for land development and farmland, which are expan-sive in terms of space, and pollution which is caused by matter deposited and accumulated on the sediment as a result of water pollution over the years, so that appropriate measures may be taken.
II. Damage Caused by Water Pollution
1. Pollution of Tap Water Supply
Water flowing down the surface of rivers and the like accounts for about 70% of sources of tap water, and the impacts sustained by the pollution of public water areas are indeed significant. Underground water, which accounted for about 30% of sources of tap water, used to be considered a quality water source, but its pollution with trichloroeth-ylene and other chemicals has come to the fore. In fiscal 1988, 73 tap water systems were affected by the pollution of their water sources.
In recent years, algae have grown thick by the eutrophication of reservoirs and other waters, thereby giving rise to offensive odor, etc. In fiscal 1988, 89 tap water and other systems (with an affected population of about 13.6 million) were affected by offensive odor.
The management of tap water systems is coping with the pollu-tion of tap water sources by adopting facilities with a high capacity of water purification, but the pollution of water sources has turned out to be a big burden on the management of tap water systems in terms of the assurance of safety and other factors and a cause to a rise in the water purification and processing cost.
Tap water must be something which may be used, both safely and agreeably. Desirably, the tap water sources must be clean as possible, and it has become all the more important task to conserve their quality.
2. Pollution of Industrial Water
Of all kinds of fresh water supplied as industrial water, riparian water (about half of which comes from systems for industrial water), such as surface-running water and subsoil water, accounts for 69%. As it is used for raw materials, the processing of products, purification and various other purposes, there are cases in which it is affected by the pollution of riparian water.
In the industrial-water business, the water quality is generally processed with the sedimentation of medicines, but there are cases in which the generation of sludge by riparian pollutants is at issue.
3. Damage on Agriculture
In conjunction with the evolution of urbanization and other fac-tors in recent years, the straying of urban and other foul water into agricultural water has posed issues which cannot be unchallenged in terms of agricultural production, the rural living environment and other factors.
A check of the present situation of the damage caused on agricul-ture by the pollution of agricultural water reveals that there are about 1,070 affected sections (each section with an area of more than 5 hectares) with a total affected area of about 89,000 hectares. The damage caused by urban foul water (including livelihood waste water in the countryside) is the greatest of all types of damage, followed by the damage caused by waste water from industrial plants (Table 6-2-1).
A comparison of the findings of a survey in fiscal 1985 with those in fiscal 1980 indicates that the number of affected sections increased by 11% and the total area of farmland affected decreased by 11%. On the other hand, damage was caused on yet another area of about 26,000 hectares, 90 % of which was caused by urban foul water.
4. Damage on Fisheries
The types of damage on fisheries by water pollution include (1) the environmental deterioration of fishing grounds and damage on fishing tackle in conjunction with the sedimentation of flotage on the water surface and throwaways; (2) the extinction of aquatic organisms or their incapability of growing up due to oil pollution and the genera-tion of red tides; (3) the unsalability and plummeted prices of hauled fish due to the accumulation, sticking, etc. of heavy metals, PCB and other hazardous chemicals; and (4) the staining, corrosion, etc. of fishing vessels and fishing tackle by oil pollution. In recent years, besides, the impacts produced on the environment of fishing grounds by topographi-cal changes in the sea bottom by costal reclamation, dredging, etc.; by foul water in conjunction with the construction of dams and other facilities; and by the intake and drainage of water in conjunction with the construction of power generation facilities, and the damage caused on fish and shellfish by pesticides have been posed as issues.
Table 6-2-1 Number and Area of Districts With Agricultural Water Affected by Source of Pollution
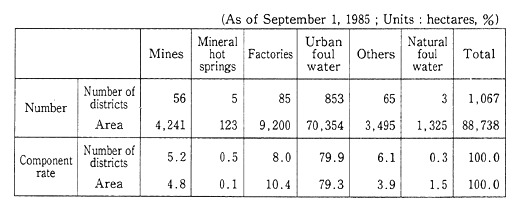
Remarks: Surveyed by the Ministry of Agriculture, Forestry and Fisheries
According to reports from prefectures, there were 294 cases (313 in fiscal 1987) in which damage was abruptly caused on fisheries by water pollution in fiscal 1988, valued at ¥988 million (¥3,013 million in fiscal 1987), indicating that it was less significant than in fiscal 1987 in terms of the number of cases and the amount. Of those cases, there were 66 cases in which damage was caused on fisheries by the oil pollution of the sea surface, valued at ¥316 million (¥116 million in 59 cases in fiscal 1987). There were 40 cases in which damage was caused on fisheries by red tides, valued at ¥75 million (¥2,597 million in 47 cases in fiscal 1987).
In respect of the pollution of fish and shellfish by mercury, PCB and other chemicals, self-controls on fish hauls and guidance on the dietary mode were continued for nine waters polluted by mercury, one water polluted by PCB and seven waters polluted by pesticides of the dry system (as of the end of December 1989).
5. Other Damage
According to a survey conducted on the water quality of sea bathing resorts and that of river bathing resorts by the Environment Agency (in fiscal 1989), 4 of the 409 sea bathing resorts covered in the survey were found required to take measures about colon bacilli.
III. Prevention of Water Pollution
1. Establishment of Environmental Quality Standards
The environmental quality standards on water pollution repre-sent those whose attainment and retention are desirable on the water quality of public waters areas a target of administration on the conser-vation of the water quality. They consist of two categories--one on the protection of human health and the other on the conservation of the living environment.
Items on health in the former category are determined across all public water areas. When it comes to items on the living environment in the latter category, standard values are determined with types of waters classified according to the purpose of use set for rivers, lakes and reservoirs, and sea areas, and as to which type of water each public water belongs is determined, the environmental quality standards are indicated in concrete form for it.
Environmental quality standards on the protection of human health are determined for 9 items, including cadmium, cyanide, organic phosphorus, lead, chrominum (VI), arsenic, total mercury, alkyl mercury and PCBs. Most of them are determined with consideration given to the water quality standards of tap water, and the standards on mercury and PCB are determined by taking account of the cause of damage, their concentration and accumulation in fish and shellfish. Environmental targets on the water quality were set in April 1989 for trichloroethylene and tetrachloroethyelene.
In regard to items on the living environment, standards are determined for BOD, COD and DO, among others. In addition, environ-mental quality standards for total nitrogen and total phosphorus are determined for lakes and reservoirs to prevent entrophication.
As regards the removal of sediment containing toxic substances, provisional removal standards are separately determined for sediments containing mercury and sediments containing PCBs.
2. Strengthening of Controls on Effluence.
(1) Establishment of More Stringent Effluence Standard
In order to conserve the water quality of public waters, nation-wide uniform standards are set on the water which is discharged from specified business establishments into public waters under the Water Pollution Control Law, but it is stipulated that in waters where environ-mental quality standards are difficult to attain and maintain under those uniform standards, prefectural governors may be able to formulate more stringent effluence standards. Those additional standards havebeen set in all prefectures since fiscal 1975.
(2) Expansion of Control Subjects
The subjects to which the Water Pollution Control Law was applicable for some time after its enactment in 1971 included about 500 of about 1,100 lines of business specified according to the subclassifica-tion of the Japan Standard Industry Classification, but some lines of business were added later with the law gradually amended. In October 1988, joint cookeries, lunch caterers' shops and drinking and eating establishments, etc., were added, and as of the end of fiscal 1989, about 600 lines of business were subject to effluence controls.
In respect of tricholoroethylene and teratochloroethylene, which were newly designated as hazardous substances and on which effluence standards were determined, effluence controls were begun on October l, 1989,
(3) Survey on Items Not Under Control
As regards 1, 1, 1-trichloroethane and other chemicals, a survey on effluence from factories and business establishments and a survey on the water quality of public waters were conducted. Concerning warm effluent, a survey on heat pollution and other compound impacts was performed on the basis of an interim report on the warm effluent prepared by the Warm Effluent Team, Water Quality Group, Central Council for Environmental Pollution Control, in December 1975.
(4) Measures Against Water Pollution Accidents
With a partial revision of the Water Pollution Control Law in June 1989, it was decided for entrepreneurs to take emergency measures in the occurrence of accidents by water pollution to report the prefec-tural governors on the measures they had taken.
3. Miscellaneous Household Effluent
The water pollution caused by organic matter and other chemi-cals, which are associated with man's living environment has been little improved in recent years, and damage, such as the offensive odor of tap water, remains intact.
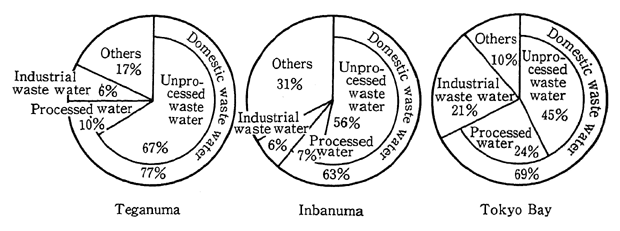
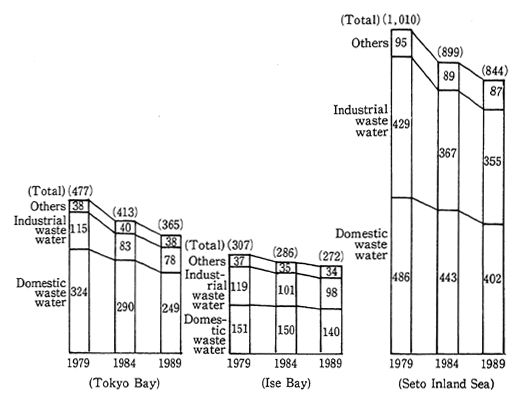
Fig. 6-3-1 Pollution Loads for Teganuma, Inbanuma and Tokyo Bay by Source
Remarks: Surveyed by the Environment Agency.
A check of causative factors for water pollution reveals that the rate of pollution load by domestic effluent is high, 77% for Teganuma, 63% for Inbanuma and 69% for Tokyo Bay, and the ratios are high particularly for extremely polluted urban rivers in the National Capital Region (Fig. 6-3-1).
Of all loans on livelihood, untreated raw sewage is prohibited from being discharged into public waters, but so-called miscellaneous household effluent, which is discharged in conjunction with cooking, washing and bathing, is often released without treatment, having become an issue which cannot be left unchallenged for the conservation of the water quality. Given this situation, it has become an urgent task to grapple with the pollution of public waters by miscellaneous house-hold effluent, and attempts have been made to strengthen measures to cope with miscellaneous household effluent to control the load of pollution by households.
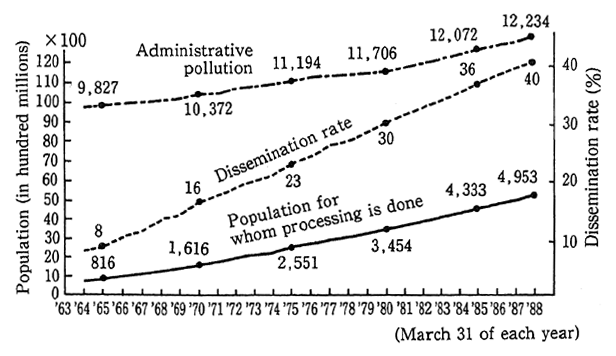
One of the mainstay measures to cope with miscellaneous house-hold effluent is to restrain the effluence of untreated waste water, such as with the development of facilities to dispose of miscellaneous house-hold waste water, including sewer systems and other joint treatment facilities and treatment-purification tanks installed in households. The population for whom sewage is disposed for has increased at an annual rate of about two million in recent years, but with the propagation rate standing at about 40% of the national population at present, it might be said that miscellaneous waste water in the national life is discharged untreated, even if other facilities for the treatment of miscellaneous waste water are additionally included (Fig. 6-1-2).
Fig. 6-3-2 Trends in Dissemination Rate of Sewer Systems and Pollution for Whom Processing is Done
Remarks: From "Japan's Sewer Systems."
Given this situation, efforts are being made to further develop and disseminate those facilities. The other thing is to step up the dissemination and enhancement of measures which can be readily be taken in the daily life, such as the use in the kitchen of filter paper and the group collection of discarded edible oil in the community.
For this, the Environment Agency began in 1981 to formulate a guideline on the way dissemination and enhancement should be stepped by local governments. It has also performed model projects in 5 annually selected areas from 1984. Practical activities by residents are evolved in a wide variety of forms though the entity and the area covered are different. There are cases in which conspicuous effects are produced, such with the establishment of a council led primarily by resident leaders in each community.
As measures to cope with miscellaneous household effluent, nonetheless, sewer systems are being developed. Depending on the situation of communities, various measures as well as sewer systems are in force, such as measures to subsidize the development of community plants (community raw sewage treatment facilities) and measures to cope with waste water in farming hamlets and the installation of treatment-purification tanks designed for households. As those mea-sures have characteristics of their own, depending on the way the projects are stepped up, the cost required for construction and other measures, the managerial entity and the like, it is necessary to work for a systematic development of those facilities in a manner compatible with the local situation. The conditions also are such that the people's enhancement is further required on the necessity of working for as much restraint on miscellaneous household effluent as possible.
Given those circumstances, the Environment Agency embarked upon an inter-prefectural project on measures to cope with miscellane-ous household effluent in lake and reservoir basins and areas under the areawide total pollutant control where it was an urgent task to imple-ment measures to cope with miscellaneous household effluent and to hold a forum on the water environment and other events in fiscal 1988. The agency also work for the promotion of measures based on the Guideline on Measures to Cope With Miscellaneous Household Effluent prepared in 1988 for local governments to comprehensively step up measures to cope with miscellaneous household effluent.
In December 1989, furthermore, the Central Council for Environ-mental Pollution Control was inquired about the way institutions should be on measures to cope with miscellaneous household effluent. The council came out with a recommendation in March 1990. As it is impor-tant to install direct-purification facilities for smaller urban rivers the pollution of which is accelerated by miscellaneous household effluent for improvements in the water quality and work for an enhancement of the consciousness of residents, measures are being made by some local governments.
In addition, the Ministry of Health and Welfare and the Ministry of Construction designates September 10 every year as the Sewer System Promotion Day and the Environment Agency, the Ministry of Health and Welfare and the Ministry of Construction designate the Purification Tank Day as October 1 every year in attempts to work for the conservation of the living environment, etc. and contribute to the conservation of the water quality of public waters.
4. Sewer Systems
The sewer system is a centerpiece facility which is indispensable for working for the sound development of cities and the enhancement of public hygiene, the assurance of a favorable living environment and the conservation of the water quality of public waters.
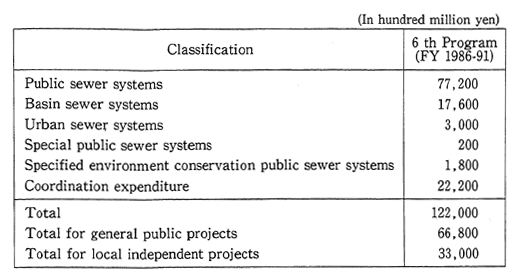
The development of sewer systems is promoted under the Five-Year Sewer System Development Program. Now in force, the Sixth Five-year Sewer System Development Program, extending from fiscal 1986 to fiscal 1990, is designed to promote the development of sewer systems with priority given to such projects as those for the implementa-tion of the Environmental Pollution Prevention Program, the Areawide Total Pollution Load Reduction Program for closed waters and the Lake and Marsh Water Quality Conservation Program; those for the attainment of environmental quality standards on the water quality; those for enhancement and promotion in local cities; those for the prevention of floods in built-up urban areas; those for the conservation of the natural environment including lakes and and reservoirs; those for improvements in the living environment of rural areas and the encour-agement of the effective utilization of sewage treatment water and sewer sludge, the total project cost is ¥12.2 trillion. A breakdown of the projects in the program is given in Table 6-3-3.
Table 6-3-3 Project Expenditures under 6 th 5-year Sewer System Development Program by Project
Remarks: Based on data from the Ministry of Construction.
In fiscal 1989, the fourth year of the Sixth Five-Year Sewer System Development Program, the following measures were implement-ed to step up the development of sewer systems.
(1) Sewer System Projects
With a total project outlay of ¥2,301.2 billion (initial) in fiscal 1989, attempts were made to step up the development of public sewer system projects at 1,030 places, basin sewer system projects at 96 places, urban sewer system projects at 587 places, specified public sewer system projects at three places and public sewer system projects for the conser-vation of the specified environment at 206 places (including simplified public sewer systems at 20 places). As a result, the population for whom sewage is disposed of increases at an annual rate of more than two million, and the dissemination rate is expected to exceed about 42% by the end of fiscal 1989 in terms of the population for whom the disposal of sewage is done.
With a view to making closer ties between residents and clean water with an eye cast on the conservation of the water quality of public waters with the development of sewer systems, the "Come Back Atopia" Concept was promoted in 31 cities, whereas in areas where sewer systems had yet to be developed, model projects on measures to cope with miscellaneous water in urban sewer channels were conducted at 6 places (including 2 new places). Emergency model projects on measures to cope with miscellaneous effluent in lakes and reservoirs were continued.
In order to maintain urban functions in the wintertime and restore streams in cities in response to urban dwellers'need for peace of mind and charm, an amenity sewer system project taking advantage of sewage treatment water was conducted at 16 places (including 3 new places); a project for the circulation and utilization of sewer treatment water, in which sewer treatment water was used as for flush toilets, etc., in urban areas where there are tight water supply and demand was conducted at 6 places (including 1 new place); a model project for green scenery for sewer systems, known as the Water Square Plan, in which attempts were made to make facilities for sewer systems more hydro-phile with the positive utilization of sludge products in projects for the construction of sewer systems to encourage the utilization of sewage sludge as construction materials was conducted at 23 places (including 13 new places); and a model project for the utilization of sewage sludge resources, in which sludge products were positively used in projects for the construction of sewer systems, were conducted in Aichi, Mie and Gifu prefectures.
In fiscal 1989, furthermore, a model project for sewer systems in future cities was started in Tokyo. This project was designed to posi-tively draw values-added, such as space, treatment water and sludge at the facilities of sewer systems and step up strategic city building primarily with sewer systems which was equipped with functions to offer diversified urban services.
(2) Basin-Specific Comprehensive Sewer System Development Program
For formulation of a basin-specific sewer system development program, which would constitute the basic plan for the development of sewer systems essential to the attainment and retention of environmen-tal quality standards for public waters, a survey was conducted at 179 places by fiscal 1988, and in fiscal 1989, Monobe, Kaso and 9 other rivers were surveyed.
A basin-specific sewer system development program had been prepared for 69 places by fiscal 1988.
5. Surveillance and Monitoring System
(1) Monitoring of Water Quality of Public Waters
In accordance with the Water Pollution Control Law, the Envi-ronment Agency subsidized also in fiscal 1989 the costs for preparation of monitoring plans and for surveys on the water quality of public waters in the category of the expenditure necessary for the constant monitoring conducted by prefectural governors and the mayors of administrative ordinance-designated cities on the water quality of public waters. The waters which may be covered by the water quality survey are specified as those for which the monitoring of the water quality is highly necessary, such as waters for which types of areas are specified for environmental quality standards.
Acting as custodian of rivers, the Ministry of Construction came to grips with the water pollution of the main water areas of Class 1 rivers across the country, consisting primarily of the places based on the monitoring plans prepared by prefectural governors, and monitored the water quality.
To facilitate these continuous surveys, automatic water quality monitoring systems have to be installed at key places in public water areas. The Environment Agency has subsidized prefectures and designated cities for the installation of automatic water quality monitor-ing systems. These systems had been installed in 160 places as of the end of fiscal 1988. Meanwhile, the Ministry of Construction carried out similar projects, from the river administrator's standpoint, in major first-class rivers. By 1988, automatic water quality monitoring systems had been installed in 127 places along 65 water systems and telemeters had been equipped in 106 places to establish a centralized monitoring system. Research activities are needed to develop a new automatic system capable of determining various parameters of eutrophication as well as a simpler system which is easier to maintain. The Environment Agency has conducted a research project to develop an automatic system for analyzing total nitrogen and total phosphorus, while the Ministry of Construction installed measuring equipment with improved capability and maintainability.
In order to strengthen the system of surveillance in prefectures and administrative ordinance-designated cities, the Environment Agency has subsidized the development of water analyzers by local environment pollution research institutes. Moreover, the Environment Agency and the Ministry of Construction have conducted a water quality survey with aquatic organisms with the involvement of as many as 22,300 and 8,900 (in fiscal 1989) general citizens, respectively, under the guidance of prefectural environment bureaus or departments and the riparian offices of the Ministry of Construction's regional bureaus.
(2) Surveillance on Effluent
Under the Water Pollution Control Law, prefectural governors and the mayors of administrative ordinance-designated cities call for reports from factories and business establishments and conduct on-the-spot inspections, wherever necessary, to check the observance of ef-fluence criteria by factories and business establishments. On the basis of such surveillance, prefectural governors and the mayors of administra-tive ordinance-designated cities take necessary administrative mea-sures, such as orders for improvements, to factories and business estab-lishments. The Environment Agency subsidizes the costs required for this purpose by prefectural governors and the mayors of administrative ordinance-designated cities.
(3) Monitoring of Effluent Water
Under the Water Pollution Control Law, prefectural governors and mayors of the designated cities conduct spot inspections of order facilities and other business establishments to present necessary reports in order to survey the state of compliance with effluent standards by industries. Based on these surveys, the prefectural governors and mayors have been conducting necessary administrative actions such as orders for improvements and so on. The Environment Agency, on the other hand, has subsidized part of the expenditure that the prefectural governors and mayors need to carry out these actions.
Under the Water Pollution Control Law, it is obligated for the persons, who discharge from business establishments in the designated areas to which the areawide total pollutant load standards are applied, to monitor and record the pollutant load. The Environment Agency carried out the dissemination and guidance of use of monitoring technol-ogy for entrepreneurs in the designated areas.
The Environment Agency also granted subsidies to local public bodies concerned which had promoted water quality monitoring by a telemeter system.
6. Measures for Purification
(1) Purification of Rivers
Projects for the induction of water for purification (the Shin-Arata, Furukawa and other rivers), in which water would be drawn from big rivers for the purification of polluted rivers the water flow of which was primarily insufficient; projects, in which extremely polluted riparian water would be directly purified in the gravel contact purifica-tion method and other systems (the Tama and other rivers) and sludge dredging projects (for Kasumigaura and the Sumida and other waters), in which sediments that contain much organic matter accumulated on the riverbed would be dredged to reduce the sources of pollution, such as offensive odor, were conducted as riparian development development projects in 75 sections (19 under the direct supervision and 56 subsidized) at a total project cost of ¥8,540 million (¥4,548 million under the direct supervision and ¥3,992 million subsidized).
In order to restore clean water in urban rivers the water flow of which is little in normal circumstances, the Comprehensive Model Project for the Restoration of Clean Water in Cities, in which the water volume would be assured and the space of rivers developed, such as with the induction of water from other rivers and the utilization of sewage treatment water, was conducted, and the Project for the Development of Water Channels for the Conservation of Running Water, in which attempts would be made to conserve running water with the develop-ment of low water channels in rivers, was also performed.
(2) Improvements in Riparian Flow Pattern
As rivers in Japan are such that the flow patterns extremely fluctuates throughout the year and that an enormous amount of water goes down at one time in the case of a flood, flood control measures are required. On the other hand, measures for water utilization and the conservation of the water quality are needed in a period of water shortage. For this reason, multipurpose dams are constructed to main-tain and prompt the normal functions of running water, and at the same time water is induced for purification purposes under riparian projects for the adjustment of the flow pattern.
As of the end of fiscal 1988, 299 dam construction projects had been completed under the jurisdiction of the Ministry of Construction, and in fiscal 1989, attempts were made to positively improve the flow pattern, promote the rich water environment, stabilize the water intake and conserve the riparian water quality by carrying out a total of 306 projects including 14 newly added projects, such as a dam project for the water environment which was designed to work for the assurance of water for purification purposes and other environmental water.
Moreover, in order to preserve the functions of existing dams and reservoirs, a pilot test on the aeration of reservoirs at the Natori River' s Kamabusa Dam and one other dam for the conservation of the water quality.
(3) Purification of Coastal Areas
(1) In order to recover the functions of costal and inland-water fishing grounds whose utility had reduced due to the accumulation of flotage, such as throwaways, the cleanup projects (at 30 places) done by prefectures were subsidized, and (2) dredging, sea farming, water conducting bottom ditch and other rehabilitation projects (at 35 places) which would be done for fishing grounds whose functions had gone down due to a deterioration of the water or bottom quality was subsidized. (3) Projects for the purification of sea areas, in which the removal of sludge and other work would be done in extremely polluted sea areas, were done along the seacoasts of Ichikawa and Goi Anegasaki.
(4) Removal of Sediments Polluted by Mercury and PCB
As regards the pollution of sediments by mercury, the findings of a survey conducted since fiscal 1973 indicated that there were 42 water areas across the country, whose pollution was in excess of provisional removal standards and for which removal and other measures had to be taken. Of them, the work was completed for 41 water areas as of the end of July 1989, and the only water where the measures are being taken is Minamata Bay (in Kumamoto Prefecture). In addition, it is confirmed that there exists one water area where the pollution of sediments has been caused by natural factors.
The findings of a survey conducted since fiscal 1972 on the pollution of sediments by PCB indicated that there were 78 water areas across the country where removal and other measures had to be taken. Of them, the work was completed for 75 water areas as of the end of July 1989, and the removal of sediments is performed or studies are under way on them for Sasebo Port (In Sasebo City) and 2 other waters.
7. Water Pollution in Agriculture, Forestry and Fisheries
(1) Measures Against Pollution of Agricultural Water
From the standpoint of conserving the quality of agricultural water, the actual state of damage on agriculture by the pollution of agricultural water and the quality of underground water for agriculture across the country were inspected, and surveys on the actual water quality and cause of pollution were surveyed for large-scale agricultural reservoirs whose water pollution was concern. Yet another survey was performed to establish methodologies to improve the quality of effluent in agriculture.
In areas for the promotion of agriculture, an agricultural hamlet effluence project which was designed to develop facilities for the treat-ment of foul and other water discharged from agricultural hamlets, was conducted in 361 sections, whereas a project on measures against damage on the water quality, in which water supply and drainage channels would be separated to shift to another source of water, was conducted in 70 sections where damage prevention measures were urgently required.
(2) Prevention of Pollution in Fisheries
The impacts of mercury, PCB and other hazardous chemicals on fish and shellfish and the state of pollution were surveyed, and measures against the poisoning of shellfish, such as methods to foretell the poisoning of shellfish, were implemented, and environmental surveys for the prevention of water pollution and the like in areas for the develop-ment of costal marine resources were subsidized under the Promotion Law for the Development of Oceanic Resources.
Surveys which were required to establish monitoring methods for surveillance on the impacts of large-scale development projects in shallow sea areas on fisheries, studies on the impacts on fishery resources by the decrease of organisms in conjunction with massive water intakes by power generation plants, and surveys to establish quantitative methods on the functions to purify tidelands and shallow sea areas.
For the Seto Inland Sea and other seas where there appeared red tides and shellfish poisoning phenomena and Lake Biwa and other inland waters, the generation of plankton which gave rise to red tides and the poisoning of shellfish were surveyed, and measures for the prevention of red tides, in which information would be gathered on plankton and exchanged among, or delivered to, related institutions, were subsidized. Survey projects on the investigation of resting spores in embayments to contribute to the prevention of damage from red tides, tests on the early development of technology for the detection of red tides which are generated in broad areas and deep layers, and tests on the development of technology to prevent damage from Chattonela red tide, among others, were conducted.
lV. Conservation of Water Quality of Closed Water Areas
A check of the pollution of public water areas in Japan in recent years indicates that the rates of attaining environmental quality stan-dards particularly for inner bays, inland seas, lakes and reservoirs and other semi-closed water areas with significant sources of pollution in the hinterland remain lower than those for other water areas, because the load of pollutants which flow in is great and they tend to accumulate. In addition, as substances containing nitrogen, phosphorus, etc., flow in algae and other aquatic organisms propagate and grow thick, and the water quality progressively deteriorates, giving rise to what is known as eutrophication.
A check of the rates of attaining environmental quality standards in those closed water areas in fiscal 1988 in terms of COD, a typical parameter of organic pollution, reveals that they remain low in Tokyo Bay, Ise Bay, and that as for the Seto Inland Sea, they are low in Osaka Bay and Hiroshima Bay, etc. (Fig. 3-1-8 and Fig. 3-1-9).
A check of the occurrence of red tides reveals that there were three cases in Tokyo Bay, 21 cases in use Bay and 9 cases in the Seto Inland Sea (those are the figures confirmed by the Maritime Safety Agency), In Tokyo Bay and other sea areas, the occurrence of blue tides is observed. There are not a few lakes and reservoirs where there occur water bloom and freshwater red tides.
In order to cope with those situation, there is the need to work for a further promotion of measures to conserve the water quality of closed water areas.
1. Areawide Total Pollution Load Control
For improvements in the water quality of inter-prefectural closed waters, it is necessary to effectively curb the total pollution load.
As the Water Pollution Control Law was revised in 1978, are-awide total pollutant load controls, with which to work for an across-the-board reduction in the pollution load of the given waters, were strengthened to maintain areawide total pollutant load controls for the water quality. F or Tokyo Bay, Ise Bay and the Seto Inland Sea, areawide total pollutant load controls were carried out with chemical oxygen demand (COD) as a designated item.
The first series of areawide total pollutant load controls was exercised with fiscal 1984 as the target year. For the execution of the second series of areawide total pollutant load controls with the target year at fiscal 1989, the Prime Minister formulated a new policy on areawide total pollutant load controls in January 1987. On the basis of this policy, new areawide total pollutant load control programs were formulated by related prefectures in April 1987.
In the second areawide total pollutant load control programs, the reduction target by source of pollution for the target year was set, and for the attainment of this target, various measures which encompass industry and livelihood are to be stepped up in a comprehensive manner. The application of areawide total pollutant load controls to effluent from factories, and business establishments, which exceed specified scales, and measures to reduce the pollution of load, such as the develop-ment of sewer systems, are implemented (Fig. 6-4-1). In addition, the formulation of a guideline for guidance to smaller business establishments on reductions in the pollution load and other measures are im-plemented.
Fig. 6-4-1 Generation Loads and Reduction Targets fore 3 Sea Areas with Areawide Total Pollutant Controls by Source
Remarks: Actual figures for FY 1979 and FY 1984; reduction target figures for FY 1989. (In tons/day)
For the execution of the next series of areawide total pollutant load controls, surveys on areawide total pollution load control stan-dards, measures to cope with livelihood effluent and measures to cope with effluent from smaller business establishments are stepped up, and while the implementation of the second series of areawide total pollu-tion load controls is taken into account, measures for a concrete execu-tion of the next series of areawide total pollution load controls are under study.
2. Eutrophication
Essentially, eutrophication represents a phenomenon in which lakes and reservoirs are gradually fertilized as a result of the supply of nitrogen, phosphorus and other nutrient salts, but due to the concentra-tion of population and industry there has been rises in the flow of nitrogen, phosphorus and other nutrient salts even into inner bays and the like in addition to lakes and reservoirs, encouraging algae and other aquatic organisms to propagate and grow thick, so that there appear areas where the water quality is progressively deteriorated, posing issues in terms of the conservation of the water quality.
For lakes and reservoirs, therefore, there have occurred various hazards, such as the filter trouble with water supply and offensive odor of tap water and the perishing of fish and shellfish in addition to scenic damage due to decreases in the transparency and changes in water color. In sea areas, damage on fisheries by red tides is posed as an issue.
Given the occurrence of damage by such eutrophication, the following measures are implemented.
In implementing measures against eutrophication, it is necessary to make clear the environmental targets for the causative substances. For this reason, environmental quality standards for nitrogen and phosphorus for lakes and reservoirs were notified in 1982, and research efforts were conducted by the central and prefectural governments on the establishment of categories. By fiscal 1989, such categorization had been done for a total of 44 waters (40 lakes and reservoirs), including Lake Biwa (2 water areas). The targets which are associated with the prevention of sea eutrophication are now under study by the Environ-ment Agency.
For the prevention of eutrophication, general effluence standards were formulated on nitrogen and phosphorus for lakes and reservoirs and effluence controls were started in July 1985. The lakes and reser-voirs on which effluence controls were exercised were increased in July 1989. At present, effluence controls are exercised on phosphorus for 1, 066 lakes and reservoirs and on nitrogen for 78 lakes and reservoirs. In addition, a survey for the application of nitrogen effluence controls was conducted.
In order to prevent the occurrence of damage by the eutrophica-tion of the Seto Inland Sea, the related prefectures are providing guidance on reductions in the effluence of phosphorus and its com-pounds under the Law Concerning Special Measures for Conservation of the Environment of the Seto Inland Sea.
As a result of the exchange of information, liaison and coordina-tion with the related prefectures at a liaison meeting on measures to cope with the eutrophication of Ise Bay and Tokyo Bay, the related prefectures began to implement measures to prevent eutrophication in 1982. A survey on measures to reduce nutrient salts was also conducted.
Mechanisms for the generation of red-tide plankton which are significantly generated in the Seto Inland Sea were analyzed and sur-veyed. A survey was also conducted on mechanisms for the generation of blue tides which have been at issue in recent years for Tokyo Bay.
3. Environment of Lakes and Reservoirs
Pollutants tend to accumulate in lakes and reservoirs, which are closed water areas, so that the attainment of environmental quality standards is lower than the case with rivers and seas. A wide variety of hazards is caused to water utilization by eutrophication. The causative factors for the pollution of lakes and reservoirs are diversified, ranging from the daily activities of various industries to the livelihood of people, and for the conservation of the water quality, the Law Concerning Special Measures for the Conservation of the Lake Water Quality has been enforced since March 1985, as the regulations contained in the Water Pollution Control Law alone were not sufficient.
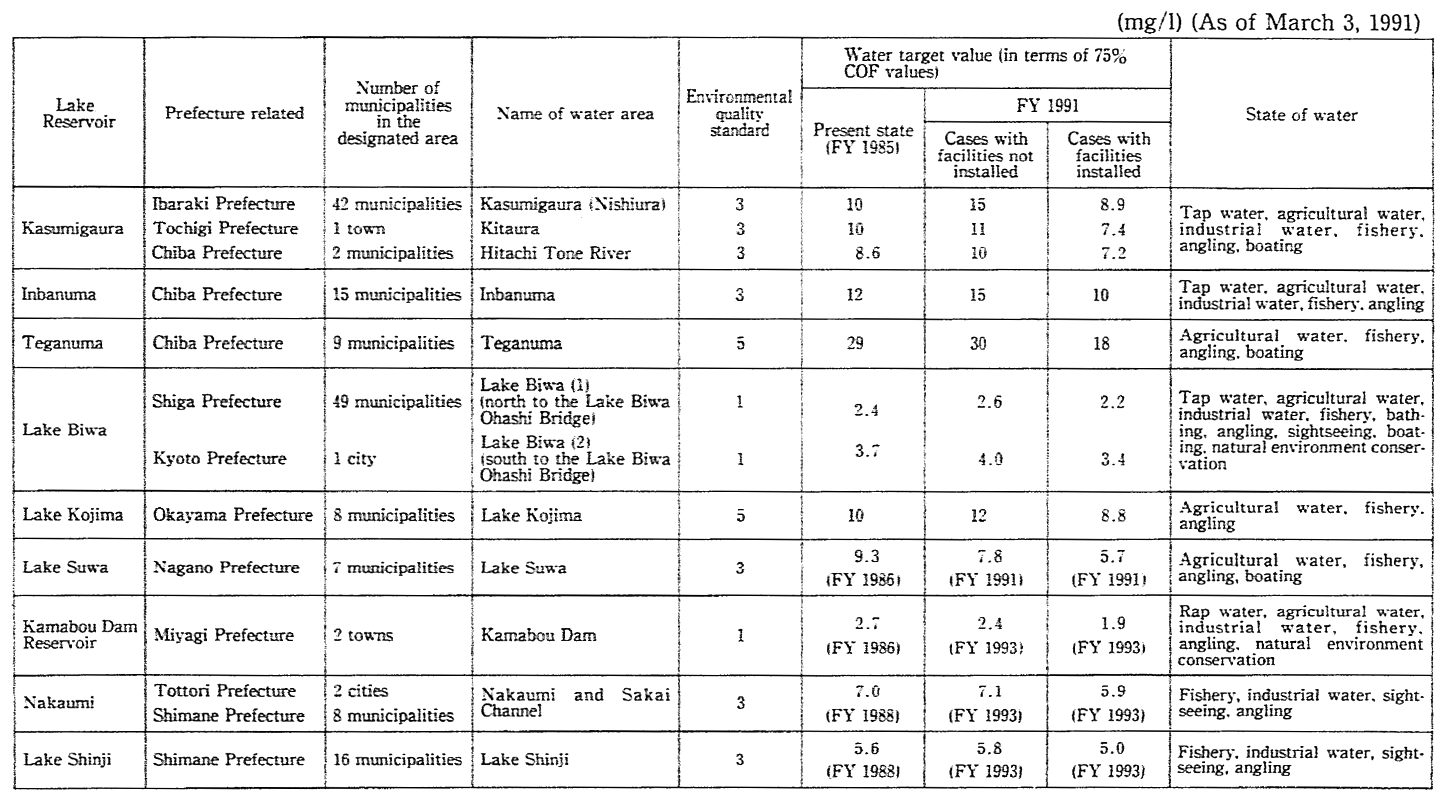
In order to conserve the water quality of lakes and reservoirs, the law is designed to implement measures in a comprehensive and system-atic manner, such as the designation of lakes and reservoirs for which the maintenance of environmental quality standards is urgent, the formulation of programs for the conservation of their water quality, sewer system development and other projects contributory to the con-servation of their water quality and the protection of their natural environment. Under the law, programs for the conservation of the water quality were formulated for Nakanoumi and Lake Shinji in March 1990.
The outline of nine designated lakes and reservoirs is given in Table 6-4-2.
4. Environmental Conservation of the Seto Inland Sea
Since ancient times, the Seto Inland Sea has been an excellent natural scenery and has been bringing up various fishery resources. On the other hand, in recent years, population and industry have been concentrated in its surrounding districts, attending with its character of a semi-closed water area, water pollution had progressed rapidly in the 1965-74 period. Given this factor, there arose calls for an implementa-tion of measures for the conservation of its water quality.
Table 6-4-2 Outline of Designated Lakes and Reservoirs
Remarks: 1. Surveyed by the Environment Agency.
2. The maximum value in case there are more than one environment quality standard point.
Under this situation, the Law Concerning Provisional Measures for Conservation of the Environment of the Seto Inland Sea was enacted in 1973, and furthermore in 1978, this law was replaced by the perpetual Law Concerning Special Measures for Conservation of the Environment of the Seto Inland Sea, and which incorporated new measures to step up comprehensive measures.
As a result, the attainment of environmental quality standards stood at 81% for the water quality of the whole Seto Inland Sea in terms of COD, suggesting that there have been considerable improvements as a whole, but in Osaka Bay, Hiroshima Bay and other inner bays, the attainment rate remains low. For Type A water areas which constitute most of the Seto Inland Sea, the attainment rate was low with 57% in fiscal 1988.
A state of eutrophication in which phytoplankton massively propagate due to the inflow of nutrient salts is observed in the Seto Inland Sea. The outbreak of red tides, which is one of the phenomena associated with eutrophication, is broadly observed, and in 1989, there were 124 cases (confirmed by the Fishery Agency) where the occurrence was ascertained (Fig. 6-4-3).
In a total of 6 cases from August to September, damage on fisheries was caused by red tides.
Fig. 6-4-3 Trends in Number of Ascertained Generation of Red Tide in Seto Inland Sea
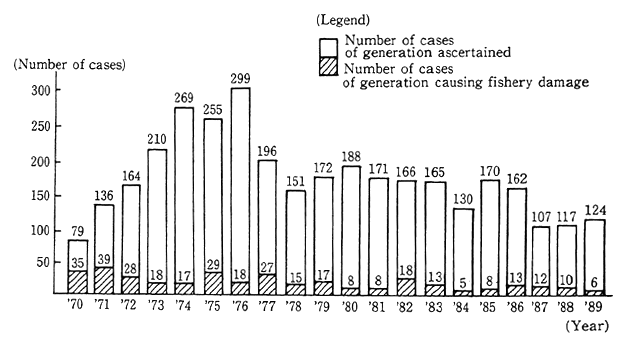
Remarks: Surveyed by the Fishery Agency. The tabulation represents actual numbers.
Additionally although the number of cases in which sea pollution was caused by oil drastically decreased from 874 in 1972 to 142 in 1989, the occurrence in the Seto Inland Sea still accounted for about 23% of the national total.
The outline of measures taken for the conservation of the envi-ronment by 13 prefectures associated with the Seto Inland Sea under the Law Concerning Special Measures for Conservation of the Environment of the Seto Inland Sea is given below.
(1) Prefectural Programs
Under the prefectural programs (partially amended in December 1989), the prefectural governors concerned with the environment of the Seto Inland Sea prepared each prefectural program, in which measures to conserve the environment of the Seto Inland Sea are determined, and also enforced various environmental conservation measures.
(2) Permission for Installation Changing of Specified Facilities
A system of permission is in force for the installation changing of specified facilities, etc., and in fiscal 1988, permission was granted for the installation of facilities in 554 cases and for changing in 539 cases.
(3) Areawide Total Pollutant Load Controls of COD
At present, the third series of areawide total pollutant load controls is in force with the target year set at fiscal 1994 (see "1. Areawide Total Pollutant Load Controls").
(4) Guidance on Reductions in Phosphorus and Compounds
As a measure to cope with eutrophication, guidance was provided on reductions in phosphorus and its compounds. By taking account of a recommendation made by the Seto Inland Sea Environment Conserva-tion Council in October 1985, a guidance plan for reductions in phospho-rus and its compounds is prepared by each prefectural governor in accordance with the policy of guidance of the central government with the target year set at fiscal 1994.
(5) Conservation of Natural Beaches
The coastal areas of the Seto Inland Sea, viewed from a nation-wide point of view, are being made progressively artificial with develop-ment in conjunction with the concentration of population and industry. The remaining natural beaches are used as places of sea recreation, such as sea bathing and shell gathering, and 55 main sea bathing places were used by an estimated total of 7,940,000 people in 1988.
For the conservation of those beaches, the related 11 prefectures have enacted ordinances on districts for the conservation of natural beaches, and till the end of December 1989, 83 districts had been designated for the conservation of natural beaches.
(6) Environmental Conservation in Reclamation
In granting permission or authorization for the reclamation of public waters in the Seto Inland Sea, it is stipulated that the related prefectural governors shall give special consideration to the peculiar-ities of the Seto Inland Sea. On the basic policy of implementing this provision, the Seto Inland Sea Environment Conservation Council came out with a recommendation in May 1974. From th enactment of the Law Concerning Provisional Measures for Conservation of th Environ-ment of the Seto Inland Sea to November 1, 1989, permission or authori-zation was granted for the reclamation of 7,982 hectares in 3,117 cases (401 hectares in 166 cases in one year after November 2, 1988).
(7) Projects for Environment Conservation
a. In regard to sewer systems, the priority development of public sewer systems, basin sewer systems and public sewer systems for the conservation of the environment was carried out in the 13 related prefectures under the Five-year Sewer System Development Program.
b. Waste oil treatment facilities where waste oil from hips would be treated were developed at 40 places in 24 ports in the Seto Inland Sea (including 22 places in 16 ports to treat waste light oil).
c. Designating the Seto Inland Sea as a sea area requiring priority surveillance and control, the Maritime Safety Agency carries out sur-veillance and exercises controls in the combined operations of aircraft and patrol boats. In fiscal 1989, the agency conducted Operation "Clean the Seto Inland Sea and the Uwa Sea" three times to carry out surveil-lance and exercise controls in a concentrated manner in an attempt to eliminate the offenses of sea pollution associated with the discharge of oil, hazardous chemicals and wastes.
d. Surveys on water pollution have been successively conducted since fiscal 1972 in addition to surveys for the development of technol-ogy to forecast the outbreak of red tides, clarification of their mecha-nisms for their generation, collection of information on the environment and studies on measures to cope with eutrophication.
e. In promoting the conservation of the environment of the Seto Inland Sea, the understanding and cooperation of residents, entrepre-neurs and the like were so indispensable that projects for the propaga-tion of thoughts about the conservation of the environment at study, lecture and other meetings were held through the Seto Inland Sea Environment Conservation Association, a foundation, also in fiscal 1989.
V. Groundwater Pollution--Present State and Measures
1. Present State of Groundwater Pollution
As the result of a survey conducted by the Environment Agency on the pollution of groundwater in fiscal 1982 and 1983, pollution by trichloroethylene and other chemicals was observed at many places. The findings of the general surveys performed by local governments in the period of fiscal 1984 and fiscal 1988 reveal that concentrations in excess of the provisional drinking water quality standards had been detected in 2.7% of 27,000 wells for trichloroethylene and 4.2% for tetrachioroethylene, suggesting that groundwater was polluted at many places.
As surveys on general conditions by local governments, fact-findings on the pollution of well areas where no surveys had been made before were conducted in 765 municipalities in 37 prefectures. The excess rate of wells where the provisional drinking water quality standards was 4.3% with tetrachloroethylene and 0.2% with 1,1, 1-trichloroethylene (Table 6-5-1).
Table 6-5-1 Findings of Survey on General State of Groundwater Pollution
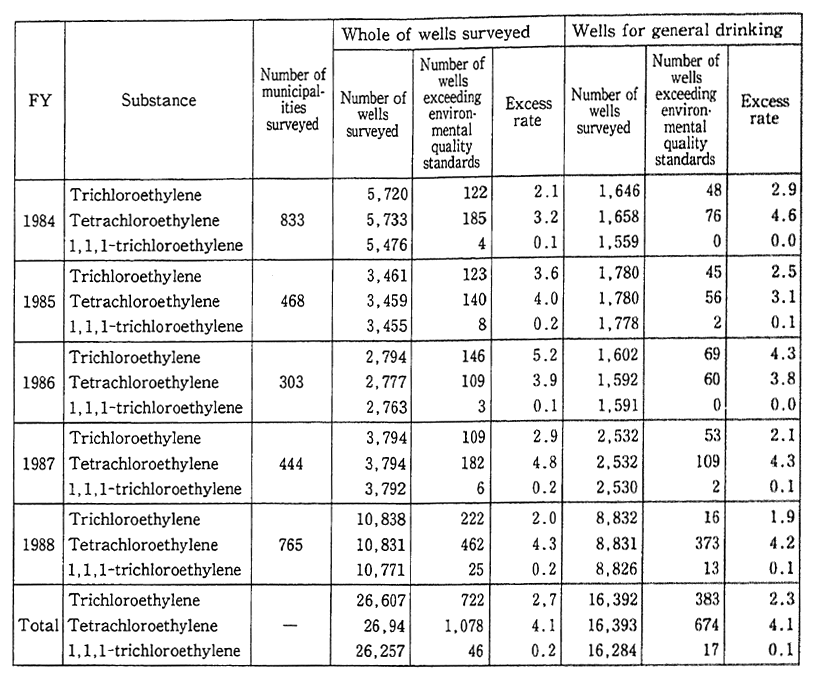
Remarks: 1. Surveyed by the Environment Agency.
2. Of the wells surveyed, the wells for general drinking referred to here are those which are used for general water drinking.
3. The districts surveyed differ, depending on the year from FY 1974 to FY 1988.
A comparison of the findings of the surveys on the general environment conducted in fiscal 1984-87 with those in fiscal 1988 indi-cates that though the sampling points were different, pollution by tetrachloroethylene and other chemicals was observed in the areas newly surveyed in fiscal 1988 at rates similar to those for the areas earlier surveyed.
The Environment Agency also carries out surveys on the pollu-tion of groundwater by chemicals other than trichioroethylene, etc., and in fiscal 1988, carbon tetrachioride and 5 other chemicals were surveyed.
As a result, the detection rate was high for 3 kinds of dichloroeth-ylene, and some were in excess of the WHO drinking-water quality guideline and the U.S. Environmental Protection Agency's drinking-water quality standards, and there is concern about an enlargement of groundwater pollution. It seems to highly possible that the biological and non-biological dissolution of trichloroethylene and other chemicals has something to do with the pollution of groundwater by dichloroeth-ylene (Fig. 6-5-2).
Table 6-5-2 Results of Fact-finding Survey on Groundwater Pollution in FY 1988
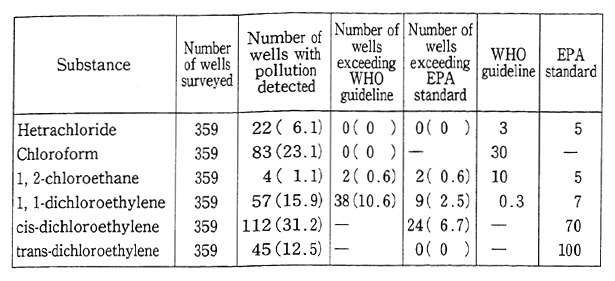
Remarks: Surveyed by the Environment Agency.
2. Measures Against Groundwater Pollution
It is difficult for groundwater, once polluted, to recover itself, so that preventive measures must be formulated to check the ongoing pollution. For this reason, the Environment Agency has continued since August 1984 to provide guidance with the formulation of a provisional guideline on reductions in effluence from factories and industries deal-ing with them. Moreover, the Ministry of Health and Welfare and the Ministry of International Trade and Industry provide guidance to related industries, and the Ministry of Construction also provides guid-ance and surveys groundwater.
Nonetheless, the findings of subsequent surveys reveal that the pollution of groundwater by trichloroethylene and other chemicals was still observed at many places, so that the Central Council for Environ-mental Pollution Control was inquired about on measures to conserve groundwater. A recommendation came out in February 1989.
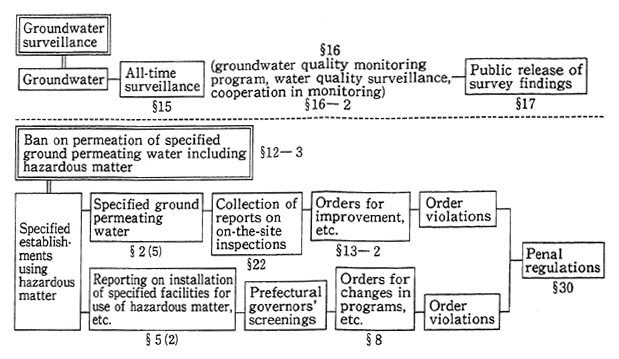
On the basis of this recommendation, a bill for a partial revision of the Water Pollution Control Law was introduced to the Diet at its 114th session with a view to preventing groundwater pollution by toxic substances. The bill passed as drafted and was enacted. It was promul-gated on June 28, 1989, and was put into force on October 1, 1989.
Under the revised law, measures were taken, such as a ban on the permeating of toxic substances-containing water into the underground, amendments in provisions on prefectural governors' orders for improve-ments of facilities, etc., and all-time surveillance over the quality of groundwater by prefectural governors (Fig. 6-5-3).
Fig. 6-5-3 Systems of Controls, Etc., under the Revised Water Pollution Control Law (Related to Groundwater)
As measures to cope with groundwater pollution by chemicals other than trichloroethylene, the Environment Agency in April 1989 formulated a provisional guideline on carbon tetrachloride to prevent its pollution. Under this guideline, it has provided factories and industries with guidance for reductions in its discharge. Moreover, as regards dichloroethylene, the Environment Agency called on December 1, 1989 on prefectures and administrative ordinance-designated cities to strive to come to grips with the actual state of groundwater pollution.
When it comes to groundwater pollution, there is the need for studies, such as a clarification of the behavior of pollutants under the ground, and the Environment Agency carries out a survey to clarifica-tion of mechanisms for groundwater pollution and make further studies on the way the control of underground water ought to be.
VI. Marine Pollution-Present State and Measures
1. Present State of Marine Pollution
(1) Ports and Harbors and Peripheral Sea Areas
In broad terms, there are gradual improvements in the water and sediment pollution of the nation's ports and harbors and peripheral seas, but there still are many sea areas which are polluted by the direct inflow by way of rivers of waste water from factories and business establish-ments and livelihood effluent.
The generation of red tides still continues in Tokyo Bay, Ise Bay and the Seto Inland Sea.
(2) Adjoining Seas
The Environment Agency strives to come to grips with the actual conditions of marine pollution and carries out the Fact-Finding Survey on Marine Pollution in Seas Near Japan which is designed to check the concentration of heavy metals in the seawater and sediments, in addi-tion to general marine observation items at observation points along observation and other lines, which run by way of the center of a sea area (Sea Area A)--in a manner to cut across the sea currents running in seas peripheral to Japan--where solidified sludge and other wastes dischar-ged from the seacoast, containing such heavy metals and other chemi-cals as are specified under the Law Relating to the Prevention of Marine Pollution and Maritime Disaster.
In order to secure basic data for the conservation of the marine environment, the Maritime Safety Agency carried out marine-pollution surveys on the content of oil, PCB, heavy metals and other substances in the seawater and seabed deposits in the Japanese peripheral seas, Sea Area A and major ports and harbors, confirming that there was no particular progress in the pollution.
In Japan's peripheral seas, periodic surveys are conducted on the drifting and arriving of waste oil balls. The findings of a survey conduct-ed in 1989 suggest that drifts were more significant in the sea along Kyushu's west coast than in the previous year and arrivals were on the decrease in the sea along Honshu Island's east coast. As a whole, drifts were on the downturn whereas arrivals were on the upturn.
On the other hand, the number of cases in which the occurrence of marine pollution in the seas peripheral to Japan has been confirmed by the Maritime Safety Agency, is given in Table 6-6-1. The number stood at 934 in 1989, up 7 from 1988.
A check of oil pollution by source in 1989 indicates that it was caused mostly by ships, with 476 cases. Of them, there were 180 cases in which the handling was not done with care and 111 cases in which oil was deliberately split. A check of pollution by substance other than oil reveals that there were 211 cases where those substances were dischar-ged from the land, in most of which the discharge was deliberately done.
The Meteorological Agency carries out a marine background pollution observation in the seas near Japan and the Western Pacific in order to grasp the wholesale concentration of pollutants in the seas. According to the observation, the concentration of mercury and cadmium remains at the same level as in other years. The concentration of discarded oil has remained low since 1982. That of plastics and other sea surface-floating pollutants has leveled off on the open sea, but their highly concentrated distribution has been observed in the seas near Japan, particularly along the southern coast of Honshu Island. Oil films were confirmed in seas peripheral to Japan four times in 1989.
Table 6-6-1 Trends in Number of Ascertained Cases of Generation by Polluted Sea Area
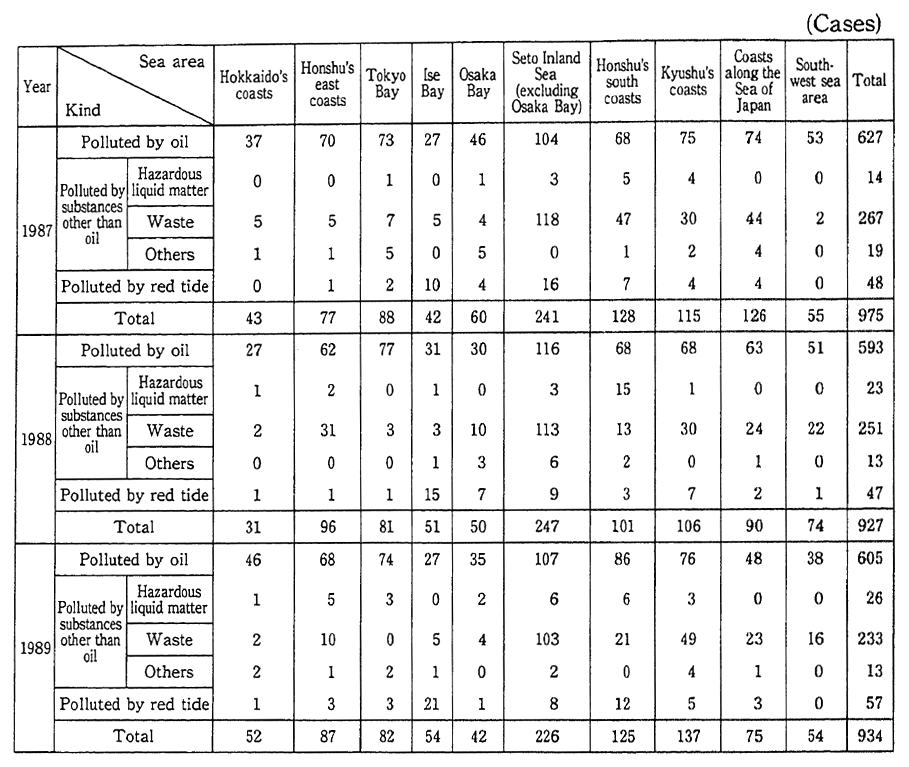
Remarks: Surveyed by the Maritime Safety Agency.
In the category of "polluted by substances other than oil," "others" represent industrial waste water, etc.
The Fishery Agency has performed a survey on the distribution of sea surface-floating pollutants in the whole Pacific since 1986. In the 1988 observation, plastics account for 61% of the sea surface-floating pollutants detected, and their concentration was found high in the Mid-Pacific and seas near Japan.
2. Prevention of Marine Pollution
(1) International Trends and Japan's Response
As the prevention of marine pollution is something from which full effects may be anticipated only when countries around the world join in coping with it, international cooperation is positively stepped up, centering on the International Maritime Organization (IMO).
The 1978 Protocol on the International Convention for the Pre-vention of Pollution by Ships in 1973 (MARPOL 73/78 Convention), which was prepared as an across-the-board treaty for the prevention of marine pollution in conjunction with the appearance of increasingly large tankers in response to changes in the mode of maritime transport and the maritime transport of hazardous matter, other than oil, by chemicals tankers and other vessels, consists of a main text and five annexes which provide for controls for each control subject. It is stipulated in the convention (1) that all oils in bulk, hazardous liquids in containers, foul water and throwaways shall be made control subjects, and (2) that controls shall be incorporated by a wide margin on the structure of ships and their facilities and necessary inspections made.
After a revision of the Fire Fighting Law, and a required updat-ing of related domestic laws, Japan, becoming a signatory to the MARPOL 73/78 Convention is striving to replenish and strengthen measures for the prevention of marine pollution.
Of this convention, the provisions contained in the main text and the provisions for the prevention of pollution (Annex I) were put into effect by the signatories including Japan in October 1983, the regulations for controls on pollution by hazardous liquids in bulk (Annex II) in April 1987, the regulations for the prevention of pollution by throwaways from ships (Annex V) in late December 1988.
Of all provisions contained in the convention, the regulations for the prevention of pollution by hazardous substances transported by sea as they were kept in containers and the like (Annex Ill) and the regula-tions for the prevention of pollution by foul water from ships (Annex IV) have yet to be put into force, and the IMO is striving to put them into effect at an earliest possible day.
As the spill of massive oil in the stranding of a mammoth tanker off the State of Alaska in March 1989 was made a turning point, the IMO has been formulating a new convention with a view to establishing international cooperation in responding to major oil-spill accidents in hopes that it will be adopted in November 1990.
(2) Preventive Measures
a. Controls on Ships
In accordance with the Law Relating to the Prevention of Marine Pollution and Maritime Damage, attempts have been made for a reason-able exercise of controls on the discharge and incineration of oils, hazardous liquids and the like, inspections to ascertain conformity with technical criteria on the structure and facilities of ships have been conducted, and certificates on marine-pollution prevention have been issued.
b. Assessment of Liquids Yet To Be Assessed
In conjunction with the imposition of controls on hazardous liquids, the Environment Agency assesses liquids that have yet to be assessed. Up to now, 98 liquids have been assessed and notice has been served on them (as of the end of December 1989). Including the sub-stances designated in an administrative ordinance, there are 549 hazard-ous liquids and 91 harmless liquids.
c. Guidance on Prevention of Marine Pollution
With the focus put on controls on oils, hazardous liquids and wastes under the Fire Fighting Law, the Ministry of Transport and the Maritime Safety Agency have strived to thoroughly disseminate infor-mation about them and enhance the consciousness about the protection of the marine environment at lecture meetings on the prevention of marine pollution.
In addition to usual guidance on the prevention of marine pollu-tion, the Maritime Safety Agency, designating a Marine-Pollution Prevention Promotion Week, has provided concentrated guidance on visits to ships and made effective use of a marine-pollution monitoring system in working for the dissemination of thoughts about the preven-tion of marine pollution and for a thoroughgoing conformity with the laws and ordinances related to marine pollution.
d. Waste Oil Treatment Facilities
Public facilities for the treatment of waste oil from ships have been improved. As of October 1989, 132 such facilities, both public and private, in 81 ports had been updated. Of them, 49 facilities in 35 ports treat discarded light oils.
(3) System for Prevention of Discharged Oil
In order to respond to spills of oil and other matter on the sea, the Maritime Safety Agency has a system of preparedness for a moveout at any time and developed and maintained equipment for the prevention and removal of spills. The agency has also had shipowners and others to equip themselves with equipment for the prevention and removal of spills and strived for the guidance and upbringing of the Maritime Accident Prevention Center, which is established as the private core organization for the prevention of maritime accidents.
The center prevented and removed discard oils in 9 cases in 1989, including the prevention and removal of oils spilled by the tanker Sunshine Leader (134,555 gross tons) for which loading work was being done at Yokkaichi Port in April 1989.
Efforts were also made to guide and bring up the Councils on Measures Against Oil Spill Accidents established in major ports and harbors across the country, carry out joint governmental and private training on coping with accidents, such as massive oil spills, and provide guidance on a strengthening of the system for the prevention and removal of discarded oils in proportion to a rise in the national reserve of petroleum.
(4) Purification of Ports and Harbors and Peripheral Seas
For conservation of the environment of ports and harbors and their peripheral seas, projects for the prevention of pollution in ports and harbors were performed in Tokyo Bay, Osaka Bay and 9 other ports and harbors in fiscal 1989. As projects for development of the environment of ports and harbors, sea walls reclaimed with wastes were developed in 23 ports and one bay, including Fushiki-Toyama Port, and a design survey was conducted for the development of an inter-prefectural waste disposal plant in Tokyo Bay.
Also conducted were projects for the recovery of trash and oil in general sea areas other than ports and harbors. Sea area environment development projects, which was designed to improve the environment of highly closed and sludge-accumulated sea areas (sand containment and beach development), were performed in two sea areas and two ports, such as in the Seto Inland Sea.