Quality of the Environment in Japan 1990
(2) Acid Rain
It is surmised that the generation of acid rain results from the melting by rain of sulfur and nitrous oxides which come out in the combustion of fossil fuels. It is directly tied in with energy consumption [see 2 (3), Section I ].
Acid rain will sometimes fall on areas thousands of kilometers away from the source of its generation, becoming an international political issue for Western countries which transcends national borders. There is concern that serious damage will be inflicted on developing countries, too, where energy demand is expected to rise at a rapid pace in the future.
In Japan, too, acid rain with mean values of pH 4.4-5.5 is monitor-ed and the fallout of acid rain which is the same as or greater than in Western countries is monitored, but impacts on ecosystems in forests, soils, lakes and marshes, etc., have not come to the fore (see 1. Section I, Chapter 3).
(3) Heat Island Phenomenon
In cities, energy is high-intensively consumed. Besides, as most of the ground in cities is covered with asphalt, concrete and other dry substances so that we cannot expect drops in temperature by water evaporation. Green tracts of land seldom regenerate the heat of solar radiation, which is transpired, whereas asphalt and cement, etc., regen-erate it for emission at night, thus deterring a drop in temperature at night. As a result, the temperature at the center of the city is higher than on the outskirts. When this phenomenon is delineated with isothermal lines, it looks as though there were an island with a city at its center. That is why it is known as the "heat island phenomenon." Residents in Tokyo and other major cities may acutely feel this phenomenon.
Tokyo's mean temperature has risen by 1.5 degree C to 15.5 degree C over a period of a little more than 100 years from about 14.0 degree C in the 1870s, whereas the annual mean humidity has dropped by about 12 percent from about 77% to about 65%. The heat island phenomenon is believed to be one of the causes (Fig. 1-2-3).
When the heat island phenomenon has taken place, the rise in temperature in the summer season serves to raise energy demand for the air-conditioning system, giving rise to a vicious cycle in which the temperature of cities increasingly rises.
Fig. 1-2-3 Trends in Average Temperature and Humidity at Otemachi, Tokyo
(1) Annual average temperature
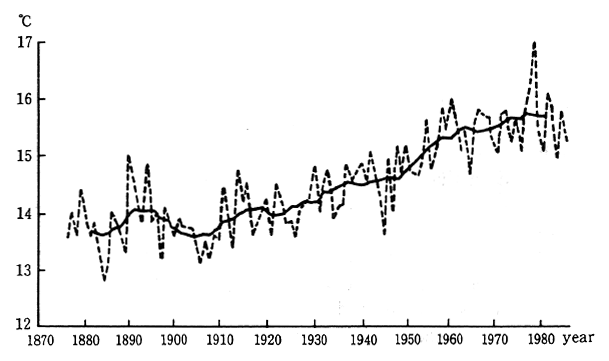
Note: Running average (11 years) and annual average temperatures (Results of the Meteorological Agency's observation)
(2) Annual average humidity
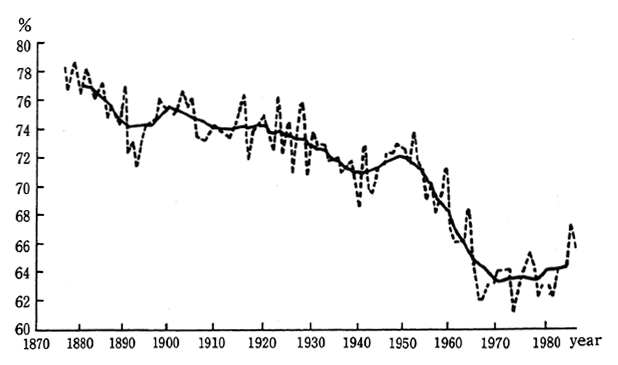
Note: Running average (11 years) and annual average humidity (Results of the Meteorological Agency's observation)
Plants absorb the peripheral heat when water evaporates from the surface of leaves, thereby functioning to adjust the air temperature. The heat island phenomenon is closely tied in with how such green tracts of land is put to effective use in cities, and it might be said that the problem is how to realize the circulation of urban ecosystems.
(4) Global Warming
As we have seen in 1, Section I, in this chapter, global warming is apt to directly threaten the foundation of mankind's existence, and how to cope with it constitutes one of the most important challenges for the world. It is projected that global warming is generated as a result of a combination of emissions of greenhouse gases and various factors, including the depletion of forests which are the sink of carbon dioxide which has greenhouse effects.
Of the greenhouse gases which are artificially discharged, it is also estimated that the most of carbon dioxide emissions and about one-third of methane emissions are related to the energy. It is computed on a trial basis that about 57% of all anthropogenic contributions to global warming is due to the production and consumption of energy (Fig. 1-2-4). Therefore, in implementing measures for the prevention of global warming, it might be said that the key is to curb the emissions of carbon dioxide related to energy consumption. Moreover, now that carbon dioxide, wherever it is generated in the world, produces the same impact on the global environment, so that it would be difficult to assure full response effects simply by specific countries, and it is a grave issue with which the whole world has to cooperate to cope.
Fig. 1-2-4 Anthropogenic Contributions to Global Warming
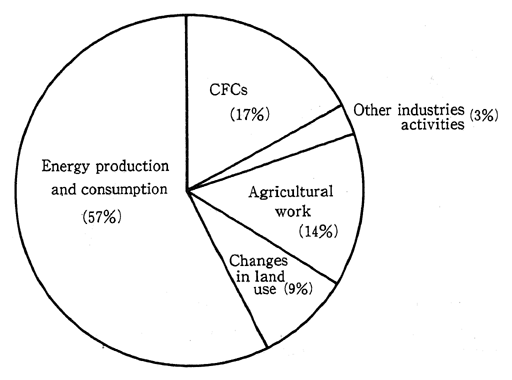
Note: 1. The diagram shows the propotions of contribution to global warming.
2. Source: US-EPA, "Policy Options for Stabilizing Global Climate" (Feb. 1989)
2. Structure for Energy Consumption and Carbon Dioxide Emission
A check of energy consumption in the world reveals that indus-trialized countries, which account for a mere 24% of the world popula-tion, consume 75% of energy. They also account for 73% of the emission of carbon dioxide in the combustion of fossil fuels. Meanwhile, it is projected that energy consumption will increase primarily in the devel-oping world related to the population growth and the ongoing industrial-ization in the future. Unless effective measures are implemented for environment conservation, there will be a further rise in carbon dioxide emissions.
In Japan, on the other hand, energy consumption leveled off since the second oil crunch but there was a sudden rise after 1987, thereby increasing emissions of carbon dioxide. developing countries rose from 15.0% in 1973 to 25.2% in 1987.
The rate of consumption by type of energy indicates that con-sumption is in order of oil, coal and natural gas (Fig. 1-2-6). Since the first oil crisis in 1973, oil consumption has been curbed and that of coal, natural gas and nuclear power has been on the upturn. By region, oil accounts for about 50% in the market economies including developing countries, followed by coal, natural gas and nuclear power.
(1) World Structure for Energy Consumption
After World War II, energy consumption around the world consis-tently continued to rise, and for the period of 23 years before 1973, when the first oil crisis broke out, it had increased threefold at an annual rate of 4.9% (Fig. 1-2-5). The countries categorized as industrialized at present accounted for 89% of the increase.
After 1979 when the second oil crunch broke out, there continued to be signs of a drop in the world's energy consumption due to a drop in demand by industrialized countries. Since 1983, it has risen at an annual mean rate of 3.16% as oil prices have hovered low and there has been a worldwide business recovery. Above all, the increase in the developing world has been large in recent years, and the rate of consumption by the
In the Soviet Union, on the other hand, the share of natural gas is greatest with 40%, whereas coal accounts for 80% in China. Develop-ing countries heavily depend on charcoal, firewood, cow dung and other types of traditional energy. 70% of energy used in areas south to Sahel in Africa depends on these traditional energy sources. Thus, the sources of energy largely differ, depending on the region.
Fig. 1-2-5 Trends in World's Energy Consumption (1950-87)
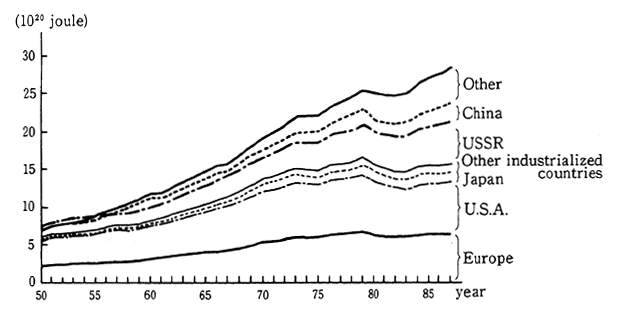
Source: U.N. statistics.
Fig. 1-2-6 Mixture of Energy Source
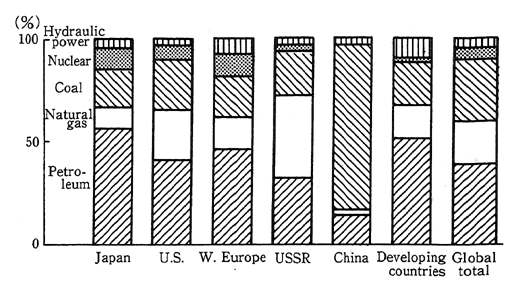
As for prospects for energy consumption in the future, it is projected that it will steadily increase primarily in the developing world. According to data available at the 14 th World Energy Congress held in September 1989, the demand of primary energy in 2020 will be 1.51-1.76 times as much as in 1985 or increase at an annual rate of 1.18-1.63% (Table 1-2-7).
Table 1-2-7 Protects for Future Demand of Primary Energy at World Energy Congress
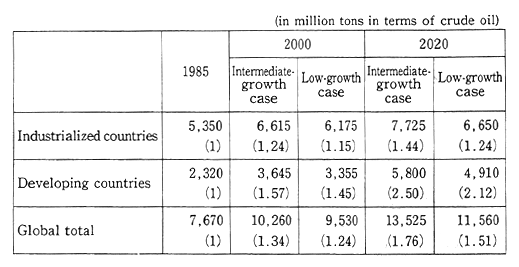
Remarks The figure in parentheses represent consumption with 1985 consumption at 1.
(2) Emission of Carbon Dioxide Due to Consumption of Fossil Fuels
Coal, oil and natural gas, which are fossil fuels, emit carbon dioxide in their combustion. In the projected emissions of carbon diox-ide due to energy consumption, the United States comes on top of the list, followed by the Soviet Union, China and Japan, suggesting that the industrialized countries who have much energy consumption and the countries whose rate of coal consumption is high, such as China, have a big share (Fig. 1-2-8).
Carbon dioxide emissions for unit gross domestic product (GDP), significantly vary by countries, but the figures are generally high for developing countries which stay at low levels of economic development and whose energy efficiency is relatively low (Table 1-2-9). The emis-sions per GDP of Japan are lowest in the industrialized world.
The emission of carbon dioxide per capita is high for industrial-ized countries where the industrial activities are significant and GDP per person is high, as it reflects high levels of energy consumption. But even in the developed world, the emission per capita greatly differs, depending on the meteorological conditions, the composition of energy sources, the industrial structure, the degree to which energy saving is promoted and the livelihood practices. It is small for Japan as well as France which features a high degree of dependence on nuclear energy.
Fig. 1-2-8 Trends in Region-Specific Emission of Carbon Dioxides (1950-87)
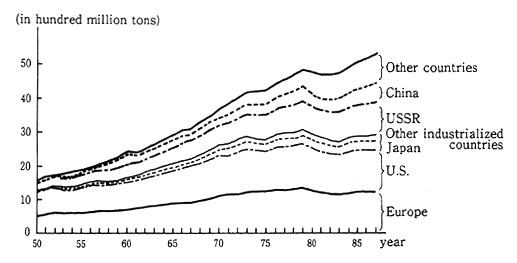
Remarks:1. In terms of carbon
2. Only the discharge of CO2 by consumption of fossil fuels is tabulated.
3. Prepared according to U.N. statistics, etc.
Table 1-2-9 Comparison of Each Country's Carbon Dioxide Emission per GDP, per capita and per area (1987)
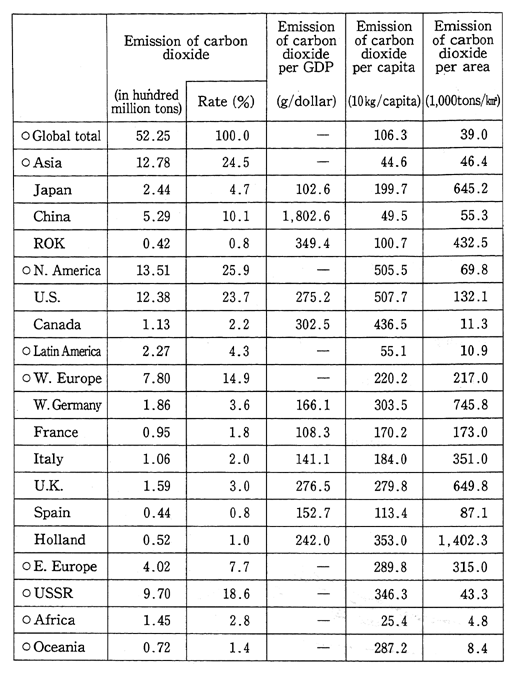
Remarks:1. Carbon dioxide is from the combustion of fossil fuels. Computed in terms of carbon.
2. Prepared according to U.N. statistics, World Bank's statistics, etc.
3. Of the populations used for the computation of the per-capital emission of carbon dioxide, those marked with "0" are values for 1986.
Emissions of carbon dioxide by area shows that it is high as a matter of course for countries the national land of which is narrow and whose economic activities are intensive. It is high for Japan along with European countries.
(3) Structure of Energy Use in Japan and Original Unit for Energy Consumption
Before the oil crisis, energy consumption in Japan rose at a rate higher than its economic growth rate with the emphasis shifted from the consumption of coal to that of oil (the annual mean growth rate of energy consumption stood at 10.9% as against the annual mean eco-nomic growth rate of 9.3% from 1955 to 1973 when the first oil crisis broke out). After the first oil crisis, the rise was curbed and from 1979, when the second oil crisis took place, to 1986, energy consumption virtually leveled off, though it increased or decreased a bit, depending on the year, but it began to increase drastically since 1987, as we see in (4) later.
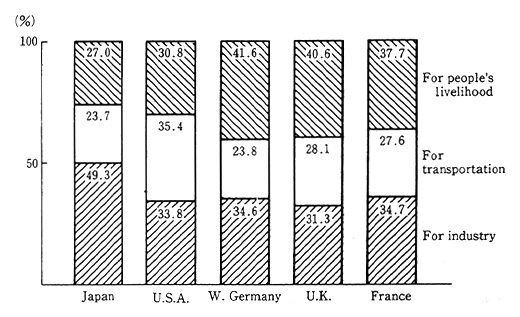
Fig. 1-2-10 Sector-Specific Rate of Energy Consumption in Major Countries (1987)
Remarks: Prepared according to data from the Agency of Natural Resources and Energy
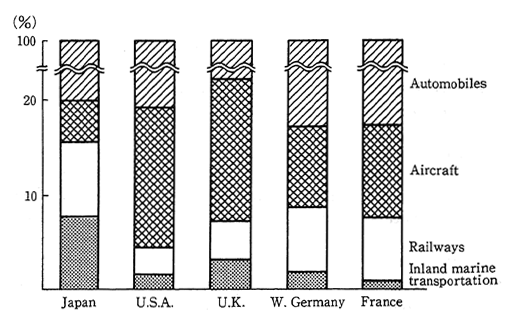
One structural feature of energy consumption in Japan is that the share of the industrial sector is relatively high, and though there are signs of a decrease in a long-term perspective, it still accounts for the greater portion of Japan's energy consumption. Presumably, this is because the consumption of energy for heating purposes is relatively insignificant in Japan and because the consumption of energy for trans-port is low as Japan is more dependent than other industrialized coun-tries on railway and inland marine transport which have higher energy efficiency than automobile and aircraft transport (Fig. 1-2-10 and Fig. 1-2-11).
Fig. 1-2-11 Comparison of Transport Energy Consumption in Major Countries by Means of Transportation
Note: Prepared according to data from the Ministry of Transport.
The two oil crises served to drastically increase oil prices and improve the energy consumption efficiency not only in Japan but in other countries as well. Fig. 1-2-12 shows trends in the original unit of energy consumption per GDP (the quantity of energy necessary for one unit of GDP) in major industrialized countries. From this figure, it is discernible that there has been much progress in the efficiency of energy use in each country. In particular, the progress has been significant in Japan with the highest rate of improving the original unit of energy consumption and with the original unit of energy consumption itself lowest among the industrialized countries.
The primary reason for Japan's highest improvement rate in the original unit of energy consumption is energy saving primarily in the industrial sector. In almost every industry, energy has been considerably saved, and the original unit of energy consumption (with 1973 as the basic year) in six main industries--iron and steel, petrochemical, paper and pulp, dye and finished textiles, cement and chemical textile--which account for about 70% of energy consumption by Japan's industrial sector was improved by 20-40% for each industry from 1973 to 1987 (Fig. 1-2-13). In terms of energy-saving, Japanese industry presumably belongs to the world's top class, and the original unit of energy consump-tion in other industrialized countries is 1.2-1.4 times higher than that of Japan in the iron and steel industry and 1.5-1.6 times in the cement industry (Fig. 1-2-14 and Fig. 1-2-15).
Fig. 1-2-12 Trends in Major OECD Countries' GDP Energy Original Unit
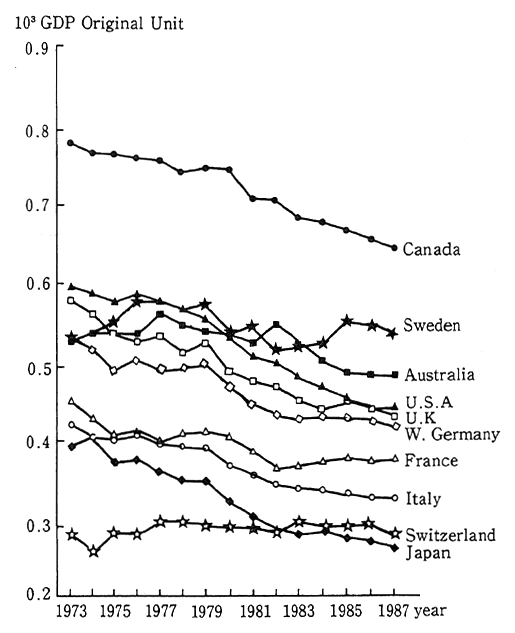
GDP energyoriginal unit= primary energy demand (toe)/GDP (in million U.S. dollars in 1985)
Source Energy Balances of OECD Countries 1986/87.
The industrial sector has been able to contribute to the improve-ment of the efficiency of energy consumption per GDP in Japan, partly because it has strived to come out with products with higher values-added in addition to the progress of energy-saving efforts--that is, it has been equipped to put out products of higher values-added even with no increase in energy consumption.
Fig. 1-2-13 Trends in Energy Original Unit in Major Industries
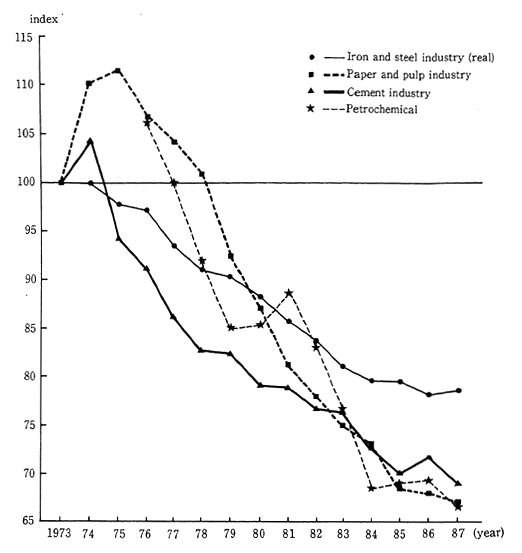
Notes: 1. Illustrated for the petrochemical industry with 1977 at 100.
2. Real original unit for the iron and steel industry adjusted in terms of production conditions prevalent in 1983.
Source: Survey by the Ministry of International Trade and Industry.
Fig. 1-2-14 International Comparison of Original Unit of Comprehensive Energy in Iron and Steel Industry (1987)
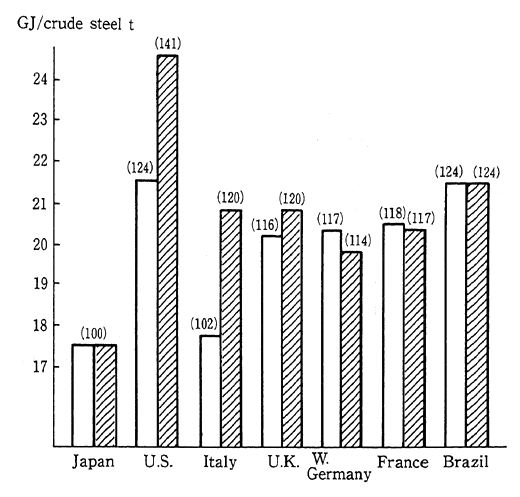
Note 1: The figures in parentheses are indices with Japan at 100.
Note 2: Comparison of each country's iron and steel industry as a whole.
Note 3: The slanted-line graphs indicate a comparison of the original unit of energy consumption in each country as adjusted in terms of Japan's steel rate.
Remarks : Prepared according to data from the Energy Conservation Center.
The rate of values-added to GDP which are produced by the basic-material industries that consume much energy has leveled off since 1975 (Fig. 1-2-2), but the original unit of energy consumption per value-added of the basic-material industries themselves decreased by about 53% from 1975 to 1987. Fig.1-2-16 gives an analysis of factors for increases and decreases in the consumption of energy by the basic-material industries. It is discernible from this figure that the original unit of energy consumption per unit of output has almost always served to lower energy demand, suggesting that the saving of energy per unit of output has made progress. Increases in GDP have functioned to move up energy demand. Changes in the GDP shares of the basic-material industries might be described as having contributed to increases in the consumption of energy in the business upturn, as the basic-material industries become more brisk than the GDP growth rate, and to decreases in the consumption of energy in the business setback. On the other hand, it has significantly contributed to decreases in the consump-tion of energy to provide higher values-added to products.
Fig. 1-2-15 International Comparison of Original Unit of Energy Consumption in Cement Industry
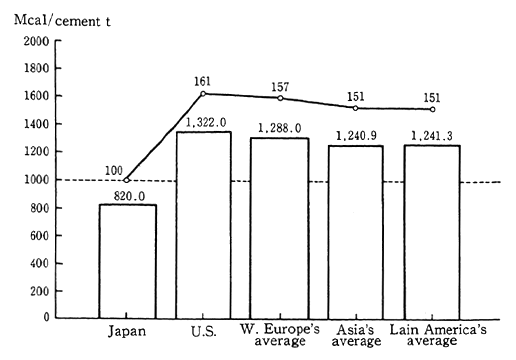
Note: The mark "0" represents figures with Japan at 100.
Source: Cembureau: World Cement Directory.
The share of the whole manufacturing industry in GDP has consistently increased due to an expansion of the processing and assem-bling industries, but the original unit of energy consumption per value-added of the whole manufacturing industry dropped by about 58% from 1975 to 1987 partly because of the effects of increases of the share of the processing and assembling industries in the whole manufacturing indus-try.
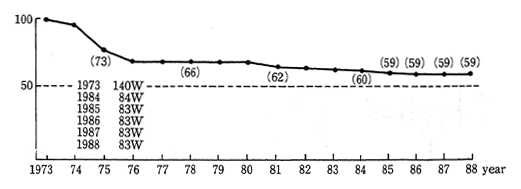
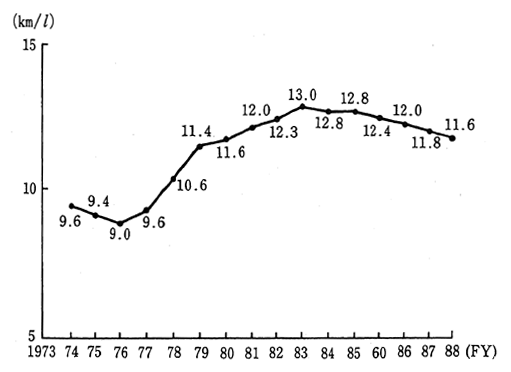
In Japan, considerable improvements have been made not only in the industrial sector but in the energy efficiency of major equipment and passenger cars for use by citizens as it went through the two oil crises (Fig. 1-2-17 and Fig. 1-3-18).
As a cause of the reduced original unit of energy consumption per GDP, the relatively low consumption of energy for heating systems and transport in Japan may be cited as we have seen earlier in addition to efforts of energy saving. At least from a standpoint of past tendencies, the industrial sector of each country was highly conscious about cost and the economic principles readily functioned so that energy consump-tion was apt to reflect energy prices and energy-saving could be done more easily than in the civil and transport sectors. Consequently, it is supposed that the original unit of energy consumption was apt to be improved with a higher rate in Japan where the rate of energy consump-tion in the industrial sector was relatively high.
Fig. 1-2-16 Analysis of Factors for Growth Rate of Energy Consumption in Basic Materials Type Industries
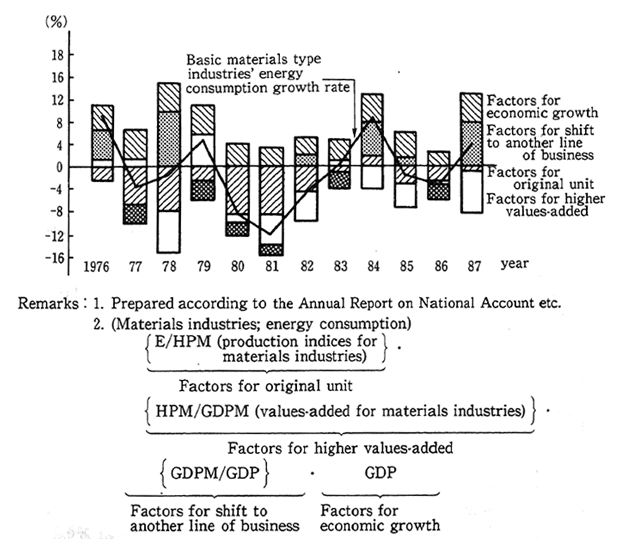
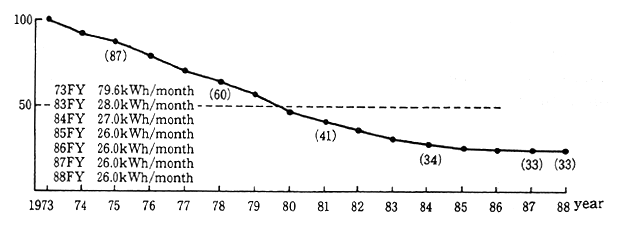
Fig. 1-2-17 Evolution of Energy Couservation by Major Equipment for People's Livelihood
(1) Freezer-refrigerators
Trends of electric power consumed by 170-liter class 2-door freezer-refrigerators a month on the average (1973 at 100; the year represents the freezing year which extends from October of the year preceding to September of the given year)
(2) Color televisions
Trends in electric power consumption by 19" and 20" televisions (1973 at 100)
(3) Room air-conditioners
Trends in electric power consumption by separate-type air-conditioners (1973 at 100)

Source: Association for Electric Home Appliances
Fig. 1-2-18 Trends in Average Fuel Consumption Efficiency of Japanese-made Passenger Cars
Source: Ministry of International Trade and Industry
(4) Rapid Rise in Energy Consumption in Recent Years
After 1979 when the second oil crisis broke out, Japan's total energy demand leveled off on the average. But it significantly increased by 5.0% in 1987 and 5.4% in 1988, and it is estimated that the demand will grow at the same rate or higher in 1989,
The prosperous marketing tone with an expansion of domestic demand and low oil prices may be considered as a major reason. As we have seen in Fig. 1-2-16, there were signs of a significant rise in the output of the type of industries which consumed much energy, and this tendency turns out to be a major cause for a rise of energy consumption in Japan as a whole. The consumption of crude oil which was on the downturn since the oil crisis had began to rise in 1986, and it might be said that hovering oil prices have significantly contributed to the latest increase in energy demand.
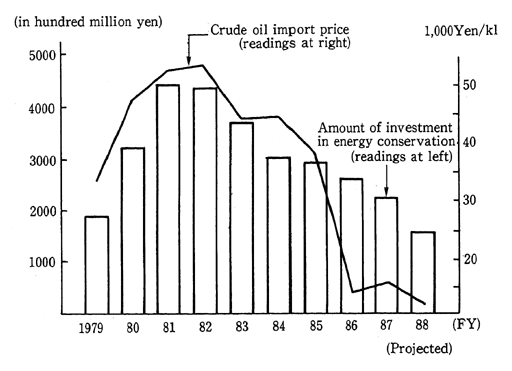
In conjunction with the prosperous tone of business, the distribu-tion of commodities is on the upswing, and energy consumption by the transport sector is also on the rise. As indicated in Fig. 1-2-19, while oil prices are hovering and investment in energy conservation efforts is at a standstill, improvements in the original unit of energy remain stag-nant. There have also been not so many improvements in the energy efficiency of household electric appliances in recent years. Those fac-tors are also important (Fig. 1-2-13, Fig. 1-2-17).
Fig. 1-2-19 Trends in Oil Prices and Energy Conservation Investments
Note: Prepared according to data from the Energy Conservation Center
In the business administration sector, energy consumption is on the upswing due to increases in floor space for office and in the use of office automation (OA) equipment. The increases in floor space add to rises in space for air-conditioning systems, whereas increases in the use of OA equipment contribute to increases in energy consumption and the heat generated from OA equipment makes additional loads on air-conditioning systems. Fig. 1-2-20 indicates the temperatures setting of air-conditioning systems in buildings. There are signs that the tempera-tures for cooling are set to a lower degree and those for heating are set to a higher degree, constituting one reason for a rise in the consumption of energy in the business sector.
In recent years, there has been a rise in the frequency of delivery to retail stores and other outlets of numerous items in small quantities, constituting a rise in the consumption of energy. In addition, the ways of life of people have changed so as to increase energy consumption. This is another factor for an increase of energy use. The average fuel cost for new types of passenger cars referred to earlier (Fig. 1-2-18) indicates that it has worsened since 1982. This is because there is a growing demand for larger and more sophisticated passenger cars, though the fuel cost has been improved for each type of passenger cars. In regard to household electric appliances, they become larger and more sophisticated, and people purchase more than one appliance in the same category and new types of appliances make their appearance one after another. Consequently, energy consumption per household increased by 30% compared with 1973. (Fig. 1-2-21).
Thus, energy consumption has increased in recent years, and there is concern that if this rapid increase continues for long, there will be increased loads on the environment.
Fig. 1-2-20 Trends in Temperature Set for Air-conditioning
Trends set in temperature set in the wintertime (heating temperature)
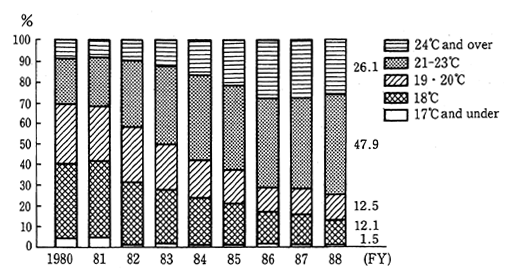
Note: For 1980 and 1981, replace "21-23 degree C" with "21-22 degree C" and "24 degree C and over "with "23 degree C and over."
Trends in energy in the summertime(cooling temperature)
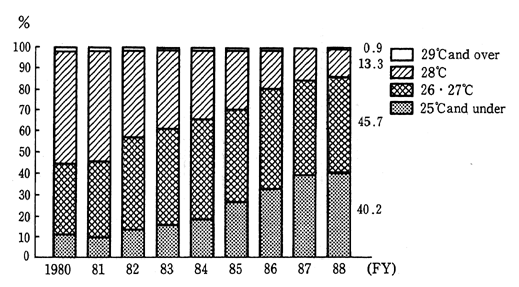
Source: Agency of Natural Resources and Energy: "Findings of the Survey on the Effective Use of Energy in 1988".
Note: The figures for 1980-85 are derived from the Survey on Actual Energy conservation by Bulk Energy Users carried out in 1980-85 (which was the predecessor to the aforementioned survey, covering the same respondents, in principle).
Fig. 1-2-21 Trends in Energy Consumption per Household a Year
1. Energy consumption per household a year increased by about 31% from 7, 317× 103Kcal to 9,615 × 103Kcal in 1973-86.
2. Had energy conservation for equipment not been carried out, 11,325 × 103 Kcal would have been consumed according computation on a trial basis, so that it may be assumed that 1,710 × 103Kcal (about 15%) was saved by energy conservatiorn for equipment.
3. If energy saving equipment had been used at the rate of equipment dissemi-nation in 1973, 7,016 × 103Kcal would have been used according to computa-tion on a trial basis, 2,600 × 103Kcal (about 27%), the balance gained from the actual figure in 1986 may be considered to have come out due to efforts to disseminate, enlarge and sophisticate equipment and also to the introduc-tion of new types (air-conditioners, dryers and electronic pots,electrical boilers, etc.)
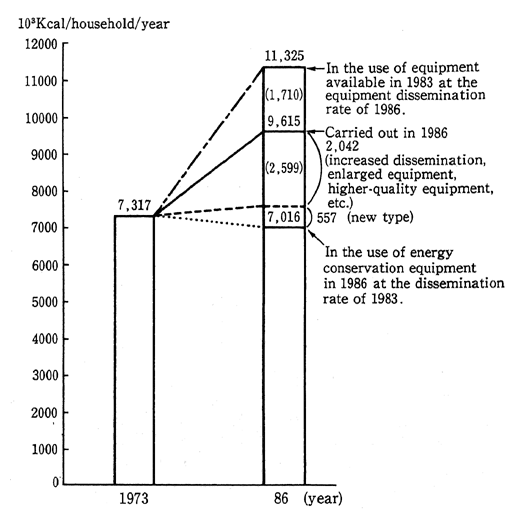
Remarks: Surveyed by the Energy Conservation Center
3. Approaches and Studies
(1) Measures Against Soot and Dust, Sulfur Oxides and Nitrogen Oxides
a. Measures Against Soot and Dust
Against soot and dust which is one of the substances responsible for suspended particulate matter and dust fallout, varied concentration controls are imposed, depending on the facility under the Air Pollution Control Law, and measures are taken against smoke and soot by removing with electric dust collectors and other equipment the soot and dust which are exhausted from chimneys. Dust collecting equipment is increasingly installed in Japan as indicated in Fig. 1-2-22, and it is projected that about 5.195 million tons, or about 98%, of about 5.29 million tons of smoke and soot potentially generated in 1986 was removed by dust collecting facilities. As a result, there have been significant improvements in regard to dust fallout. But improvements have yet to be made in respect of suspended particulate matter.
b Measures Against Sulfur Oxides
To cope with air pollution which had been serious due to the emission of sulfur oxides in 1965-74, controls were exercised on the emission of sulfur oxides under the Air Pollution Control Law. The regulations on emissions of sulfur oxides include the K-value regulation under which emissions of sulfur oxides are controlled according to the height of chimneys to bring down its effects (concentration in landing on the ground) under certain levels, and the area-wide total pollutant load control under which the total emission is controlled for each industrial plant or business establishment in areas where it would be difficult to achieve EQS only under the K-value regulation program.
Fig. 1-2-22 Changes in Installation of Dust Collecting Facilities (Processing Capacity)
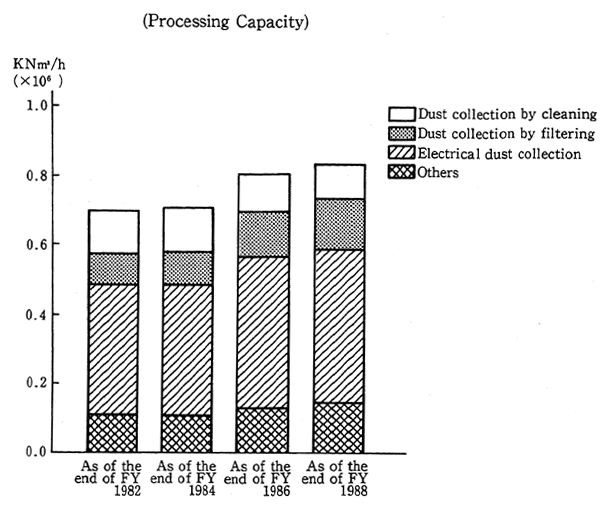
Remarks: Comprehensive Survey on Emission of Air Pollutants
There are two methods to respond to controls on sulfur oxides. First is methods by which fuels will be made less sulfuric--or methods by which heavy oils with an insignificant content of sulfur will be used by means of making imported crude oil less sulfuric and heavy-oil desulfurization, in which the content of sulfur in the heavy oils will be reduced, or the conversion of the fuels into natural gas which does not contain sulfur at all. Second is methods to remove sulfur oxides from exhaust gas in a stack gas desulfurizing system.
The K-value regulation was revised and strengthened every year from the first series of controls in 1968 to the eighth in 1976 with a view to gradually achieving EQS in regard to sulfur oxides. As a measure of the energy supply sector, planned supply of fuels containing reduced sulfur has been ensured.
As regards the area-wide total pollutant load control, a total of 24 districts were designed for this control from the first designation in 1974 to the third designation in 1976.
Emissions of sulfur oxides have significantly reduced and their concentration has improved as indicated in Fig. 1-2-23.
Fig. 1-2-23 Analysis of Emission of Sulfur Oxides and Contribution of Their Changes
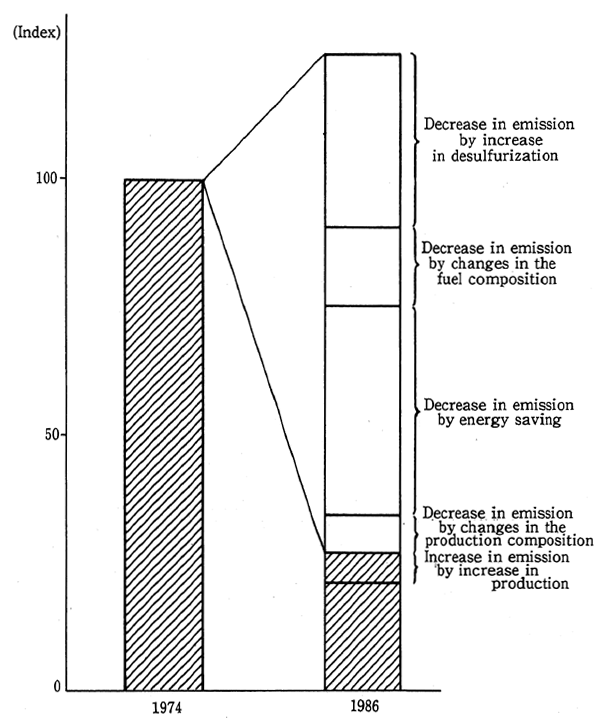
Notes: 1. Prepared by the Environment Agency
2. For the index, the emission of 1974 is set at 100.
c. Measures Against Nitrogen Oxides
The main generation sources of nitrogen oxides include station-ary sources of generation in industrial plants and establishments and automobiles.
As for industrial plants and establishments, the measures include emission controls under which the concentration of emitted gases is controlled for each generation facility under the Air Pollution Control Law, and the area-wide total pollutant load control under which the total quantity of emissions from industrial plants and establishments is controlled, depending on the district, as is the case with sulfur oxides. Since the first series of controls in 1973, the control measures have been strengthened several times.
The measures against nitrogen oxides include a reduction of the emissions of nitrogen oxides by improvements in the combustion methods and a method to remove nitrogen oxides by the installation of stack gas denitration facilities (Fig. 1-2-24). It will greatly contribute to energy saving to make reasonable the air ratio which is basic for an improvement of the combustion method. The stack gas denitration facilities are something for whose development Japan led the world, and Japan is ahead of any other country in the number of stack gas denitra-tion facilities.
Fig. 1-2-24 Trends in Emission of Nitrogen Dioxide by Source of Generation
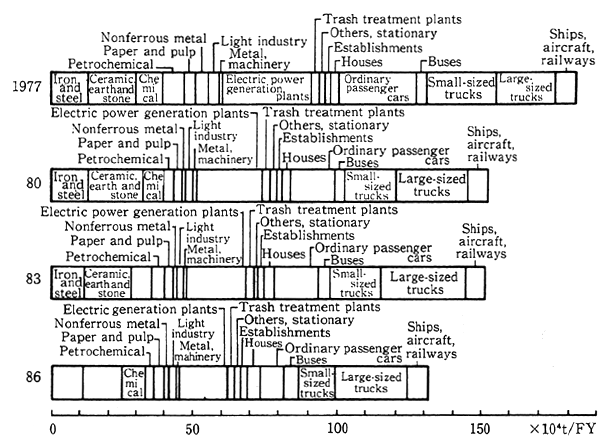
Remarks: Projected by the Institute of Behavioral Sciences
As for the nitrogen oxides exhausted from automobiles, the permissible levels are specified under the Air Pollution Control Law, and those levels in Japan are the most strict of them all in the world. The exhaust of nitrogen dioxides has to be reduced by a significant 92% (the level, introduced in 1978, which roughly corresponds to the level proposed by U. S. Senator Edmund S. Muskie), and when this level was announced for the first time, it was argued in some quarters that the aggravating fuel cost and the rising prices of automobiles would pro-duce a significant impact on the Japanese economy.
In the long run, nonetheless, technology which could simultane-ously work out measures against exhausted gases and reduce the fuel cost was developed. By so doing, it is now generally known that technol-ogies on automobiles in Japan have been significantly accumulated. This development might be described as a typical example in which the formulation of proper targets for environmental protection according to technology estimation for reductions of exhausted gases leads to yet another technological development, thus producing a favorable impact on the national economy.
Despite those efforts, the situation requires further strengthening comprehensive measures. Particularly as regards diesel-engined auto-mobiles, strict controls have thus far been exercised, but as there was the need to further strengthen emission controls for the prevention of air pollution by the gases exhausted from automobiles, the Central Council for Environmental Pollution Control recommended on December 22, 1989, the necessity of reducing exhausted gases by 30% to 60% within the next 10 years at the latest, and the government decided to strengthen controls step by step in line with this recommendation.
Even if those controls are exercised on individual automobiles, the situation is such that they will be offset to some extent by increasing the volume of automobiles. On the other hand, area-wide total pollutant load controls are exercised on the fixed sources of generation, such as industrial plants, in highly concentrated areas in addition to the regula-tions on each vehicle. In order to achieve EQS on nitrogen oxides in major cities, it is conceivable that the time has come to study the possibility of working out measures to curb the total emission of automobile gases in the whole region. On the basis of this new concept, the Environment Agency is studying measures.
The diesel-engined automobiles which use light oil as their fuel pose environmental problems, as their emission of nitrogen oxides and particulate matter is greater than that of gasoline-engined automobiles. In recent years, however, the traffic volume of diesel-engined trucks have significantly increased, and in the class in which diesel-engined trucks coexist with gasoline-engined trucks, the rate of diesel-engined trucks has increased. As for fuel consumption by trucks for two years from 1985, gasoline reduced by about 13% whereas light oil rose by 13% (consumption in 1987 stood at about 21.2 million kiloliters for light oil and about 5.6 million kiloliters for gasoline).
We can see various reasons for this, but one is that diesel-engined automobiles are more economical than gasoline-engined automobiles. For example, the engines of diesel-engined automobiles are more durable and their fuel consumption per trip kilometer is smaller. Moreover, in terms of retail prices, the cost of light oil is far lower with about ¥70 per liter on the average than gasoline which costs ¥120 or so. Table 1-2-25 shows the consumption and prices of fuels for the class in which gasoline-engined automobiles are used along with diesel-engined automobiles by taking general account of the consumption and price of fuels per trip kilometer, indicating that the fuel cost for diesel-engined automobiles is half that of gasoline-engined automobiles.
It is undeniable that those differentials and other economic fac-tors constitute one element for selecting the means of transport. Not just between types of automobiles but between automobiles, and other means of transport, such as railways or ships as well, the option differs, depending on differentials in fares and other costs in addition to other factors, such as utility. In a medium-and long-term perspective, there-fore, it is necessary to study correlations between economic factors, including differentials in fuel prices and fares, and environmental issues.
Table 1-2-25 Cost Comparison for Automobile Fuels Per Trip Kilometer (Automobile with Maximum Load of 1 Ton as Example)

Remarks: 1. For per-kilometer fuel consumption, the fuel cost for actual trips is computed according to the fuel cost for 60 km/h trips on the designated ground according to the automobile specifications of the Automobile Technology Association.
2. The fuel cost is gained by multiplying the average retail price in major cities in 1989 cited in the Economic Research Council's "The Price Edition of the Economic Research Report" by the fuel consumption cost per kilometer of trip.
(2) Reduction of Environmental Loads by Energy-Saving
For Japan which is reliant on imported crude oil for primary energy, energy saving is a means to alleviate quantitative limits on energy resources with its own efforts. Energy saving also contributes to cuts in the emissions of sulfur oxides, nitrogen oxides and other air pollutants and also to curbs on the consumption of fossil fuels, so that it turns out to be a telling means to reduce emissions of carbon dioxide and other greenhouse gases.
As for means to reduce the emission of carbon dioxide for global environment conservation, such technological development as we have achieved against sulfur oxides and nitrogen oxides has yet to be made, and as a realistic response for the time being, it is necessary to reduce the consumption of fossil fuels with improvements in the energy effi-ciency and to encourage the utilization of energy sources from which there is no or little emission of carbon dioxide.
It is generally known around the world that energy saving direct-ly contributes to cuts in the consumption of fossil fuels and is a telling means against global warming. With this in mind, let us see in the following section what Japan has experienced, how other countries have coped with this issue and what measures we can take for the future.
a. Japan's Experience in Energy-Saving
As energy saving directly leads to the saving of the fuel cost, there are conspicuous signs that energy saving has been made purely as an economic act of cost saving.
In Japan, significant efforts have been made for energy saving in the industrial, people's livelihood, transport and energy conversion sectors with the two oil crises as a turning point. Let us see below how they have been made.
Energy-saving measures at industrial plants may be classified into three phases, ranging from relatively easy ones to sophisticated ones.
1. The phase in which energy controls are improved and strength-ened and working methods and operation conditions reviewed without basically changing the processes.
2. The phase in which small investments are made to add facilities without changing the mainstay facilities and attempts made to upgrade the energy efficiency by improving some facilities.
3. The phase in which production facilities and processes of a highly efficient type are introduced by drastically changing the conventional facilities and processes.
The first phase is a stage for improvements in software. For example, it includes measures to prevent the idling of motors and the leak of steam and strengthen the control of the air ratio to ensure pertinent conditions for combustion, etc. Many of those measures are relatively unpretentious and small in scale, but the accumulation of these measures will lead to significant energy-saving effects. And the first phase is of such a nature that unless the measures in this stage are carried out to the full, investments in the second and third phases will be of no use.
The second phase includes, for example, the introduction of equipment to recover and utilize waste heat and heat storage tanks to keep heat in store instead of releasing it. It is a stage where significant improvements in the energy efficiency are expected with small invest-ments with the installation of efficient, additional facilities and the execution of renovation work.
Then third phase is a stage where efforts for technological development as well as large investments are required as the basic production system per se has to be changed. One such example in the past is a continuous founding system (an uninterrupted line of work processes) in the iron and steel industry.
Those measures are of such a nature that their effects will increase only when technical experts specializing in the control of energy at industrial plants routinely strive for the maintenance and inspection of facilities for the utilization of energy and use their ingenu-ity.
As the primary reason for Japan having become the world's most advanced energy-saving nation in the industrial sector, it might be said that those competent technical experts have been assigned to almost every industrial plant which uses much energy and they have strived to save energy. Legally, the Law Concerning Rationalization of Energy Utilization (the so-called Energy-Saving Law) enacted in 1979 obligates industrial plants to have as energy control specialists those who have been qualified in national examinations as "energy controllers" and to establish a system in which energy saving may be promoted. This system might be described as being able to serve as a model for the world in stepping up energy-saving at industrial plants.
The core of the conventional series of energy-saving measures in people's livelihood and the transport sector consists of measures for improvements in the performance of equipment and buildings, and standards for the efficiency of energy consumption are stipulated under the Energy-Saving Law for air-conditioning systems and passenger cars. The law also includes provisions for insulation standards for houses and energy-saving standards for office buildings, etc.
In the energy conversion sector centering on power generation, attempts have been made to upgrade the power generation efficiency and reduce the rate of losses in power transmission and delivery.
For the installation of energy-saving facilities, preferential tax and financial measures have been made available since fiscal 1975. Particularly since fiscal 1981, a system has been in force whereby either the amount equivalent to 7% of the payment with which a facility with high energy-saving capacity has been acquired may be especially deducted from the amount of the corporation tax, or a special 30% depreciation may be made in addition to the normal depreciation. This system has contributed to energy saving in Japan.
The development of energy-saving technologies with which a further evolution of energy saving may be sustained has been positively made with the cooperation of the industrial, people's livelihood, trans-port and energy conversion sectors. In particular, as regards the research and development of advanced, large-scale technologies which assure high energy-saving effects but cannot be done independently by private corporations due to their high development risks, the central government is doing them under what it calls the Moonlight Program with the close collaboration of the industrial community, universities and other institutions. Besides, a wide variety of technical development is done by individual businesses.
b. Energy-saving Efforts in Other Countries
A wide variety of efforts are being made in other countries to step up energy saving.
In the United States, the transport sector accounts for 35% of the nation's total energy consumption (see Fig. 1-2-10), almost all fuel consumed by that sector consisting of those for automobiles. The Corporate Average Fuel Economy (CAFE) standards are formulated to work for improvements in the fuel efficiency for automobiles. Those standards were set in 1978. Under this system, the standard value for a mileage per gallon of gasoline is determined every year and the weight-ed average value of automobiles sold by each automaker must be lower than this standard. Otherwise, a charge will be imposed, depending on the degree to the weighted average value has not been satisfied. (Under the fuel cost standards for automobiles under the Energy-Saving Law in Japan, passenger cars are divided into four categories by weight, and the weight average value of passenger cars sold by automakers must satisfy the standards.)
As regards household electric appliances, a law on standards for energy efficiency was also enacted in 1987. In addition, separate stan-dards are formulated by some states.
The Public Utility Regulatory Policy Act of 1978 (PURPA) which is designed to upgrade the energy utilization efficiency and develop and introduce renewable energy sources, stipulates that electric power supplied by small-scale power generation facilities which use cogenera-tion and which meet specific energy efficiency standards or such ren-ewable resources as biomass, solar energy and wind force, must be purchased at prices which do not exceed the cost (averted prime cost) which is required when electric power companies themselves generate electricity or purchase it from other sources.
In the U. K., subsidies are available for insulation measures in the people's livelihood sector. In the industrial sector, subsidies are avail-able for projects to demonstrate the more efficient utilization of energy by dissemination and development of new and applied technologies, for consultant services on cogeneration and heat recovery projects.
In West Germany, investments for energy saving in the industrial sector are subsidized. In the people's livelihood sector, added deprecia-tion and other measures are taken for such energy saving investments as heat pumps, solar systems and other new heating devices. Besides, electric power companies themselves have adopted a large-scale cogeneration system to supply heat in regional heating networks.
c. Studies on Measures for Reduction of Carbon Dioxide Emissions by Energy Saving
When measures to reduce carbon dioxide emissions for global environmental conservation, it is important to minimize the input of primary energy as far as possible.
In Fig. 1-2-26, the flow of energy in Japan is computed on a trial basis. Of the input, the rate of effectively utilized energy stands at a mere 35%, the remaining 65% is directly discharged in the environment as waste heat. Judging from the facts that 40% of the total input of energy at thermal power plants is converted into electric power, that about 50% of energy put into gas cookers is converted into the heat of boiled water, and that only about 20% of energy put into gasoline-engined automobiles is turned into power, with remaining energy in each case discharged in the environment as waste heat, we realize that the heat value of energy is not used to the full.
In minimizing the input of primary energy, there is the need to reduce the loss of energy by making effective use of that 65% and to minimize the absolute amount of energy which is effectively used. The following concrete measures could be carried out.
(a) Promotion of Staged Utilization of Energy
Where some energy is not utilized and discharged, it is important to promote the staged energy utilization in which heat coming from combustion may be used many times even at low temperature as well as high temperature. (Cogeneration with Environment Consideration)
Fig. 1-2-26 Flow Chart of Energy Supply and Demand in Japan (FY 1986) (The figure represents the rate to the primary energy supply of 4 × 10¹⁵ Kcal
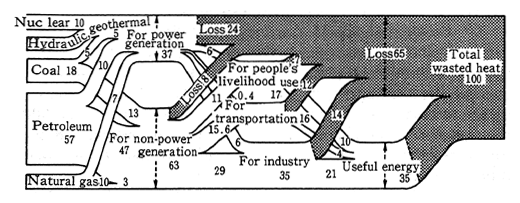
Remarks: Prepared by Prof. Masaru Hirata, University of Tokyo
Fig. 1-2-27 Example of Comparison of Co-generation and Energy Efficiency of Conventional System
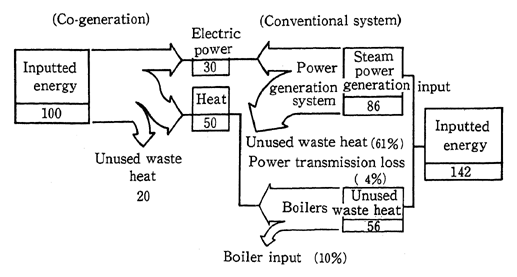
Note: The case in which electric power demand is appropriately combined with heat demand for co-generation and both are consumed to the full.
Cogeneration is a facility to make multiphasic use of energy. It takes out simultaneously motive power (used for power generation) from high-temperature heat generated in combustion, and heat from waste heat and the like in the production of motive power. Where the demand of electric power is properly coupled with that of heat, the comprehensive energy efficiency rises to 70-80%. Here, it will be pos-sible to contribute to the more efficient utilization of energy, if both electric power and heat thus obtained are consumed to the full. (Fig. 1-2-27)
The cogeneration systems can be classified as follows, according to the way of producing motive power : first, a piston internal-combustion system in which fuel is explosively burned at a high temper-ature of upwards of 1,500 degree C to move the piston with the high-temperature and high-pressure gas thus produced; secondly, a turbine system in which the turbine is revolved in succession by gases with a high temperature of about 1,100<, and thirdly, a steam turbine system in which the turbine is revolved by steam at a temperature of about 5000 C (often used by industry). The piston internal-combustion and gas turbine systems make it possible to utilize heat at higher temperatures than the steam turbine system.
On the other hand, we must take it into account that much of nitrogen oxides is generated because of such factors as the high combus-tion temperature. Particularly in the case of the piston internal-combustion system which are used as diesel or some other engine, the concentration of nitrogen oxides is exceedingly high due to its combus-tion properties. Consequently, it is necessary to formulate measures against nitrogen oxides when this system is to be put to use.
In the industrial sector, the comprehensive energy efficiency may be raised with the introduction of cogeneration at industrial plants where there is a considerable heat demand. In the people's livelihood sector, the comprehensive energy efficiency may be upgraded if there is a proper combination of heat and electric power demands from hotels, hospitals and office buildings, and so on. We could also introduce a cogeneration system to supply waste heat from electric power plants to their neighborhoods and their neighboring region.
In recent years, there has been progress in the introduction of cogeneration, and the capacity of cogeneration facilities with gas tur-bines, gas engines and diesel engines came to 1,134,000 kilowatts in the industrial sector and 148,000 kilowatts in the people's livelihood sector as of September 1989 (Japan's total electric power generation capacity stood at 185,100,000 kilowatts as of September 1989).
To minimize the whole energy loss in society, it can be an effective method to disseminate the cogeneration system which will lead to an improvement of the energy efficiency. Ongoing cogeneration, nonetheless, entails many problems, such as the difficulty of handling, instability in operation, the sharing of charges, conflict with energy policy and with conventional electric power systems, as well as the environment problems, so that there is the need to come out with systems to solve those problems and further step up technological development.
Even for cogeneration which may raise the energy efficiency of society as a whole, there are situations where different environmental loads will go up, so that as a matter of course, we need to work out a system to reduce new environmental loads and continue to cope with technical development, etc.
For the introduction of cogeneration to major cities which feature a high concentration of carbon dioxide, in particular, it is necessary to take full measures. Besides working for the dissemination of cogenera-tion with full heed paid to the regional environment conservation, there is the need to consider an expansion of facilities subject to emission controls in response to the introduction of cogeneration. (Combined-Cycle Power Generation)
The main system for thermoelectric generation at present uses steam power, or in other words, fuel is burned in the boiler, water is heated to generate steam and the steam thus produced turns a turbine, which in turn revolves a generator to generate electric power. For a higher thermal efficiency, the steam temperature must be raised, but as far as technology available today goes, the highest practical steam temperature is 566 degree C or so and the thermal efficiency of about 40% is virtually the maximum we can go to.
On the other hand, in the gas turbine system in which electric power is generated by making use of the expansive power of gas, the gas temperature at the inlet of the turbine may be raised up to 1,100 degree C, and it is possible to generate electric power in a "combined cycle" along with the generation of electric power in the steam power system, producing steam by taking advantage of the temperature of the gas emitted from the turbine. In this case, the thermal efficiency goes up to about 44%.
As the average thermal efficiency in the conventional ther-moelectric power generation system is about 37%, the generation of electric power in those systems assures an extremely high energy efficiency. In the combined-cycle system, about 100 power generators are in operation around the world at present, and its introduction has begun for some new electric power plants and other facilities in Japan. There is the need to further step up the introduction. (Drawing of Waste Heat by Heat Pumps)
In the heat pump system, high heat is generated by utilizing low-temperature waste heat, open-air temperature and other types of unused energy as heat sources and by using electric power, gas and other types of energy as energy to drive pumps. The system will greatly contribute to the efficient utilization of energy in that the regeneration of energy is greater than the input of energy. The liquefied gas utilized as a refrigerant has the nature that when it evaporates, it absorbs the peripheral heat but that when it liquefies, it releases its heat. When heating, for example, the system is such that the pressure of the refriger-ant is reduced outdoors, led to absorb the outdoor heat and evaporate and then brought the heat indoors and liquefy with added pressure to release the heat which comes out of the liquefaction. In a favorable condition, this system can gain about 3.5 times as much as the amount of energy which is used in driving the pump. On the other hand, the heat pump may respond to demand at relatively lower temperatures in the industrial sector and demand in the people's livelihood sector but is difficult to respond to demand at high temperatures in the industrial sector due to a lack of pertinent thermal media and other factors.
The supply of heat by heat pumps leads to an improvement of the energy efficiency and it is necessary to promote it. In particular, the efficiency is extremely high and the encouragement of the introduction is highly desirable when there are such unused energy sources as the heat of river water, sewerage, sewer treatment water and the waste heat from waste incineration plants, subways, power transmission lines and sewer treatment plants, etc.
(b) Utilization of Waste Energy from Industrial Plants in Society
In-house energy-saving measures are considerably advanced at industrial plants in Japan which make much use of energy, but there is much energy which is discharged without being used effectively. Fig. 1-2-28 provides one example of waste heat from the iron works of some steelmaker which do the continuous operation of pig iron and steel production with blast furnaces. Sixty-four percent of energy is effective-ly used but the remaining 34% discharged as waste heat. Besides, the temperature of some waste energy is as high as 1,500 degree C In the cement industry, too, about 20% of inputted energy is discharged. Though some of this energy cannot be used for physical reasons, but for many types of energy, there is room for a higher efficiency of energy in society as a whole, as well as the efficiency of energy in the industrial sector. Consequently, it is important to promote their utilization.
Fig. 1-2-28 Example of the State of Waste Heat in Iron and Steel Industry
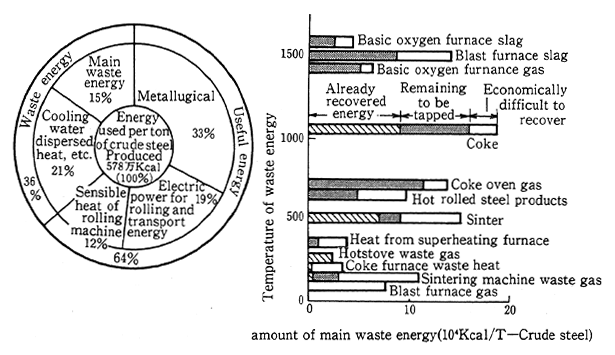
Remarks: One example of waste heat from the iron works of some steelmaker which do the continuous operation of pig iron and steel production with blast furnaces.
In areas outside industrial plants, we can also use waste energy coming out of the industrial plants, as heat and electric power after conversion. For use as heat, there is the need to lay new pipelines so that its utilization is confined to nearby places in terms of cost. On the other hand, when it is sold as electric power, power generation plants which use some of waste energy are already constructed jointly with general electric enterprise companies, and part of the electric power thus generated is sold to them.
(c) Utilization of Unused Energy in Cities
In the cities, there exists a wide variety of unused energy. The National Institute for Research Advancement (NIRA) projects in a trial computation that waste heat from sewer treatment plants, waste incin-eration plants, subways and underground cables for electric power transmission, etc, in Tokyo's 23 wards amounts to 19 million calory-liters a year in terms of oil, which is equivalent to 83% of the demand of hot water supply and heat for heating purposes by apartments and general buildings in Tokyo's 23 wards, and that about 50% of this demand can be supplied by utilizing this waste heat.
Eighty-nine industrial plants across the nation generate electric power by utilizing waste heat from waste incineration plants, and the total electric power generation capacity reached about 254,000 kilo-watts as of January 1987. Of them, 11 waste incineration plants in Tokyo are capable of generating about 56,000 kilowatts. They generat-ed about 370 million kilowatts an hour in fiscal 1988, of which 52%, or about 190 million kilowatts an hour was sold to those in the electric enterprise company (Table 1-2-29). The sales of electricity in this way is done across the nation.
Waste heat from Tokyo's waste incineration plants is also used as the heat source for regional heating systems and other purposes. It is hoped that this sort of approach be applied elsewhere in the nation.
In addition, energy with few differentials in temperature from the open air like unused energy in the cities, such as waste heat from sewer treatment plants and subways can be effectively utilized by heat pumps and by regional heating systems, as we have seen earlier.
Table 1-2-29 Actual Power Generation with heat from incineration process of wastes in Tokyo
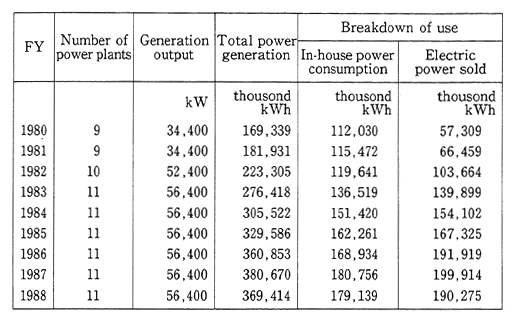
Notes : 1. The number of power plants and power output is as the end of fiscal year.
2. Total power generation, the breakdown of use and the amount of electric power sold represent actual figures for the period extending from April to March of the year following.
(d) Dissemination of Existing Technologies
The existing energy-saving technologies include technologies to minimize the loss of energy, as is the case with the technologies of recovering waste heat, and technologies to produce identical items with the less consumption of energy.
When it comes to energy-saving technologies, Japanese industrial plants have considerably advanced in the world, as we have seen earlier, but the fact remains that energy-saving measures are not being im-plemented to the full by smaller businesses. In a survey on the use of energy by smaller businesses, the Energy-Saving Center, a Japanese foundation, reports that even at present there is room for fully cost-effective energy-saving measures at about 70% of industrial plants, and it is important to promote the saving of energy by a dissemination of existing energy-saving technologies. It is yet another important task for the saving of energy to promote insulation measures and encourage the construction of buildings with a better energy efficiency in place of the existing ones.
(e) Measures in the Transport Sector Including Improvement of Transport Sector
From the point of the energy efficiency, railways and other mass transport systems are better than automobiles. Then in cases in the cities, heavy traffic congestion hinders some of the essential functions of automobiles, and it is supposed that traffic congestion leads to considerable rises in energy consumption.
Given those situations, there are calls for energy-efficient trans-port systems with the utilization of mass transport facilities both for improvements in the energy efficiency and for a reduction of nitrogen dioxides. For example, there is the need of further measures for passen-ger transport, such as promoting the use of means of public transporta-tion, and measures for cargo transport, such as improvement of trans-port efficiency, for example, by joint bulk transport.
It is also needed to take measures for promoting new technol-ogies with a higher energy efficiency, such as the further development and dissemination of electric automobiles and other means of transport.
(f) Introduction of Social System Which Contributes to Reduce Emission of Carbon Dioxide
The daylight time saving system is designed to make effective use of the daylight time by putting the hands of clocks forward to a specified extent from the standard time in the summertime when the daytime is longer. This system, making it possible to save energy, such as for lighting, is adopted in all member countries of the Organization for Economic Cooperation and Development (OECD)--except for Japan and Iceland--and China and other countries. The system was adopted in Japan from 1948 to 1951. At the second oil crisis, it was discussed to readopt the system, but because of the people's objection, etc., the government gave up the readoption.
Nonetheless, since the system has such merits as saving energy for light and air-conditioning systems and an effective use of free time, there is the need to study its readoption. As the adoption of successive holidays at the level of each industrial plant or establishment, where possible, and promotion of the two-holidays-a-week system would con-tribute to reductions in the emissions of carbon dioxide, it is necessary to step them up. Thus, it is important to change the social system in a manner which will contribute to reductions in the emissions of carbon dioxide.
(g) Reduction of Carbon Dioxide Emissions at Level of Individuals' Action
It is indispensable for a reduction of carbon dioxide to control energy demand through effective energy use by individuals. Excessive cooling and heating leads to a wasteful use of energy and in some cases go beyond the comfortableness to bring about adverse impacts on health. First, there is the need to stop this practice. Energy saving by putting off unnecessary lights which is based on a moderate posture for humans and energy saving with the skillful use of energy equipment are also required.
It will lead to a significant degree of energy saving in society as a whole if each person constantly pays heed to energy saving in the daily life. For example, it is projected that if the temperature of heating systems is lowered by one PC, about 20 liters of oil per household and 800,000 kiloliters for the whole of Japan may be saved a year (Table1-2-30). It is necessary to change our life-style into an environmentally sound one.
Table 1-2-30 Volume of Energy Saving by Each Individual's Consideration
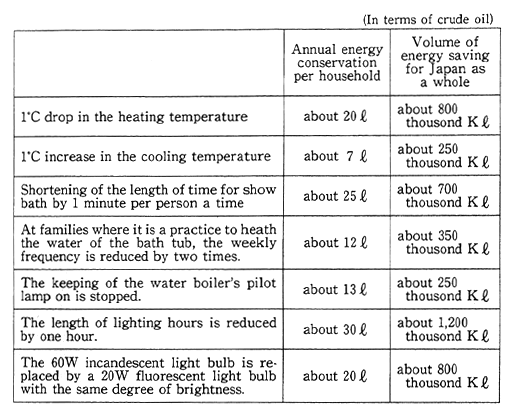
Remarks : Data from Committee for Resources and Energy-Saving conservation
It is also important for households to adopt systems which will contribute to reductions in the emissions of carbon dioxides, such as insulation measures for houses, hot water supply and heating systems using solar heat, and hot water supply and air-conditioning systems which would use heat pumps with multiple functions.
Moreover, in addition to the measures we have seen earlier against pollution and for the promotion of energy-saving, new types of energy with less environmental loads are being developed and adopted, and we will mention those measures in the next section.
4. Working for Shift to Environment Conserving Type Energy Use
As we have already seen, there are close correlations between environmental problems and energy use . It is necessary to use energy with consideration for environmental protection.
(1) Building Energy-Saving Type Society
From a perspective of environmental protection, it is necessary for our ways of energy to use drastically strengthen energy saving which will contribute in many aspects to environment protection and to convert society as a whole into an energy-saving type.
Above all, increasingly high hopes are pinned around the world on energy saving as a means to cope with global warming. Given those expectations, it is necessary that energy saving in the future should be based on a standpoint of reducing loads on the global environment and that further efforts should be exerted in a broader perspective instead of being swayed by the conventional paradigms.
In promoting energy saving in the future, there is the need to reduce energy losses which have been referred to in the previous section and to make our activities so as to use less energy than now.
The first important thing is not only to introduce energy-saving equipment and technology but to positively step up energy-saving measures as systems. For this, it is necessary, first, to establish efficient systems of energy supply and demand by promoting the introduction of cogeneration, combined-cycle power generation and heat pumps, etc., after solving the problems raised earlier, and, secondly, to promote the use of waste energy, from industrial plants and cities by community. Then there is the need to make studies on measures to promote energy saving, such as by the introduction of the daylight saving time.
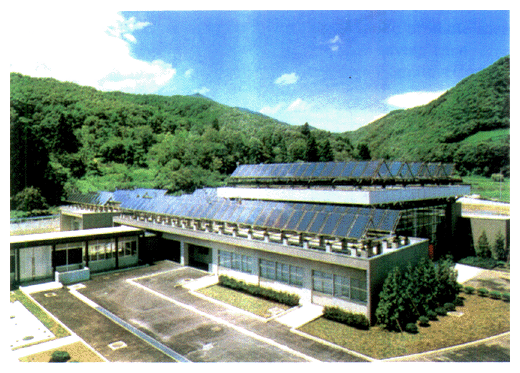
A solar-heated hot water supply system is an example of harnessing natural energy.
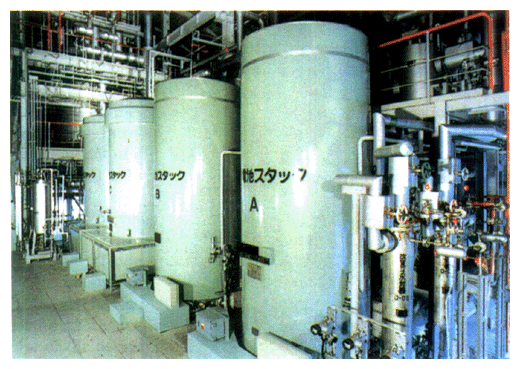
An effective use of energy also obtained through an experi-mental fuel cell.
The great camphor tree grown in Gamo Town, Kagoshima Prefectrue, is said to be the big-gest tree in Japan.

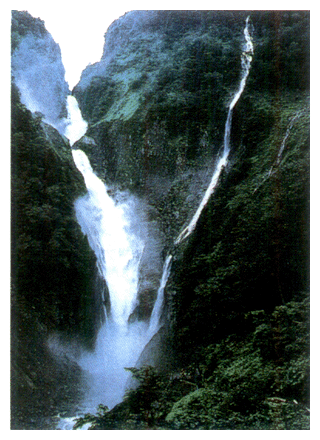
Shomyo Falls have been preserved on the Shomyo River in Toyama Prefecture.
The second important thing is to further promote efforts for improvements in the energy efficiency of automobiles and household electric appliances and for energy saving in the production process--the efforts that have been made in the past--and to step up improvements of the energy management in buildings, such as insulation measures in buildings. For this, it is necessary to energetically implement measures for their promotion, including preferential financial and tax measures for the best-available energy-saving measures.
The third important thing is to enhance the consciousness of each one of the people about the need of effective use of energy. Unless energy is efficiently used in its final phase of consumption, the effects of efforts to make efficient use of social systems and individual devices will be reduced by half, and only when the people's consciousness is enhanced, it will be possible to step up the efficient use of social systems and individual devices. For this, it is necessary to appreciably strengthen enhancement in the various sectors of the people on the state of the environment and energy and on the efforts each family can make to save energy.
(2) Promotion of Energy with Less Environmental Loads
Along with energy saving, it is yet another important task to promote the utilization of energy sources with less loads on the environ-ment, such as carbon dioxide and sulfur oxides.
Among all the fossil fuels, natural gas is the cleanest of them all, and the proper introduction of natural gas is desirable. For example, when the amount of carbon dioxide emission per unit heat production of coal is supposed to be 10, that of oil is about 8, and that of natural gas is about 6.
Nuclear power already accounts for about 30% of Japan's total electric power generation and is the most advanced of all non-fossil fuels in terms of practical use.
The importance of nuclear power was internationally acknowled-ged at the Arche Summit as an alternative energy source which would contribute to reductions in the emissions of carbon dioxide on the premise of the assurance of its safety.
The methods to use solar energy, a clean source of energy, consist of the use as an electric energy source and the use as a source of heat. In the former, the energy of light is converted into electric energy through the solar power generation. As things now stand, the solar power generation costs more than the conventional electric power generation system, but the solar power generation makes it possible to produce electric power from a source of energy which is available anywhere on the earth. For reducing environmental loads, its introduc-tion is being rapidly accelerated in Switzerland and other European countries.
The solar power generation can be done only during the daytime, and for its use during the nighttime, it must be accumulated but the storage batteries are expensive. It is necessary to develop technologies associated with system ties, cost reductions and the longer lived storage batteries. The systems which use solar heat include the solar water heater system in which the hot water heated by the sunlight is put to use. With the second oil crisis as a turning point, the utilization of the solar water heater system in Japan developed at a fast pace, but as oil prices hovered low later, it has reduced in recent years. It is necessary to replenish and strengthen measures for its further dissemination.
In addition to solar energy, the new sources of energy include wind energy, oceanic energy and energy for whose production the technology of using the photosynthesis of organisms is put to use, which do not generate carbon dioxide, sulfur dioxides, nitrogen oxides, dust and the like. Hopes are pinned on their development and dissemination.
(3) Further Promotion of Pollution Control Measures
To say the least of nitrogen oxide pollution problems in the large cities, there are many environmental problems concerning the energy use, which affects our daily lives and have to be improved.
In particular, to solve the air pollution problems caused by nitrogen oxides, it is necessary and indispensable to reduce emissions of nitrogen oxides, and there is the need to strengthen measures, such as more strict controls on exhaust gas well-balanced with gasoline-engined automobiles on which strict controls are exercised, the encouragement of a shift to automobiles satisfying the latest regulations, the strengthen-ing mass transport system, and the formation of joint delivery systems. Moreover, it is necessary to step up studies on the feasibility of for-mulating measures to control the total amount of exhaust gas from automobiles in the region as a whole in the major cities, and to gradu-ally translate them into action while working for the community's consensus.
There is also the need to strictly implement the measures against sulfur oxides, smoke and soot and the like which are closely tied in with the energy use.
(4) Promotion of Technology Development
In addition to the further nationwide dissemination of energy-saving and other technologies which will contribute to environmental protection, it is an extremely important task in a medium-and long-term perspective to integrate and harmonize man's activity with nature' s enormous cycle by promoting the development of new technologies, such as sophisticated energy-saving technology, new technology, the technology of recovering and fixing carbon dioxides and that of building social systems of an environment-conserving type.
For the time being, expectations are put on the further develop-ment of technologies concerning the cogeneration system with fuel batteries, whose commercialization is just around the corner, and con-cerning reductions of the cost of solar power generation. Cogeneration with fuel batteries is designed to combine in the electrolytic bath hydrogen and oxygen (air is used in normal circumstances) which are gained by changing natural gas, to use the electric power gained from the move of electron at the reactor and at the same time to use the heat of the reaction.
The development and dissemination of automobiles with less pollution is also an urgent task. Electric automobiles do not emit air pollutants and cause little noise during their trips. In all aspects includ-ing the phase of their electric power generation, they may be described as automobiles with less environmental loads. To further disseminate electric automobiles, there is the need for the further development of technologies, such as improving the mileage of the trip per charge with the development of high-performance batteries.
Methanol-fueled automobiles emit little black smoke, and their emission of nitrogen oxides is about half that of diesel-engined automo-biles because of their use of catalysts. In order to further disseminate them, it is necessary to develop engines which fit methanol to enhance their reliability. In recent years, attention has been focused on com-pressed natural gas (CNG) cars. CNG cars absolutely do not emit black smoke, and some estimate indicates that their emission of nitrogen oxides and carbon monoxide is about half that of gasoline-engined cars and that their emission of carbon dioxide is about 20% less.
In light of CNG cars contribution to environment improvement, there is the need for technological development for reductions in their weight and increases in their mileage per charge. It is also necessary to positively carry out researches and developments on solar and other cars with less pollution and little energy consumption.
In one aspect, the development of technologies on cars with less pollution is encouraged in conjunction with an expansion of their use. Therefore, it is necessary to concurrently make positive efforts for the dissemination of their use while taking advantage of the characteristics of respective cars with less pollution.
For environment conservation in conjunction with the develop-ment and dissemination of technologies, there is the need to ensure that technical responses to specific problems on the environment will not lead to the change for the worse of other environment issues.
(5) International Technology Transfer
The dissemination of advanced Japanese technologies to foreign countries--particularly, developing countries--for environment protec-tion and the saving of energy is extremely effective both in terms of conservation of the global environment, including the prevention of global warming, and of support to efforts to conserve the regional environment in those countries.
Above all, the transfer of energy-saving technologies to develop-ing countries is meaningful not just in terms of environmental protec-tion but in other aspects as well.
In other words, as it is expected that the demand of energy sharply rises in developing countries in the future, the promotion of energy-saving in developing countries will not only contribute to envi-ronment protection, such as great contributions to a reduction of carbon dioxide emissions, but also significantly strengthen the basis of the energy system in the given countries but stabilize the world's energy supply and demand as a whole. Moreover, the promotion of energy saving in the industrial sector of developing countries will produce a wide variety of merits to industrial plants which carry out energy-saving measures, such as a reduction of the energy cost and the stabili-zation of products in conjunction with the control of energy, and eventu-ally form the basis for, those countries' sound economic development.
For promotion of energy-saving measures in developing coun-tries, the technical cooperation of Japan which has many fully experi-enced experts is extremely effective, and it is necessary that Japan should play its international role with the promotion of technical coop-eration in the energy-saving sector.
It will also greatly contribute to environment protection in those countries to transfer to them energy use technologies contributing to environment protection and pollution control technologies associated with the energy use. In general terms, the introduction of technologies for environment protection and the like can hardly be carried out smoothly in some aspects, such as a direct rise in the production cost of individual plants, there is a need to study the better way of technical assistance, while stepping up the development and transfer of appropri-ate and less costly technologies suited for the present situation of developing countries.
III. Forest Resources and Environment
1. Diversified Values of Forests and Issues on Development and Utilization
For the earth which could well be described as a living thing, the role played by forests is indeed significant. Along with the oceans, the forests constitute an important component of the global ecosystem as a pivot for the circulation of matter and energy. There is concern that the extinction of massive forests, let along tropical forests, distorts the global circulation system which has been formed on the basis of a delicate balance and brings about irreparable impacts on our society by means of climate extremes and other phenomena.
The biological world which has been assiduously built in the evolution process ever since life came out on the globe is now of an intricate and subtle structure which embraces five million to upwards of 10 million species. When we take account of tropical rain forests inhab-ited by about half of them alone, we realize that disorderly acts for development are a grave challenge to the biological world.
It is necessary for all mankind to note that as it is done at too faster a pace than accumulation, extinction produces impacts on the global ecosystems, and it is necessary to seriously see to it that we may not deter the usability of forests in the next generation as places for health and recreation as well as sources of lumber and energy resources and places for the production of food, medicines and the like.
Many of the human beings have lived along with forests. The forests not only have been places for the supply of resources but have provided us with clean water and protected us from disasters. Like Europeans among whom forests are considered the mother of culture, the Japanese people have also enhanced their lives and fostered their culture in communion with forests, as is discernible from the words "culture of laurel forests" and "culture of Japanese beech belts." There is a mounting desire to have places for peace of mind in the forests, departing from an abundance of things.
(1) Diversified Values of Forests
a. Forests as Sources of Life for the Earth
Forests, accounting for 90% of plant biomass on the land, symbol-ize the "green of the earth." Plants which have chlorophyll creates organic matter in photosynthesis and generates oxygen. The life of plants is made up of organic matter thus created. Animals and many organisms sustain their lives, depending, directly or indirectly, on the production of organic matter by plants.
The existence of forests produces a significant impact on the heat balance and that of water on the earth. It is also closely tied in with the circulation of carbons on the globe. In a typical projection, plants and soil on the earth fix about 2.2 trillion tons of carbon, or three times as much as in the atmosphere. Changes in the forest biomass affect the concentration of carbon dioxide in the atmosphere, eventually holding sway over heat available in the atmosphere and the temperature. In enabling the earth to sustain an environment suitable for the habitation of organisms, the forests play an indispensable role.
b. Functions for Production of Lumber and Others
Lumber is produced from forests, used as materials for houses and other buildings and also for furniture. It is also used for the production of paper and cardboard. Particularly in Africa, Southeast Asia and other areas which export tropical lumber, the exports of lumber are a principal means to acquire hard currency. In Indonesia, for example, they account for 15% of all exports.
In developing countries, forests are also an important energy supply source. According to a projection of the Food and Agricultural Organization (FAO), firewood and charcoal account for 60% of all energy consumed in African developing countries, a little less than 20% in Asian developing countries and a little less than 10% in Latin American developing countries. In the least developed countries, the ratio exceeds 90%.
Moreover, the economic values of forest products other than lumber are sometimes considered as high as or higher than those of lumber products for regional economies. The main items include wild life in Africa, rattan and bamboos in Asian countries and fruits and nuts in Latin America.
c. Habitats of Wild Life
With abundant flora, forests offer habitats for various mammals, birds and insects, and those inhabitants form an ecosystem, while keeping intricate ties with one another. In particular, the tropical rain forests, called the treasure-house of biological species, offer habitats to half of all biological species on the globe, though they account for a mere 7% or so of the world's land surface. It is difficult to evaluate the values of so wide a variety of species, but as far as their values only as medicines are concerned, upwards of 40% of all medicines in the United States are made of wild life and it is evaluated that they produce commercial values worth $40 billion a year.
d. Functions for Conservation of Water Resources and Prevention of Disasters in the Mountains
Forests lead precipitation to permeate underground, pace down its flow into rivers and balance the quantity of riparian water. Fig. 1-3-1 represents a comparison of the courses followed by precipitation between forests and bare land. Of the rainfall on forests, about 25% immediately flows out of the surface and about 35% is deposited underground and later flows out step by step, whereas it is said that 55% of the rainfall on the bare land immediately falls out of the surface and about 5% or so is deposited underground. The roots of forest trees tighten soil, preventing earth and rocks from giving way. Besides, forests prevent damage from droughts and also from winds and flying sand.
Fig. 1-3-1 Comparison of Precipitation Distribution Between Forest and Bare Lands
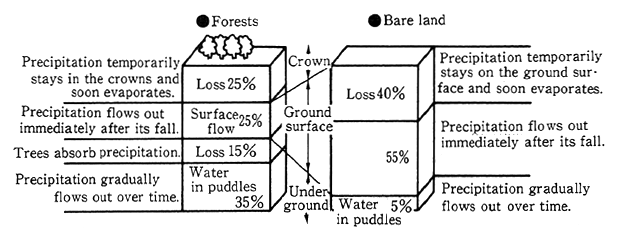
Remarks : "Forests and Water Resources" edited by the Japan Forestry Industry Association.
e. Functions for Climatic Alleviation
In forests, moderate climate conditions with a small range is produced with the day's highest temperature registered low and the lowest temperature marked high (Fig. 1-3-2). The difference in range between the forests and the bare land is said to be 2-3 degree C, but it is sometimes observed that it reaches nearly 10 As forests are equipped with transpiring functions, a large amount of evaporation heat is con-sumed, preventing a rise in the temperature of the surface. Besides, forests adjust the humidity and protects farmland and dwellings from wind damage.
Fig. 1-3-2 Daily Temperature Fluctuations in and Around Machilus Thunbergii Forest
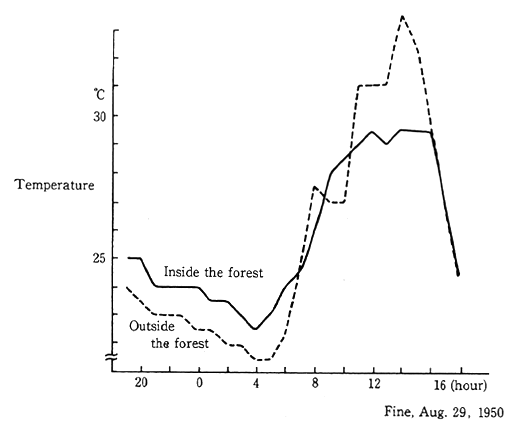
f. Absorption of Atmospheric Pollutants
Forests and trees are equipped to absorb sulfur oxides, nitrous oxides and other air pollution. It is computed on a trialbasis that a camphor tree (25 centimeters in diameter at the chest height and 7.5 meters in tree height), for example, absorbs about 130 grams of sulfur dioxide and about 160 grams of nitrous dioxide.
g. Functions to Sweeten Life
The tuttelly shrines dedicated to tutelary deities are conserved as they are for religious reasons even though urbanization is in progress. Those woods serve as children's playgrounds and places where people get together for festivals, fostering the consciousness of locals about their communities.
For another thing, forests are equipped to sweeten people's lives and provide visitors with peace of mind. They can also offer places for people to come in communion with nature and feel at ease. They are also important as places of recreation, such as mountaineering and hiking, where people hold communion with nature. Those expectations will become all the higher as there are signs that the people attach importance to broad-mindedness and leisure in their lives.
(2) Questions Arising From Depletion of Forest Resources
The forests are extremely important resources which provide immeasurable blessings to our lives. Nonetheless, should they be im-properly utilized without taking full account of their irreparable values, there will be significant losses.
a. Impacts on Wild Life
One theory goes that about 3-9 million species of fauna and flora inhabit and grow in the tropical forests, but only 600,000 species or so have up to now been identified. In the ecosystem of tropical forests, close but fragile relations are formed between biological species and between the species of fauna and flora and the non-biological environ-ment, so that even the depletion of forests small in area and the extinction of one species tend to lead to the extinction of many species.
Fig. 1-3-3 Simulated Diagram of Changes in Kinds and Numbers of Medium and Small Mammals by Deforestation
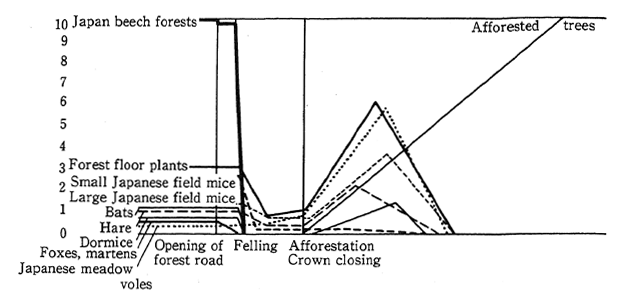
Remarks : "Forests and Trees as Biological Resources" edited by the Forestry Agency
In the present situation where the utility of a mere 1% of all biological species inhabiting tropical forests is being surveyed, tens of thousands of species and their genes cease to inhabit the globe without full studies on them because of a rapid decrease in tropical forests.
It is surmised in Japan, too, that the wholesale felling of forest trees, as was done in the past, would probably produce a significant impact on the habitation of animals. Fig. 1-3-3 represents a typical diagram which shows how the numbers of mammals will change in terms of population and species, when Japanese beech forests large in area were felled down en bloc and the areas thus deforested were replanted with sugi (Japanese cedars), hinoki (Japanese cypresses) and other coniferous trees.
There are species which flee with the construction of woodland paths and deforestation started for one business project or another but whose population temporarily increases later as they adapt themselves to the environment of the areas thus deforested, including secondary afforestation, but it may be conjectured that the species which are fully sylvan and cannot live without big trees (dormice and bats) will sustain damage.
b. Decrease in the Function to Fix Carbon Dioxide
There is concern that the depletion of forests as an enormous source to absorb carbon dioxide might result in increasing its concentra-tion and accelerate global warming. When it comes to tropical forests the significant decrease of which is at issue, it follows that should they be sound and healthy and in a phase of growth, the decrease of 10 million hectares of tropical forests represents a drop of about 80 million tons in the absorption of carbon dioxide, as its absorption per hectare of forest is 7-9 tons a year (in terms of carbons).
Besides, the decrease of forests gives rise to the oxidation of carbons which are contained in and under their trees and further to their emission into the atmosphere. There are a number of projections on emissions of carbons arising out of the reduction of forests. It has recently been thought that the emissions are in the neighborhood of 1.6 billion tons a year. This value corresponds to about 30% of the emission of carbon dioxide from man's use of fossil fuels. Table 1-3-4 represents a comparison of the net flux from tropical forests in several major countries, suggesting that tropical areas in Latin America, Southeast Asia and other regions account for the bulk.
Table 1-3-4 Projected Net Flux of Carbon front Tropical Forests (1980)
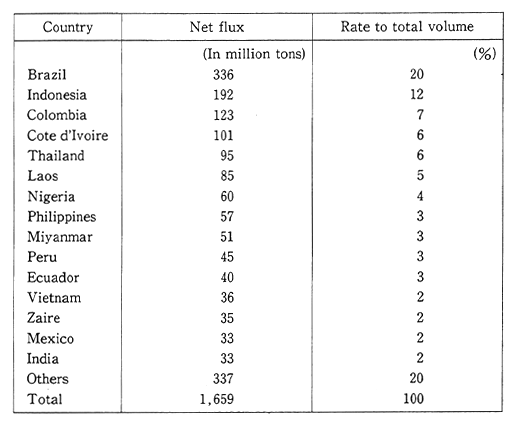
Remarks : 1. R.A. Houghton et a. "The Flux of Carbon from Terrestrial Ecosystems to the Atmosphere in 1989 Due to Changes in Land Use: Geographic Distribution of the Global F1ux." Tellus, February/April 1987.
c. Outbreak of Landslides, Floods and Other Disasters
The flood that occurred in the southern part of Thailand in November 1988 inflicted serious damage on people's lives, industrial activity and natural ecosystems. According to a report from the fact-finding team of the Economic and Social Commission for Asia and the Pacific (ESCAP), torrential rains over four days inflicted damage on more than 50,000 households, upwards of 1,000 roads and over 300 bridges. In the province of Surat Thani which sustained the heaviest degree of damage, 36,000 hectares, or 38% of all land under cultivation, was damaged.
Presumably, the primary reason for such enormous damage, let alone the magnitude of the precipitation, was the depletion of forests on the slopes. In the southern part of Thailand, the area of forests which had accounted for 42% of the area 25years ago dropped to 22% in 1985. The grave disaster is believed to have been caused as the torrential rains that had fallen on the deforested areas flowed out in a single spell, instead of being absorbed into the soil, and swept away the soil of the slopes where vegetation had been lost.
The rapid depletion of forests along the upper reaches of the Ganges is responsible for the occurrence of floods in India and Bang-ladesh almost every year, causing heavy damage.
d. Depletion of Lumber Resources in Developing Countries
Forest resources form the basis of life in developing countries and also serve as a precious source for the acquisition of hard currency for their future development. But the area of newly developed forests is a mere one-tenth that of forests which are decreased for various objec-tives, and some developing countries not only are unable to produce export lumber and its products but cannot meet their own domestic demand as well (Fig. 1-3-5).
It is projected that population with a shortage of firewood which stood at 1.3 billion in 1980 will double to 2.7 billion by 2000 (Fig. 1-3-6). In the developing world, there were 33 countries engaged in the net exports of forestry products, but unless pertinent forestry management and investments in an expansion of planted forests are sustained, it is projected that the number of those countries will drop to 10 by the end of this century.
Fig. 1-3-5 Forest Depletion and Changes in Timber Trade in Thailand
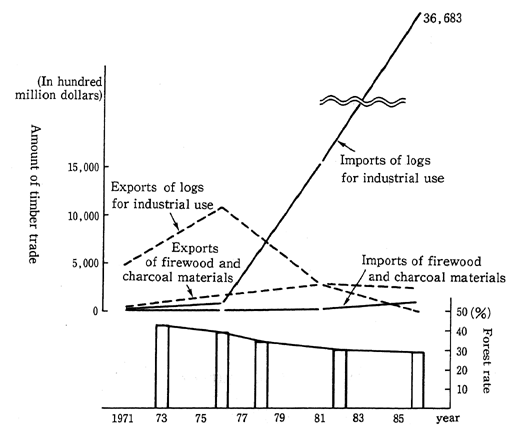
Remarks: Prepared on the basis of FAO "Forestry Product Yearbook"; UNESCAP "ESCAP Technical Assistance to the Flood Affected Area in Southern Thailand".
Fig. 1-3-6 Population with a shortage of Firewood
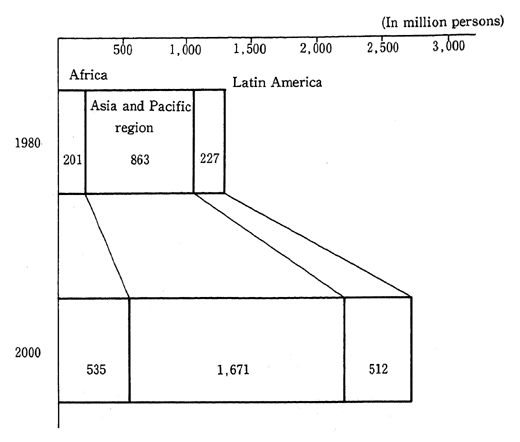
Remarks: FAO uNATURAL FOREST RESOURCEv
2. Japan's Ties with Forest Resources
As against Western Europe's "culture of rocks," Japan's is known as the "culture of wood," indicating that the Japanese people have lined in wooden houses from old, cherishing wooden furniture and dinnerwar-e. Thickets of assorted trees in the neighborhood served for the supply of firewood and charcoal and provided fruits and nuts, mushrooms and edible wild plants, among others, and fallen leaves were used as precious compost for paddy and upland fields, are closely tied in with our everyday lives. The scenic beauty of forests influenced Japan's paintings and literature, whereas the tutelary shrines and big trees were religious-ly revered. Thus, forests may be described as having constituted the undercurrent of the Japanese culture.
Nonetheless, rapid modernization and urbanization since the Meiji Era have increasingly alienated ties between our everyday lives and the forests. Fuels changed from firewood and charcoal to coal and further to oil, and it has become a practice to spray chemical fertilizer on paddy and upland fields. And children have few opportunities to hold communion with forests and water in their proximity, having been brought up in cities with asphalt and cement structures all over.
On the other hand, Japan remains a prominent forest country in the world in terms of the rate of forests. Even today, it is outstanding in the massive consumption of lumber. Nonetheless, there are many cases in which people lead their consumer lives without familiarity with, and concerns about, forests from which lumber is produced, and actually live in areas detached from forests, potentially attached though they are to forests and trees as they were in the past.
(1) Japan's Lumber Consumption at Present
Japan's lumber consumption stood at 110 million m3 a year in 1988 in terms of logs, or a little less than 1 m3 person.
The rate of wooden houses to all types of dwellings has gradually decreased, but even in 1983, it stood at upwards of 70%. In a compari-son of major developed countries in terms of the consumption of sawn wood, Japan comes after the United States and the Soviet Union. Per capita consumption is smaller than in North America and Northern Europe but larger than in West European nations. Plywood consumption as a whole is great in the United States and Japan, whereas per capita consumption is by far greater in the United States, Canada and Japan (Fig. 1-3-7).
In the consumption of paper and cardboard, Japan is the world's No.2 country following the United States, whereas in terms of per capita consumption, Japan is on a par with West European nations (Fig. 1-3-8).
Lumber demand rapidly rose from 1955 to 1965 primarily as building materials and paper and pulp resources, but there were signs of a drop with 1973 as a peak. In recent years, demand has increased, albeit at a moderate pace, in large measure for pulp and plywood. As a whole, there have been signs of an upturn since 1982 (Fig. 1-3-9).
Fig. 1-3-7 Country-specific Comparison of Timber Consumption
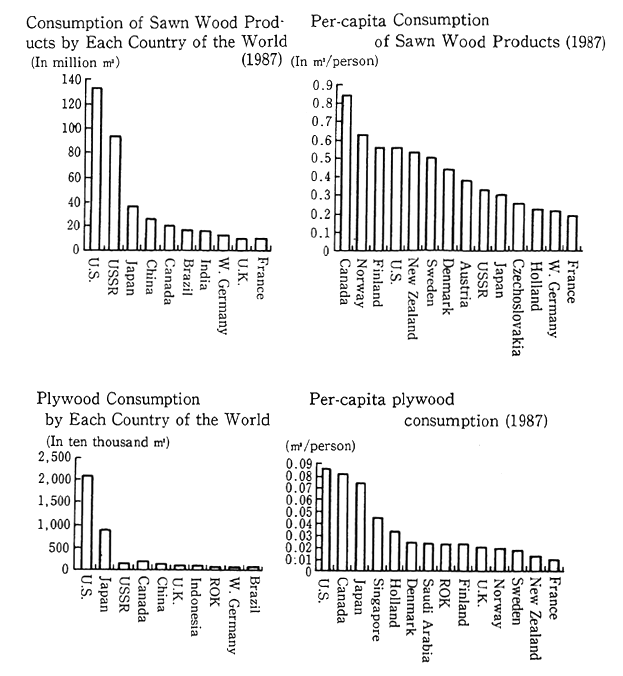
Remarks: 1. FAO "Forestry Production Satistical Yearbook".
2. Consumption is computed by the equation of output+imports-exports.
Fig. 1-3-8 Consumption of Paper and Cardboard by Each Country of the World
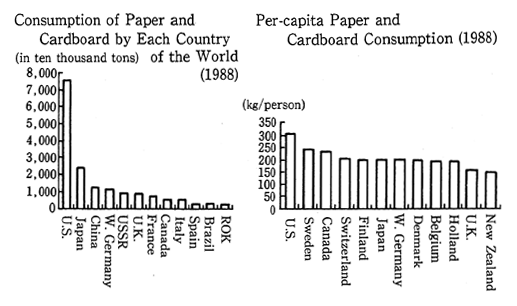
Remarks:1. Prepared according to "Pulp and Paper International 1989".
2. Consumption is computed by the equation of output + imports -exports.
Fig. 1-3-9 Trends in Demand of Timber (for Materials) in Japan
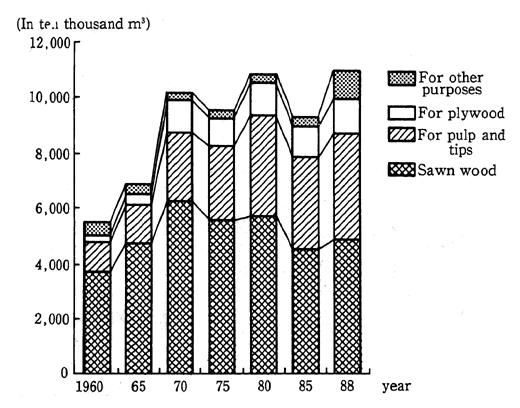
Remarks:1. Prepared according to the Forestry Agency's "Timber Supply-Demand Table".
2. Planed timber is included in "for other purposes" for each year.