Quality of the Environment in Japan 1994
5-7-3 Outline of Studies and Surveys on Designated Chemical Substances and Others
The Law Concerning the Examination and Regulation of Manufacture, Etc., of Chemical Substances was enacted in 1973 to regulate chemical substances with characteristics similar to those of PCBs: low biodegradability, high bioaccumulativity, and chronic toxicity. As a result of underground water pollution caused by trichloroethylene and tetrachloroethylene, the law was amended in 1986 to include clauses on Class II Specified Chemical Substances and Designated Chemical Substances, to require notification of planned and actual production and import volume and to implement other control systems effective both prior to and after production and import.
For the aforementioned Designated Chemical Substances that are potentially harmful to human health due to environmental pollution caused by the substance, a toxicity test is ordered and conducted. If the results indicate that the substance is toxic, it is designated as a Class II Specified Chemical Substance, and prior notification of production and import volume is required. Restrictions on production and imports may be imposed if necessary.
The Environment Agency has been conducting Studies and Surveys on the Possibility of Designated Chemical Substances Remaining in the Environment since 1988 to determine the residual amounts of the Designated Chemical Substances, and particularly the Class II Specified Chemical Substances. Extension of survey areas and upgrading the accuracy of the tests have been undertaken. In addition, since fiscal 1990, exposure route surveys, conducted to determine the volume of chemical substances that individual citizens are exposed to by media, have begun. Detected figures have been adjusted to unified detection limits, and the survey is now called Studies and Surveys on the Designated Chemical Substances.
In fiscal 1992, surveys were conducted on water and bottom sediments in 34 areas for five substances, including 1.2-Dichloroethane. In 23 areas, atmospheric surveys were conducted for 7 substances, including Trichloroethylene. In 9 areas, exposure route surveys were conducted for 6 substances, including Trichloroethylene.
5-7-4 Outline of Follow-Up Survey on Pollution by Toxic Chemical Substances
In order to measure the issue of pollution by chemical substances generated unintentionally through the combination or incineration of chemical substances, the Environment Agency has conducted follow-up surveys on pollution caused by toxic chemical substances since fiscal 1985. These surveys focus on determining the residual levels of unintentionally created chemical pollutants.
In fiscal 1992, follow-up surveys continuing from fiscal 1985 on dioxins-a general name for a whole category of chemicals that includes polychlorodibenzo-p-dioxin (PCDD) and polychloro dibenzofuran (PCDF)-and coplanar PCBs that have a flat structure in comparison with other PCBs, were conducted. As a result of the survey, the Central Environment Council Environment and Health Department Chemical Substances Expert Committee evaluated the dioxins as follows:
(i) Pollution by dioxins found in the general environment is not immediately hazardous to human health. They are low in concentration but continue to be detected in the environrnent; hence monitoring must continue.
(ii) Determining their pollution scheme, such as sources of dioxin, their behavior in the environment, and gathering related information on dioxins must prevail.
Residual coplanar PCBs are thought to be caused by the emission of products including PCBs into the environment ; as use of PCBs has been prohibited since 1972, and PCBs were designated as Class I Specified Chemical Substances in accordance with the Law Concerning the Examination and Regulation of Manufacture, Etc., of Chemical Substances, the potential of worsening pollution is low. However, it is necessary to continue monitoring pollution levels.
5-8 Environmental Conservation Measures in Land Utilization
5-8-1 Appropriate Land Use
The National Land Use Plan was established to give priority to public welfare while promoting efforts to conserve the environment through well-balanced, long-term land use. This plan is a governmental guideline on the use of land.
The National Plan of the National Land Use Plan was revised in December 1985. All the prefectures revised their Prefectural Plans in accordance with the revision of the National Plan.
The National Plan is to be revised again in 1995 in view of the following considerations: (1) the present plan is set to be completed in 1995, (2) there is a large gap between the planned figures and the actual figures for goals for size classified by use, (3) new issues have arisen after the establishment of the present plan, such as the rise of public interest in environmental conservation, intensive concentration in the Tokyo metropolitan area, serious land issues, progressive aging, increase of areas with an alarmingly low population, and progress in resort development.
A total of 1,692 cities, towns and villages also had their own Municipal Plans as of March 31, 1993. To promote the systematization of planning procedures, prefectures implementing national land use plan control and supervising projects are provided with subsidies.
The Land Use Master Plan is based on the National Land Use Plan. Governors of the five designated areas prepare plans on land use and adjustments to be made in their areas. The plan is a comprehensive guideline for adjustments in land administration, providing directly for regulation of land transactions and indirectly for the regulation of land development for projects through such individual laws as the City Planning Act and the Natural Parks Law. The plan is intended to promote more appropriate and rational land use.
The present land areas designated in the five types of areas under the Land Use Master Plan are as follows:
Urban areas approxim ately 9,670,000 hectares
Agricultural areas approximately 17,350,000 hectares
Forest areas approximately 25,530,000 hectares
Natural park areas approximately 5,350,000 hectares
Nature conservation areas approximately 100,000 hectares
Blank areas (areas excluded in all of the above)
approximately 240,000 hectares
Adjustments related to land use include the fundamental guideline for land use, guidelines for adjustments in overlapping areas among the five areas, and development and conservation plans of public institutions to be considered in land use. These are specified in the plan as areas in need of adjustments.
5-8-2 Appropriate Locations for Factories
To provide a radical solution to industrial pollution, appropriate planning for the location of factories is essential. In major cities, the Law Concerning Restriction on Factories in Existing Urbanized Areas of the Metropolitan Region has strictly controlled new factory construction.
Based on the Industrial Relocation Promotion Law, the Industrial Relocation Promotion Fund and other funding schemes are used to promote relocation of plants and factories from areas where relocation is being promoted to other areas, and to promote new and additional construction at the relocation sites. Projects to develop core industrial parks undertaken by the Regional Promotion and Development Corporation and loans provided by the Japan Development Bank and other institutions were also used to promote industrial relocation.
In light of these industrial relocation measures, guidance was provided to ensure that environmental conservation was considered in the factory relocation projects and that the lands vacated after relocation were used to improve the urban environment.
In addition to the above, the Japan Environment Corporation builds and transfers structures for use by multiple industrial tenants in compliance with requests from businesses, to relocate and integrate small factories operating in residential areas. The Small Business Promotion Corporation undertakes construction of industrial parks and provides loans for funding shared factory facilities in cooperation with the prefectural governments. These are intended to meet the needs of small and medium-sized factories that are currently spread out in the metropolitan areas but wish to move to the suburbs in groups.
Furthermore, to promote coordination of individual factory sites with their surroundings, industrial environment management measures were promoted in accordance with the Standards Concerning Factory Location and other standards based on the Factory Location Law. Subsidies were provided through the Japan Development Bank and the Small and Medium-Sized Businesses Corporation to provide funding for environmental maintenance projects. The Small and Medium-sized Businesses Corporation and other institutions also provided loans for factory relocations to prevent pollution.
5-8-3 Development of Green Buffer Zones
To improve the environment and to prevent pollution and natural disasters, it is necessary to implement measures to develop a buffer zone between residential areas and factories generating pollution and disaster-prone areas. In this connection, the Ministry of Construction provides subsidies to local public entities and the Japan Environment Corporation develops and maintains green buffer zones and promotes their development by later selling them to local public entities. In fiscal 1993, approximately ¥3.9 billion was used to subsidize 13 zones including the Narashino green buffer zone (Narashino City).
The Ministry of Transport is developing green buffer zones around Osaka International Airport, Fukuoka Airport, and nine other airports. The fiscal 1993 project costs were ¥8.2 billion.
5-9 Promoting Education, Conservation Activities, and Public Information on Environmental Issues
5-9-1 Promoting Education and Learning about Environmental Issues
(1) Education and Learning about Environmental Issues
In recent years, as pollution in cities and pollution caused by everyday activities increase and as pollution on a global scale grows, demand for more contact with nature and for creating and conserving a Comfortable environment grow. To cope with the complicated and diversified environmental issues of today, each and every citizen must be aware and conscious of the relationship between individual citizens and their environment and be prepared to moderate their lifestyles and activities to accommodate the needs of the environment. Thus, education in schools, homes, localities, and firms as well as through outdoor activities and the independent and individual study of the environment is becoming increasingly important. The Basic Environment Law, enacted in November 1993, states the necessity of"promoting education and learning regarding environmental conservation"as a fundamental policy of the national government.
To attain wide acceptance of education and study of environmental issues requires continuing and comprehensive efforts. Establishing an information network, providing in-depth information, developing various facilities, and supporting efforts in the private sector are essential.
The Environment Agency has undertaken many activities to expand knowledge on environmental conservation and encourage education through television broadcasts and movies in addition to sponsoring environmental education research symposiums, making and distributing educational materials and conducting research on the future form of environmental conservation through vision symposiums, environmental education symposiums, comfortable environmernt symposiums, and the activities of centers to promote environmental conservation.
In fiscal 1989, environmental education training programs and a national liaison conference to promote information exchange on environmental education were held to promote the effective and enthusiastic development of environmental education projects. In addition, an environmental education database containing information on environmental education projects was developed by using the Local Environment Conservation Funds established by prefectures and cities that were designated by a government ordinance and by drawing on other funding sources.
Furthermore, it is essential that environmental education be promoted through the cooperation of all ministries and agencies concerned. Joint efforts of the Ministry of Education and the Environment Agency are particularly important in this respect, and the two organizations have agreed to maintain a close working relationship in this area.
The Ministry of Education has planned and developed its own educational opportunities, which include those concerning environmental issues, a comprehensive social educational activities project providing opportunities for practical activities, and projects meeting the needs of the specific environmental education issues of the regions or other educational demands. Funding subsidies were provided to cities, towns, and villages to promote projects to encourage social education projects, especially for the development and maintenance of social education facilities.
To promote a national movement toward resource and energy conservation, ministries and agencies concerned have adopted adequate measures to address environmental issues and are conducting education and enlightenment programs for individual citizens to encourage them to develop lifestyles that are harmonious with the global environment. The Economic Planning Agency has also undertaken the promotion of voluntary consumer action programs.
(2) Education on Environmental Conservation in Schools
Education on environmental conservation in schools has conventionally been conducted in courses such as social studies, science, physical education, and health. In March 1989, the Operating Procedures for Guidance on Learning for elementary, junior high, and high schools were amended to further expand the contents of guidance on environmental issues. Furthermore, to promote an in-depth study of environmental issues, guidance materials for elementary, junior high, and high school teachers have been prepared and distributed throughout Japan, and a sequel using specific examples is now being prepared. The Third Environmental Education Symposium and Research Conference, attended by teachers and instructors concerned with environmental education throughout Japan, was held in Ehime Prefecture to debate the future course of environmental education as well as promote and encourage environmental education and enhance the quality of guidance on environmental education provided by teachers. Ten cities, towns, and villages, where the schools, homes, and local communities will coordinate efforts in environmental education, were newly designated as Environmental Education Promotion Model Cities, Towns, or Villages.
5-9-2 Promoting Environmental Conservation Activities
To resolve current environmental problems, concerted voluntary and active efforts by individual citizens, businesses, and all other social bodies are essential to reduce the burden on the environment stemming from the daily activities of households and businesses.
As the social awareness of environmental issues has risen in recent years, an increasing willingness is growing among individual citizens to participate in environmental conservation activities. Businesses are becoming more interested in conservation activities as well. However, in actual practice, there is confusion regarding what kinds of activities are"environment-friendly"and how individual citizens can actually become involved in environmental conservation activities. The need to provide accurate and adequate information and develop the necessary social infrastructure are essential for individual citizens and businesses to be able to further pursue environmental conservation activities.
The Basic Environment Law, enacted in November 1993, states the necessity for all parties to bear their fair share of the burden, in a voluntary and enthusiastic manner, to build a society that is capable of sustainable growth but, as a fundamental principle, places less burden on the environment. Based on this principle, the law provides specific provisions to promote voluntary activities in various parts of the private sector.
In fiscal 1993, the Environment Agency sponsored Training Programs for Environmental Conservation Leaders in Miyazaki to promote environmental conservation activities by individual citizens. To support environmental conservation activities by local public entities through the Local Environment Conservation Fund, relevant information was collected and made available. Furthermore, to promote conservation-oriented consumer activities, guidance was provided to promote the use of the ecomark. In fiscal 1993, a comprehensive revision of the ecomark system was also conducted.
To promote environmental conservation activities among businesses, the Environment Agency has worked to raise awareness of its Guidelines for Environmentally Friendly Corporate Behavior, which were issued in February 1993. In addition, the Agency surveys the activities of corporations and provides necessary information to them.
The Ministry of International Trade & Industry is implementing various support measures based on the Law Concerning the Development of Relevant Laws on Upgrading the Supply and Demand Structure of Energy, which was enacted in April 1993 ~with a portion enacted in August 1993), and the Temporary Special Measures Law on Promoting the Rationalization of Energy Use and Projects for the Use of Recycled Resources, enacted in June 1993. Also, in October 1992, the Ministry made a request to businesses to develop Voluntary Plans Concerning the Environment. In December 1993, the Ministry conducted an interim survey on these plans. As of November 1992, 316 firms have complied with the request and this number is expected to increase.
Globally, the International Standards Organization (ISO) is undertaking a program for the international standardization of environmental administration. Japan is a signatory of ISO through the Japan Industrial Standards Council and is currently examining the ISO standardization process and participating actively in this program.
(2) Promoting Global Environmental Conservation Activities of Private Organizations
In recent years, various global environmental conservation programs of private organizations, led by those in Europe and the United States, are being actively implemented. In Japan too, private organizations engaged in such environmental conservation activities as reafforestation and wildlife conservation in their home country and overseas -mainly in developing countries-are increasing in number. At the same time, many segments of the private sector are becoming more interested in such activities. To attain the goal of global environmental conservation, grassroots cooperation on environmental issues and participation by a wide range of individual citizens are extremely important. Japan particularly needs to build up the capabilities of nongovernmental organizations (NGOs) with the objectives of encouraging reflection on its socioeconomic activities and enforcing support for developing nations.
Under these circumstances, the Japan Fund for the Global Environment was established within the Japan Environment Corporation with joint funding from governmental and nongovernmental sources. This led to the approval of the Law to Revise a Part of the Japan Environment Corporation Law on April 26, I993, and its enactment on May 12 of that year.
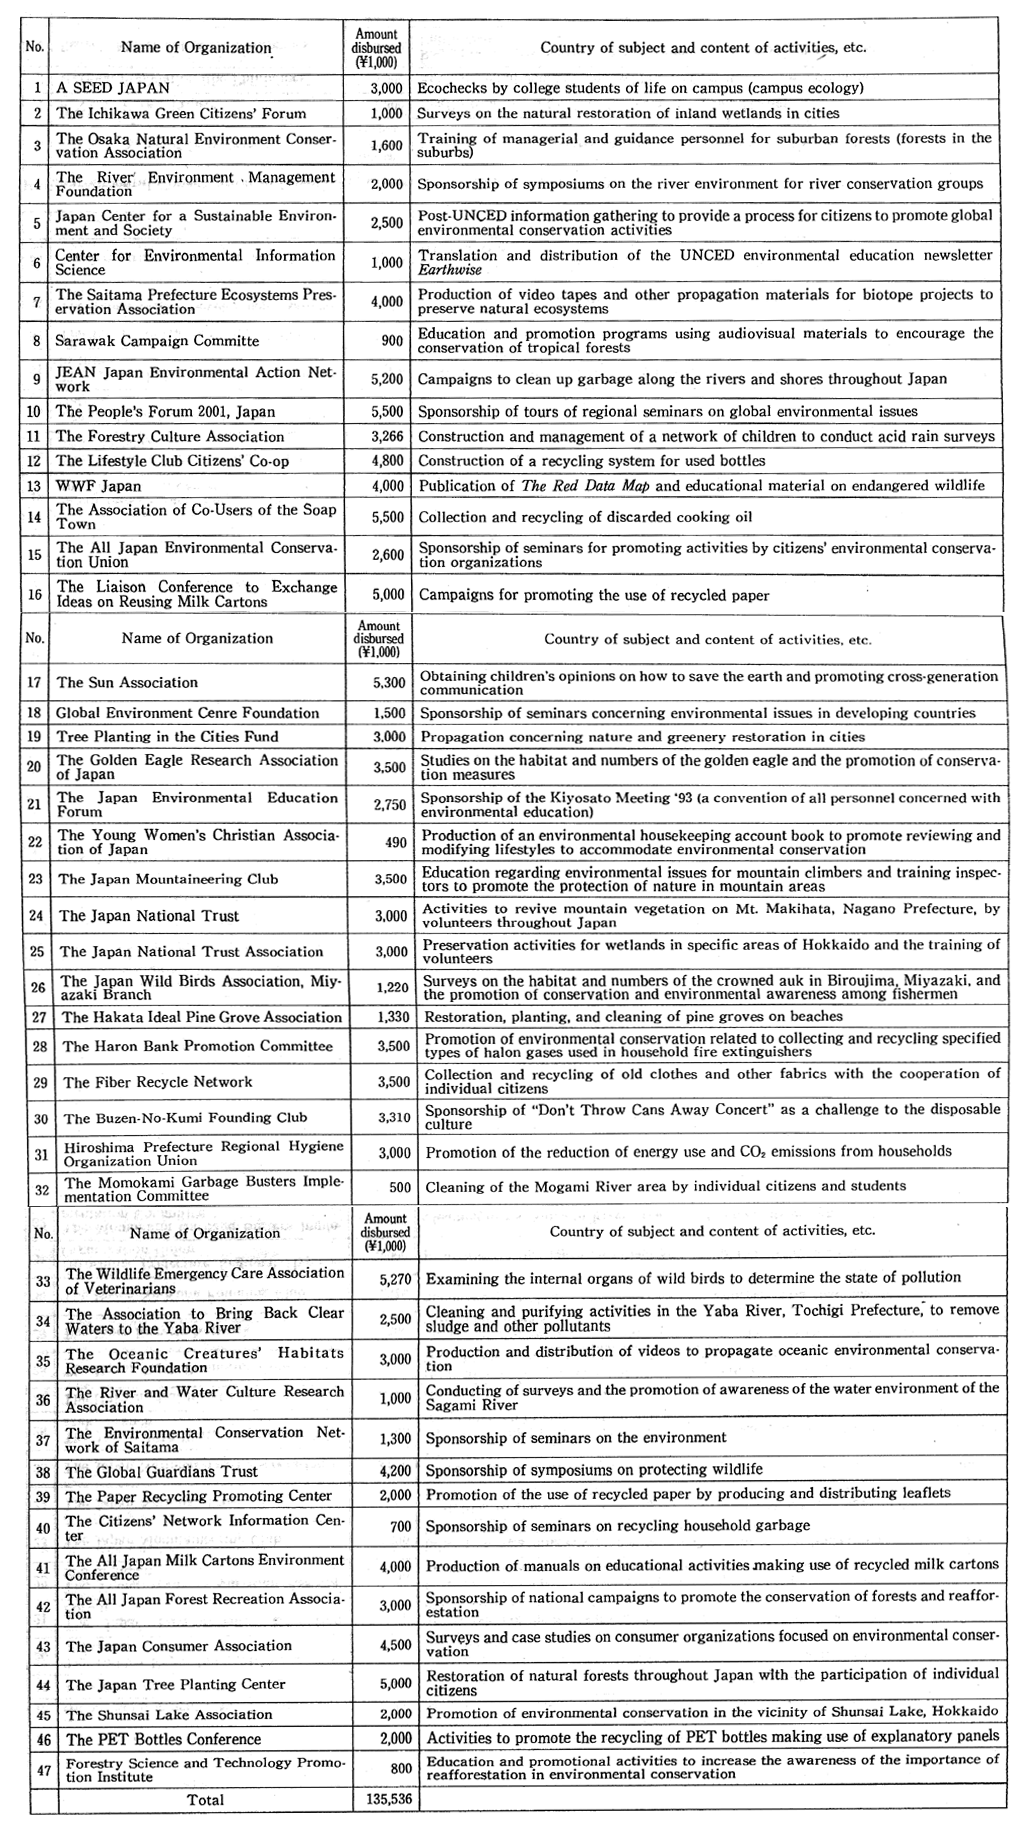
The Japan Environment Corporation established the Japan Fund for the Global Environment based on this law on May 21, 1993, and began providing aid for reafforestation and wildlife conservation pro-jects in developing countries undertaken by private organizations, both Japanese and non-Japanese, and for such activities in Japan as tree planting and recycling. The Japan Environment Corporation also conducted supportive investigations and research and provided necessary information to promote these activities (see Figure 5-9-1). In fiscal 1993, a total of 258 requests from private organizations were made for assistance, of which 104 were provided totaling approximately ¥400 million. (Table 5-9-1)
Fig. 5-9-1 The Structure of the Japan Fund for the Global Environment
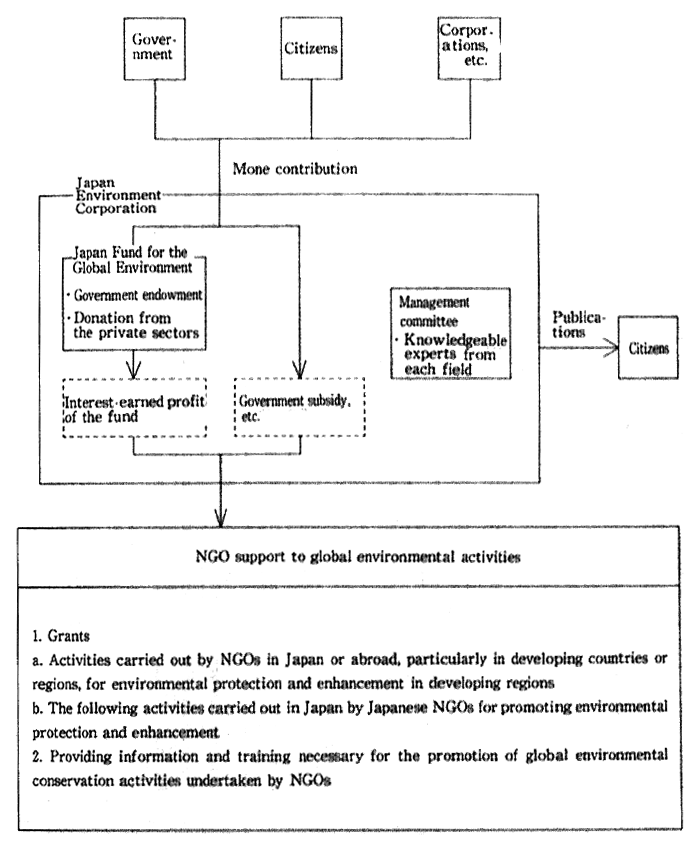
Table 5-9-1 List of Subsidized Projects by the Japan Fund for the Global Environmental Fund inFiscal 1993
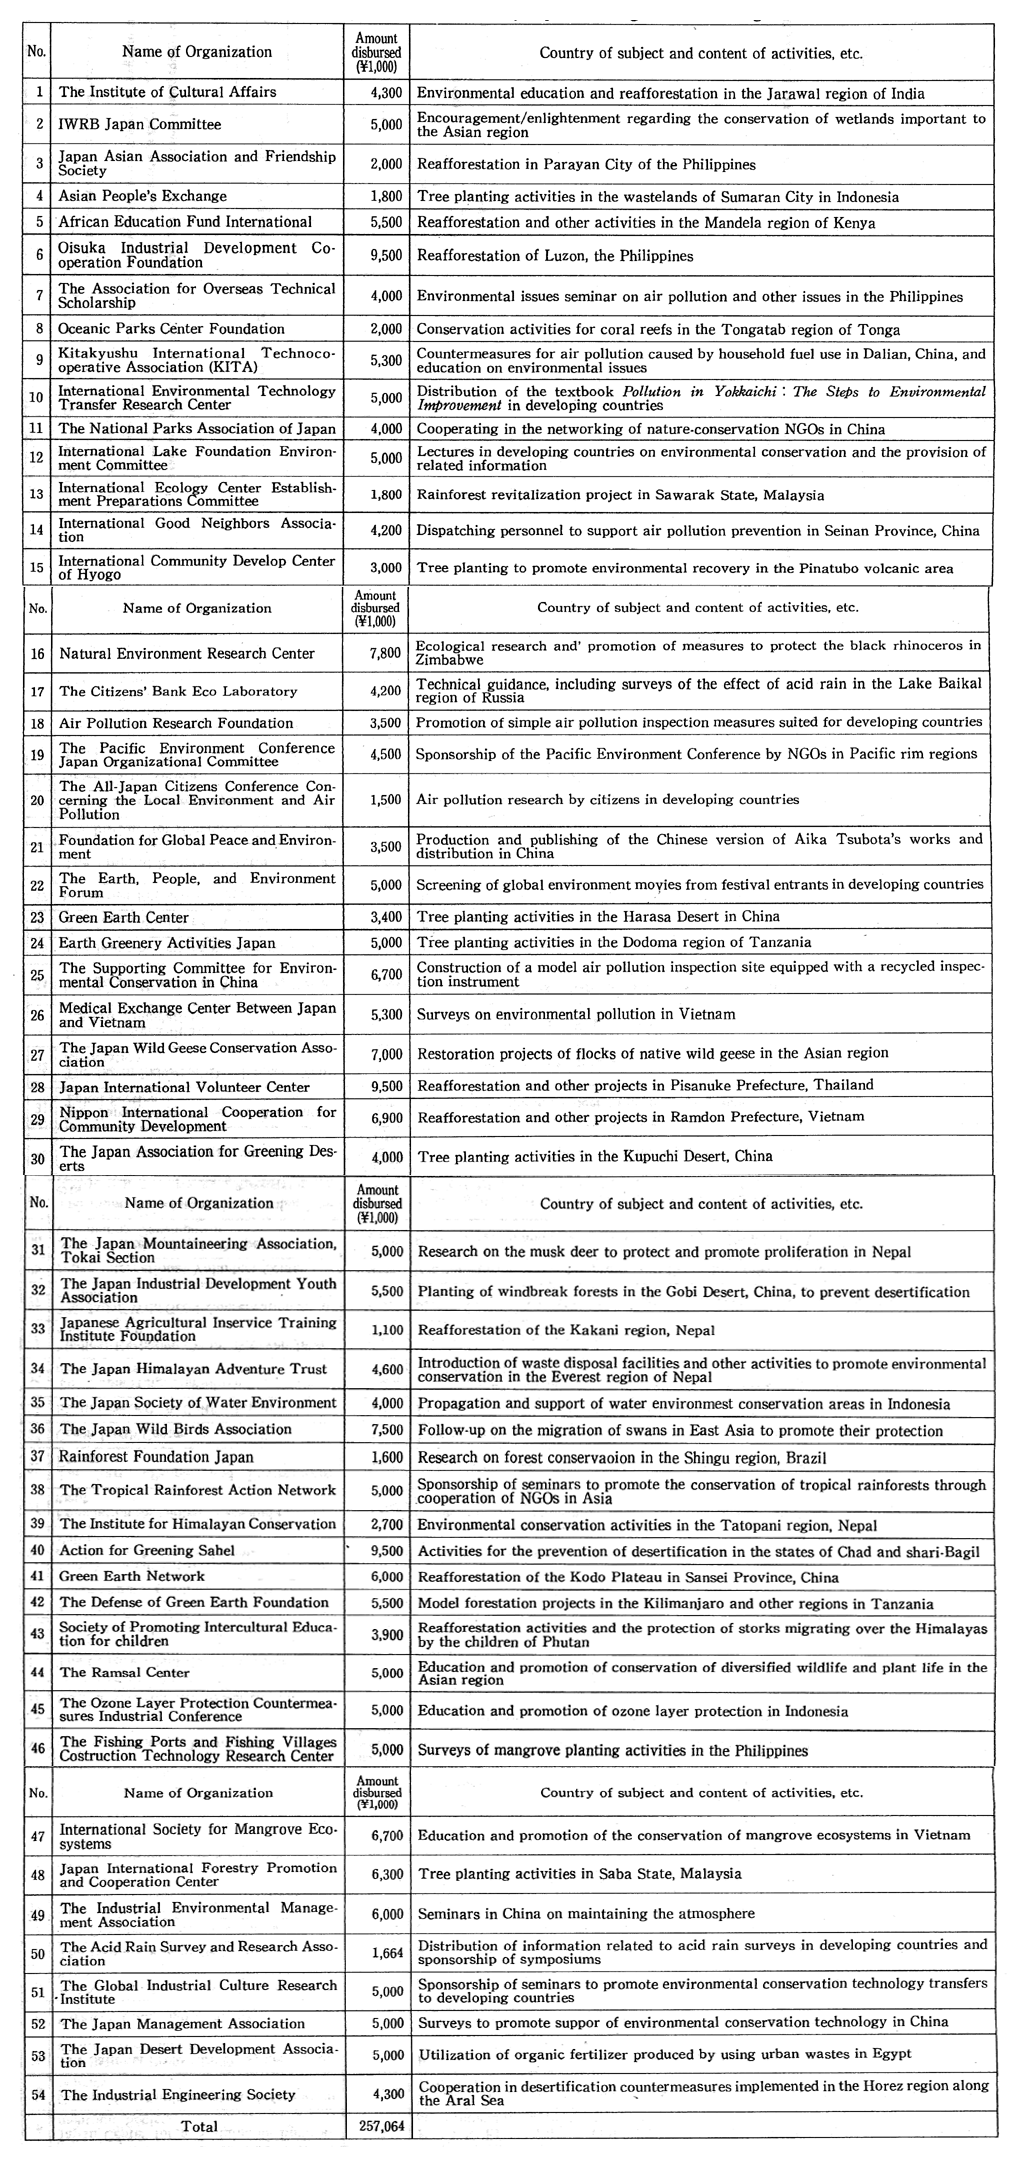
A .Environmental Conservation in Developing Areas Undertaken by Japanese Nongovernmental Organizations
B.Environmental Conservation in Developing Countries by Non-Japanese NGOs

C.Environmental Conservation in Japanese by Nongovernmental Organizations
The Ministry of Foreign Affairs provides subsidies for NGO projects and small-scale grant aid, while the Ministry of Posts & Telecommunications provides aid through funds raised from the sale of postcards with donations included in the postage and its international volunteer savings system.
(3) Promoting Recycling Activities
Following the enactment of the Law Concerning the Promotion of the Utilization of Renewable Resources and the revision of the Waste Disposal and Public Cleansing Law, further substantial enforcement and promotion of recycling activities has become essential.
During the annual Recycling Promotion Month, the Economic Planning Agency, the Environment Agency, the Ministry of Finance, the Ministry of Health & Welfare, the Ministry of Agriculture, Forestry & Fisheries, the Ministry of International Trade & Industry, the Ministry of Transportation, and the Ministry of Construction launched broadly aimed enlightenment and awareness campaigns to promote the understanding and use of recycled resources. In fiscal 1993, the ministries and agencies involved sponsored various symposiums and presented awards to people who made contributions to the promotion of recycling.
The Environment Agency announced the Survey on Cities, Wards, Towns, and Villages Concerning Recycling in December 1993. Further surveys and research concerning recycling are being conducted, while educational materials to promote awareness on recycling are being produced and distributed.
The Economic Planning Agency provided support to organizations actively promoting recycling activities through the Citizens' Resource Conservation Local Promotion Conferences established in each prefecture.
The Ministry of Health & Welfare provided subsidies for projects sponsored by local public entities to construct channels to convert garbage into usable resources and form organizations to promote the development of systems to manage recycling. Educational activities to promote the reduction of waste and the use of recycled materials included the designation of the week from May 30 to June 5 as Garbage Reduction Promotion Week, beginning in 1993.
Furthermore, to enhance the promotion of recycling, the ministries and agencies concerned conducted investigations regarding the economic measures to be implemented. The Environment Agency has continued its search for appropriate measures and published an interim report of the Committee to Evaluate Economic Measures to Promote Recycling in July 1993 and a final report in April 1994.
(4) Preventing the Littering of Empty Cans
The output of canned drinks has rapidly increased. Output rose to more than 29 billion cans a year in fiscal 1990 from the 800 million cans or so in 1970. Some of these cans were littered on roads and seacoasts, in rivers and at other places, posing problems in terms of environmental beautification. The findings of a survey performed by the Environment Agency in 1991 reveals that the littering of empty cans has leveled off in recent years.
To prevent the littering of empty cans, some local governments recover cans through a system whereby coupons are handed out that may be exchanged for a book of coupons when a specified number of cans returned is reached or through a deposit system. In addition, ordinances are established, operating procedures and other measures are created, and campaigns are conducted to prevent the discarding of empty cans and to reinforce cleaning. At the national level, attempts are being made to replenish activities for dissemination and enhancement according to an agreement reached at the Liaison Council on the Problem of Empty Cans which was comprised of 11 related ministries and agencies. As well, the Environment Agency and the Ministry of Health & Welfare have called on local governments to designate an Action Day for Environmental Beautification with a view to promoting positive action on the part of a broader segment of people.
5-9-3 Public Information
(1) General Public Information
Whereas public information activities are conducted through a wide variety of media, the public information journal Kankyo (Environment) is distributed and public information movies prepared by the Environment Agency are lent out.
(2) Execution of "Environment Month Events"
The one-month period around the World Environment Day on June 5 is designated as "Environment Month," and a wide variety of events, including the environmental exhibition Eco-Life Fair and Gatherings in the Environment Month are carried out in attempts to enhance people's consciousness about environmental problems. In addition, 17,977 trees were planted at 119 places across the nation to disseminate thought on greening.
(3) An Appeal for the Designation of an "Action Day for Environmental Beautification"
The Environment Agency and the Ministry of Health & Welfare, among others, called on local governments to designate an "Action Day for Environmental Beautification" to spread environmental beautification movements all over the country.
5-10 Understanding Conditions of the Environment at Local Levels
5-10-1 Measures to Grasp the Present Situation of the Environment at Local Levels
To collect information concerning specific environmental issues occurring all over Japan swiftly and accurately, the Regional Administrative Inspection Bureaus, the Shikoku Branch Regional Administrative Inspection Bureau, and the Okinawa Administration Inspection Office of the Management and Coordination Agency (hereinafter referred to as the Regional and Other Bureaus) collect and file information on surveys and reference materials related to the Environment Agency. At present, there are 48 specialized inspectors and other personnel stationed at the Regional and Other Bureaus. The chiefs of the Regional and Other Bureaus are under the direct supervision of the DirectorGeneral of the Environment Agency.
In connection with these activities, the Environment Agency has four environmental inspectors stationed at the Minister's Secretariat. These inspectors are responsible for managing communications with the Regional and Other Bureaus by conducting surveys on environmental conditions in local areas, collecting and filing resource materials, undertaking general administrative work concerning environment monitors, and providing consultation related to government administrative matters.
5-10-2 Understanding the Condition of the Environment in Fiscal 1993
(1) Information Gathering by Inspectors and Others at the Regional Administrative Inspection Bureaus of the Management and Coordination Agency
The total number of reports filed with the Environment Agency in fiscal 1993 by inspectors at the Regional and Other Bureaus, who are engaged in conducting environmental status surveys on a regular basis, was 21,891. By category, the most common topics were the protection of nature, birds, and animals; the disposal of wastes ; activities to promote the creation of a pleasant environment ; the impact on the environment of various development projects; and other activities.
(2) Information Gathering from Environmental Monitors
There are 1,500 monitors nationwide to survey opinions and relay requests from individual citizens concerning environmental issues. Requests and opinions gathered from the monitors are reflected in the plans and activities of the Environment Agency. The monitors were also requested to respond to a questionnaire entitled"Supporting Developing Countries in the Environment Conservation Field."
(3) Collecting and Filing Reference Materials
Resource materials collected and filed by the inspectors include the following:
A. Information on the Condition of the Environment at Local Levels and Related Matters
(a) Environmental conditions throughout the country Information on environmental issues, filed according to prefecture
(b) Environmental conservation policies Information on environmental conservation policies undertaken and funded by individual prefectures, filed according to prefecture
B. Implementation of Laws
Information is collected on the status of implementation of the Air Pollution Control Law, the Water Pollution Control Law, the Noise Regulation Law, the Vibration Regulation Law, and the Offensive Odor Control Law.
(4) Gathering of Other Materials
In addition to the information mentioned above, a survey covering over 700 cities, wards, towns, and villages is conducted on a continuing basis through the Regional and Other Bureaus to determine the extent of empty can littering.
Chapter 6. The Current State of Air Pollution, Noise, Vibration, and Offensive Odors and the Implementation of Various Countermeasures
6-1 The Current State of Air Pollution
The following describes the current state of air pollution by type of pollutant based on data from continuously operating air pollution monitoring stations throughout Japan.
6-1-1 Sulfur Dioxide
(1) Changes in Annual Average
(a) Air Pollution Monitoring Stations
In fiscal 1992, data on sulfur dioxide was obtained through 1,614 effective air pollution monitoring stations in 691 municipalities. (An effective monitoring station monitors air pollution for more than 6,000 hours per year).
Figure 4-1-5 in Part 1 shows changes in average annual values at 15 air pollution monitoring stations that have monitored continuously since fiscal 1965. As the figure indicates, overall sulfur dioxide pollution has continued to decline after peaking at 0.059 ppm in fiscal 1957. The average concentration of sulfur dioxide fell to 0.009 ppm in fiscal 1992, from 0.011 ppm in fiscal 1991.
(b) Roadside Air Pollution Monitoring Stations
Data for sulfur dioxide for fiscal 1992 was obtained from 79 effective monitoring stations in 60 municipalities. Figure 4-1-5 shows an overall continued decline in the simple mean of annual average values at 16 air pollution monitoring stations that have been monitoring vehicle exhaust gas since 1973. In fiscal 1992, concentrations of sulfur dioxide from vehicle emissions declined to 0.009 ppm, from 0.011 ppm in fiscal 1991.
(2) Trends in the Attainment of Environmental Quality Standards nd the Current Situation
(a) Attaining Environmental Quality Standards Based on Long-term Criteria
In terms of long-term criteria, environmental quality standards are considered attained when daily average values throughout the year, exciuding daily average values that fall within a range of 2% from the higest monitored value, do not exceed 0.04 ppm and when the average daily values do not exceed 0.04 ppm for more than two consecutive days. For example, when there are monitored values for 365 days, the applicable value would be the daily average value on the eighth day after excluding the seven days with the highest values.)
As can be seen in Table 6-1-1, over the past several years, there has been a high attainment rate for environmental quality standards based on long-term criteria.
Table 6-1-1 Attainment Rates of Environmental Quality Standards for Sulfur Dioxide (Long-term Criteria)
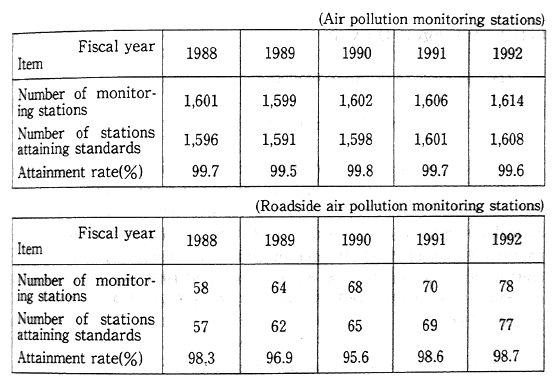
Noses:1. Surveyed by the Environment Agency
2. Excludes stations with insufficient monitoring hours to qualify as effective monitoring stations
3. Data from roadside air pollution monitoring stations excludes those with testing inlets directly on roads.
(b) Attainment of Environmental Quality Standards Based on Short-term Criteria
Air pollution monitoring stations recording a daily average value of less than 0.04 ppm on all effective monitoring days as a percentage of all effective monitoring stations was 98.4% in 1991 and 99.2% in 1992. General air pollution monitoring stations with an hourly value of less than 0.1 ppm in every monitoring hour as a percentage of total effective monitoring stations has been in a high range and rose from 94.3% in fiscal 1991 to 96.3% in fiscal 1992.
Roadside air pollution monitoring stations recording daily average values of less than 0.04 ppm on all effective monitoring days as a percentage of total effective air pollution monitoring stations was 85.7% in fiscal 1991 and 98.7% in fiscal 1992. Roadside air pollution monitoring stations recording hourly values of less than 0.1 ppm in every monitoring hour as a percentage of effective air pollution monitoring stations has been at a high level and rose from 98.6% in fiscal 1991 to 98.7% in fiscal 1992.
6-1-2 Nitrogen Dioxide
(1) Changes in Annual Average
(a) Air Pollution Monitoring Stations
Monitoring data on nitrogen dioxide for fiscal 1992 was obtained from 1,406 effective monitoring stations in 661 municipalities.
Figure 4-1-2 in Chapter 1 shows changes in the simple mean of the annual average values recorded by 15 monitoring stations that have continuously monitored nitrogen dioxide since fiscal 1970. Although a downward trend could be observed after fiscal 1969, the mean began to increase in fiscal 1986, and rose from 0.028 in fiscal 1991, to 0.029 ppm in fiscal 1992.
(b) Roadside Air Pollution Monitoring Stations
Data on nitrogen dioxide for fiscal 1992 was obtained from 340 effective monitoring stations in 191 municipalities. Figure 4-1-2 shows changes in the simple mean of average annual values recorded by 21 monitoring stations that have continuously monitored nitrogen dioxide since 1971. In fiscal 1992, this value was 0.041 ppm, virtually the same as the 0.042 ppm in fiscal 1991.
(2) Compliance with Environmental Quality Standards
In a revision to the environmental quality standards for nitrogen dioxide, the Environment Agency Notification No. 38 in July 1978 (hereinafter referred to as the Notification) states that the "daily average of hourly values shall be within or less than a range of 0.04 ppm to 0.06 ppm." The Notification also stipulates that "in principle, efforts shall be made to attain 0.06 ppm within 7 years (2-1 of the Notification) in those regions where the daily average exceeds 0.06 ppm." Furthermore, the Notification states that "in principle, in those regions where the daily average is in a range of 0.04 ppm to 0.06 ppm, efforts shall be made to maintain the concentration level of 1978 or not to significantly exceed it." (2-2 of the Notification).
The criteria used for determining the attainment of environmental quality standards for nitrogen dioxide is the daily average value corresponding to 98% from the lowest daily average value throughout the year (hereafter called the annual 98% value of the daily average). We will now make a comparison of standards.
Figure 4-1-3 in Chapter 1 shows a comparison of environmental quality standards with actual data obtained through 1,406 effective air pollution monitoring stations and 336 roadside (vehicle exhaust) monitoring stations, except for those with testing inlets directly on roads.
The percent of air pollution monitoring stations where the annual 98% value of the daily average has exceeded 0.06 ppm-which is the top of the range-has declined since 1978, and in recent fiscal years it has been relatively unchanged with only minor fluctuations depending on the fiscal year. In fiscal 1992, 2.6% of general air pollution monitoring stations exceeded the standards, compared with 5.9% in fiscal 1991. There were 96 (28.6%) roadside air pollution monitoring stations, concentrated mainly in such large urban areas as Tokyo, Osaka, and Kanagawa Prefecture, where the annual 98% value of the daily average exceeded 0.06 ppm.
(3) Areas Where Concentrations of Nitrogen Dioxide Are Within Levels Stipulated by Environment Quality Standards
Table 6-1-2 shows trends in concentrations of nitrogen dioxide in areas where average daily values are between 0.04 ppm to 0.06 ppm
Table 6-1-2 Trends in Nitrogen Dioxide Concentration in Regions with Daily Values Between 0.04ppm and 0.06ppm
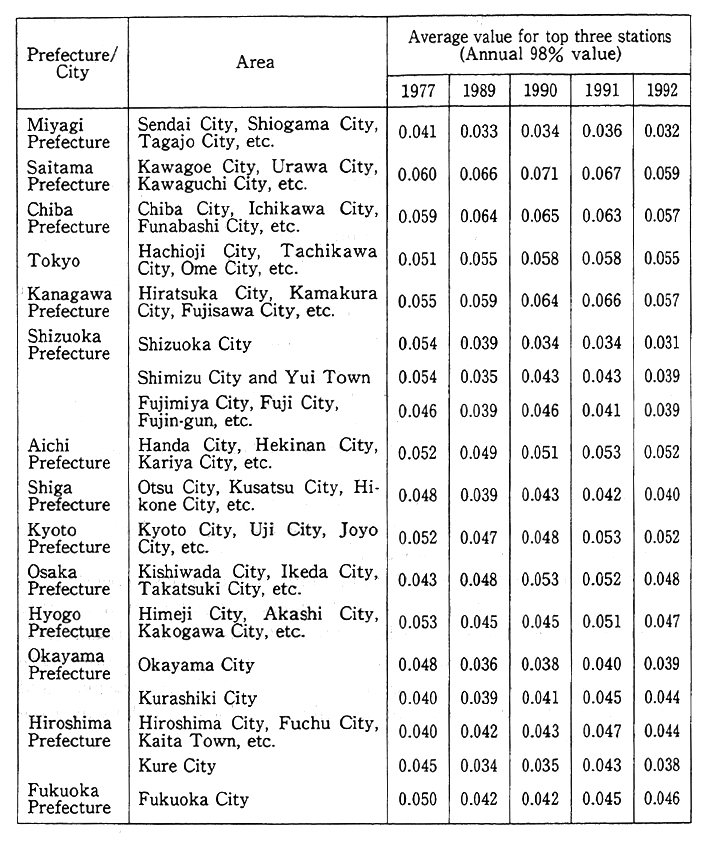
Note Surveyed by the Environment Agency. based on environment quality standards for nitrogen dioxide. These figures are based on the results of monitoring data since 1977, when the present standards were specified in the Environment Agency's Notification No. 2-2, and from fiscal 1989 through 1992.
(4) Nitrogen Monoxide
(a) Air Pollution Monitoring Stations
Data on the monitoring of nitrogen monoxide in fiscal 1992 was obtained from 1,406 effective monitoring stations in 661 municipalities. Changes in the simple mean of average annual values at 28 monitoring stations that have been continually monitoring since fiscal 1971 are shown in Figure 4-1-2. These values have trended downward since fiscal 1971, have been generally level over the past 10 years, and were 0.021 ppm in fiscal 1992, virtually unchanged from 0.023 ppm in fiscal 1991.
(b) Roadside Air Pollution Monitoring Stations
Data on nitrogen monoxide in fiscal 1992 was obtained at 340 effective monitoring stations in 191 municipalities. Figure 4-1-14 shows changes in the simple mean of the annual average at 21 monitoring stations (the same as for nitrogen dioxide) continuously in operation since fiscal 1971. The mean decreased to 0.062 ppm in fiscal 1992 from 0.068 ppm in fiscal 1991.
6-1-3 Carbon Monoxide
(a) Roadside Air Pollution Monitoring Station
Automobiles are the principal source of carbon monoxide emissions. To ascertain the amount of carbon monoxide pollution emitted from vehicles, it is necessary to examine trends in carbon monoxide levels near roads, intersections, and other areas where there is a large volume of traffic. Data on carbon monoxide in fiscal 1992 was obtained at 323 effective monitoring stations in 190 municipalities.
(b) Trends in the Annual Mean
The simple mean of the average annual value at 14 monitoring stations in continuous operation since fiscal 1971 has leveled off over the past several years after declining steadily for many years. In fiscal 1992, the annual mean was 2.0 ppm.
(c) Attaining Environmental Quality Standards
On the basis of long-term criteria, environmental quality standards are considered attained when the daily average values throughout the year-excluding those values not exceeding 10 ppm that come within a range of 2% of the highest value-do not exceed 10 ppm for more than two consecutive days.
On the other hand, on the basis of short-term criteria, environmental quality standards are attained when the daily average value does not exceed 10 ppm and when the 8 hour average value does not exceed 20 ppm.
At all 317 effective roadside air pollution monitoring stations, excluding those with testing inlets directly on roads, environmental quality standards have been attained based on both long-term and short-term criteria.
(2) Air Pollution Monitoring Stations
Data on carbon monoxide in fiscal 1992 was obtained from 195 effective monitoring stations in 163 municipalities. Environmental quality standards for long-term and short-term criteria were attained at all these stations.
6-1-4 Photochemical Oxidants
(1) The Results of Photochemical Oxidant Monitoring in Fiscal 1992
Data on photochemical oxidants was obtained from 1,094 general air pollution monitoring stations in 603 municipalities and from 38 roadside air monitoring stations in 24 municipalities.
The appearance of photochemical oxidants in the environment depends largely on meteorological conditions. Therefore, fluctuations in the number of days of high concentration of photochemical oxidant can be observed among the different fiscal years. The number of days when the high concentration of oxidant was observed was higher in fiscal 1992 than in fiscal 1991.
Table 6-1-3 shows the average number of days when the hourly average photochemical oxidant concentration was 0.12 ppm (warning issuance level) or higher per monitoring station for 994 general air monitoring stations and 38 roadside monitoring stations that have monitored continuously since 1988 (Table 6-1-3).
Table 6-1-3 The Average Number of Days when the Concentrations of Photochemical Oxidants were above Warning Issuance Level
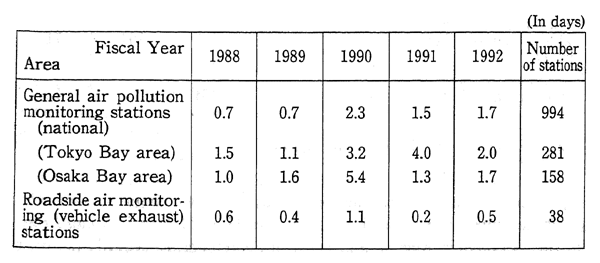
Notes:l. Surveyed by the Environment Agency.
2. The Tokyo area consists of Tokyo and six prefectures, including Ibaraki, Tochigi, Gunma, Saitama, Chiba, and Kanagawa prefectures.
3. The Osaka Bay area consists of Kyoto, Osaka, Hyogo and Nara Prefectures.
4. The values in the table are computed by dividing the total number of days when concentrations exceeded 0.12ppm at continuously monitoring stations by the number of continuously monitoring stations.
(2) Photochemical Oxidant Warnings in Fiscal 1993
(a) The Issuance of Warnings in Various Parts of Japan
In fiscal 1993, photochemical oxidant warnings were issued on 71 days in 15 prefectures. (A warning is issued when the hourly average photochemical oxidant concentration is 0.12 ppm or higher and when this pollution is expected to continue after taking into consideration present meteorological conditions.) In 1993, warnings were issued on 93 fewer days than in 1992, when warnings were issued on 164 days in 16 prefectures. This marked the first time in four years that the number of days when warnings were issued fell below 100 days. When compared with each year over the past 10 years, 1993 had the second fewest number of days when warnings were issued, following 1989 when warnings were issued on 63 days (Table 6-1-4).
Table 6-1-4 The Total Number of Days with Warnings and in Number of Person Reporting Health Damege (1989-1993)

Note Surveyed by the Environment Agency.
Looking at the total number of days with warnings, on a monthly basis, warnings were issued on 19 days in May, 23 days in June, 9 days in July, 19 days in August, and 1 day in September. Especially noteworthy was a sharp fall in the number of days with warnings for July compared with the previous July, when warnings were issued on 102 days.
In 1993, the highest concentration of photochemical oxidants recorded when a warning was issued was 0.243 ppm. However, no photochemical oxidant alarm was issued during the year. Although the standards for issuing such alarms varies by regional authority, these alarms are generally issued when the hourly average of photochemical oxidants is 0.24 ppm or higher and when such pollution is expected to continue after taking into consideration present meteorological conditions.
(b) The Number of Warnings by Region
By region, in calendar year 1993, photochemical oxidant warnings were issued on 41 days in the Tokyo Bay region (Tokyo along with Ibaraki, Tochigi, Gunma, Saitama, Chiba, and Kanagawa prefectures) and 16 days in the Osaka Bay region (Kyoto, Osaka, Hyogo and Nara prefectures). These two regions accounted for about 80% of the total number of days in 1993 in which warnings were issued.
(c) People Reporting Adverse Health Effects from Photochemical Oxidants
In 1993, 93 people reported that their health was adversely ected by photochemical air pollution (people who voluntarily reportsome type of subjective symptoms), significantly fewer than the 307 sons in 1992.
6-1-5 Non-methane Hydrocarbons (NMHC)
In 1976 the Central Council for Environmental Pollution Control mitted its Guidelines on the Levels of Hydrocarbons in the Atmoere to Prevent the Formation of Photochemical Oxidants. These delines stipulate that NMHC in the environment will be monitored that the concentration of NMHC shall be within a range of 0.20 C - 0.31 ppmC in terms of the three-hour average between 6 a.m. 9 a.m., which corresponds to the one-hour value of the 0.06 ppm ronmental quality standard for photochemical oxidants. (ppmC is a value that is expressed based on the number of carbon atoms.)
(1) Air Pollution Monitoring Stations
Data on the monitoring of NMHC in fiscal 1992 was obtained 1 348 monitoring stations in 244 municipalities. Table 6-1-5 shows Iges in the simple mean of average annual values between 6 a.m. and n. at six monitoring stations in continuous operation since fiscal
(2) Roadside Air Pollution Monitoring Stations
In fiscal 1992, data on NMHC was obtained from 174 monitoring ons in 113 municipalities. Changes in the simple mean of the annual age between 6 a.m. and 9 a.m. at 9 monitoring stations in continuous ations since 1977 are shown in Table 6-1-5.
Table 6-1-5 Year-Specific Trends in Simple Average Values of Annual Values of NMHC between 6 a.m. and 9 a.m. at Continuously Monitoring Stations
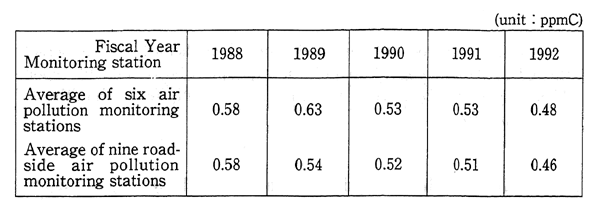
Source Surveyed by Environment Agency
6-1-6 Suspended Particulate Matter
Data on suspended particulate matter for fiscal 1992 was obtained from general air pollution monitoring stations, including 1,408 effective general air pollution monitoring stations in 658 municipalities and 182 effective roadside air pollution monitoring stations in 127 municipalities. For long-term criteria, environmental quality standards are considered attained when the highest annual daily average value excluding the highest 2% of annual monitored values does not exceed 0.10 mg/m3 and where the daily average value does not exceed 0.10 ppm/m3 more than two consecutive days.
Based on such long-term criteria, the attainment rate for environmental quality standards at general air pollution monitoring stations rose to 57.6% in fiscal 1992, from 49.7% in fiscal 1991, while the attainment rate at roadside air pollution monitoring stations rose to 33. 5% in fiscal 1992, from 30.1% in fiscal 1991 (Figure 6-1-1).
Figure 4-1-8 in Chapter 1 shows changes in the simple mean of annual average values at 39 general air pollution monitoring stations operating continuously since fiscal 1974, and at 6 roadside air pollution monitoring systems continuously operating since 1975.
Fig. 6-1-1 Attainment of Environmental Standards for Suspended Particulate Matter
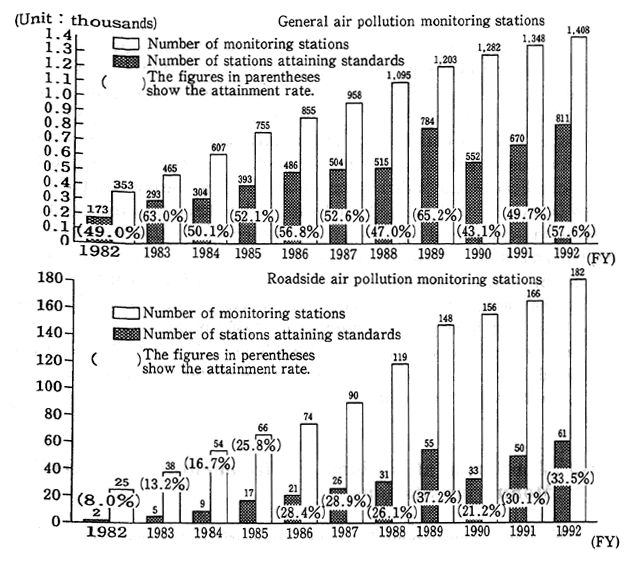
Notes 1. Survey by the Environment Agency
2. Figures for roadside monitoring stations exclude those with testing inlets directly on roads
6-1-7 Dust Fall
Particulate matter in the atmosphere recorded as falling dust includes soot and dust particulates, which fall because of gravity or precipitation. In fiscal 1992, dust fall was monitored at 1,201 points, all of which monitored for the number of hours necessary for effective monitoririg. By weight of dust fall in fiscal 1992, there were four monitoring points (six monitoring points in fiscal 1991) that registered dust falls of between 20-30 t/km2 and 14 monitoring points (17 in fiscal 1991) that registered more than 30t/km2/month.
6-1-8 Other Types of Pollutants
In recent years, the focus on particulate matter has been expanded from weight to such qualitative factors as composition by element. Besides the previously mentioned substances which are continually checked and monitored, the national air pollution monitoring stations established in key locations throughout Japan analyze the components of various suspended particulate matter (such as benzene soluble matter, sulfuric radicals, nitric radicals, vanadium and other heavy metals, and benzo (a) pyrene) that are collected with high-volume air samplers, as well as the components of suspended particulate matter (aluminum, barium, and 31 other elements) collected with low-volume air samplers. The monitoring and analysis of mercury started in fiscal 1982.
Monitoring for asbestos has been carried out on a biennial basis since 1985 ; formaldehyde and dioxin since 1986 mercury since 1987 ; and organic chlorine solvents since 1989. The findings of the surveys conducted thus far indicate that concentrations of these substances have not reached levels that might cause problems (Table 6-1-6).
6-1-9 Monitoring at National Environmental and Air Monitoring Stations
National environmental and air monitoring stations, which are situated on the peripheries of principal plains throughout Japan, continually monitor pollutants in the environment. The results of monitoring performed at these stations serve as a good yardstick for ascertaining concentration levels (background values) in nonpolluted areas (Table 6-1-7).
Table 6-1-6 Results of Monitoring of Nonregulated Air Pollutants as of the End of Fiscal 1994
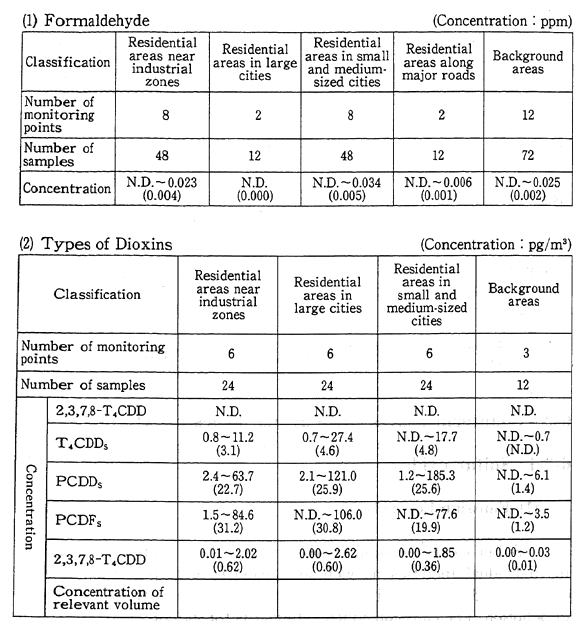
Notes :1. Surveyed by the Enviroment Agency
2. 1pg= one trillionth of a gram
3. N.D. denotes "not detected".
4. The figures in parentheses are average values (N.D. is calculated as 0)
5. [2,3,7,8-T4CDD] =2,3,7,8-4 chloride dibenzo-P-dioxide.
[T4CDDs] =all 4 polychioride dibenzo-p-dioxide,[PCCDs] =polychloride dibenzo-P-dioxide. [PCDFs] = polychioride dibenzofuran
6. [The 2,3,7,8-T4CDD relative concentration value] the sum total of isomer concentration levels for various types of dioxides calculated using the 2,3,7,8-T4 CDDN (NATO Toxicity Equivalency Factor determined by NATO).
Table 6-1-7 Monitoring at National Envirornuental Monitoring Statioris in Fiscal 1992 (Annual Averages)
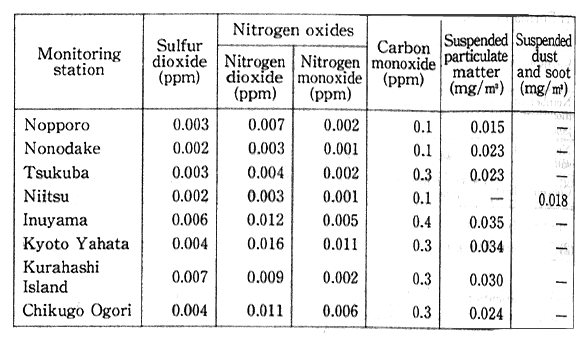
Note: 1. Surveyed by the Environment Agency.
2. Refer to Figure 6-3-1 for Iocation of monitoring stations.
6-2 Countermeasures for Variou Types of Air Pollutants
6-2-1 Sulfur oxides
(1) Emission Controls
Sulfur oxide emission controls includ both emission standards for individual facilitie as well a are wide total pollutant volume control standard for individual factonrie in regions with a high degree of pollution. The emission control standard for individual facilities are called K-value controls. These includ fixed K-va1ues determined for each region (16 ranking from 3.0 to 17.5, with small values being most stringent) as well a maximum allowable emission limits depending on stack height. K-values have gradually been strengthened on eight occasions since they were first implemented in December 1968. Areawide total pollutant load control for individual factories are implermented based on total volume reduction program formulated by prefectural governors in nationally designated total pollutant volume control districts (designated regions where there is a large concentration of factories and businesses and where it is difficult to attain environmental quality standards using emission standards alone). Currently, such K-value controls are used in 24 districts. Furthermore, in areas designated for total volume controls and at soot and smoke generating facilities in areas where there is a conspicuous seasonal rise in pollution because of increased use of heating fuels, standards for the use of fuels (related to the sulfur content) are formulated for small factories and business establishments, which because of their small size, are exempt from areawide total pollutant load control standards.
(2) Countermeasures for Pollutant Sources
Pollutant source countermeasures established in line with sulfur oxide emission standards include the installation of equipment for desulfurization of heavy oils and devices for flue gas desulfurization as well as various other measures.
Equipment for direct and indirect desulfurization of heavy oils has been used since 1967. In Japan, heavy oil processing capabilities as of the end of fiscal 1992 were 68,000 kl/day for each of 12 direct desulfurization facilities and 127,000 kl/day for each of 26 indirect desulfurization facilities. 3 Through the desulfurization of heavy oils, the average rate of sulfur contain in heavy oils for domestic use was 1.05% in fiscal 1992.
The number of flue gas desulfurization facilities and the scale of flue gas processing capabilities have been steadily expanding (Figure 6-2-1). Thus, there has been a significant reduction in sulfur-dioxidecaused air pollution compared with the 1965-1970 period.
Fig. 6-2-1 Installation of Exhaust Desulfurization Facilities by Fiscal Year
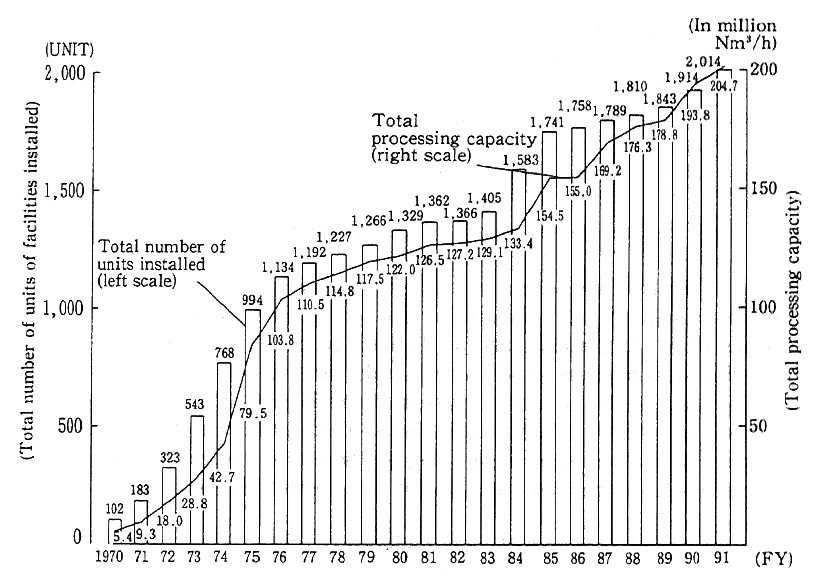
Notes :1: Surveyed by the Environment Agency.
2: The figures up to fiscal 1982 are as of January 1 for each year and those figures for fiscal 1983 and after are as of March 31 of each year.
6-2-2 Nitrogen Oxide Countermeasures
(1) Measures Implemented at Stationary Sources
(a) Implementation of Nationally Uniform Emission Controls
Since the first retrictions were implemented in August 1973, nationwide uniform control standards governing the emission of nitrogen oxides from stationary soure have been strengthened five times. These controls have been appropriately reviewed and those facilities (such as diesel engines ) that emit large volumes of nitrogen oxides, and therefore could not b ignored by environmental pollution prevention laws, have also been made subject to these controls.
(b) The Implementation of Total-Volume Controls
Total-volume controls for nitrogen oxides have been implemented in areas with heavy concentrations of factories and businesses and in areas where it is recognized a difficult to comply with environmental quality standards for emission controls for individual soot and smoke generating facilities In recognition of the urgent need for measures to reduce emissions in Tokyo's 23 ward, Yokohama and Osaka to attain environmental protection standards, these three regions were made subject to total-volume controls for nitrogen oxides beginning in 1986.
(c) Development of Technologies to Lower Nitrogen Oxide Emissions
Low-NOx combustion and flue gas desulfurization technologies are among the various technologies introduced to reduce emissions of nitrogen oxides from stationary sources.
Low-NOx combustion technologies include two-phase combustion, exhaust gas recycling (EGR), and low-NOx burners. These technologies enable a significant reduction in nitrogen oxide emissions. Boilers and other products incorporating such technologies are being widely used.
Fig. 6-2-2 Installation of Exhaust Denitrification Facilities by Fiscal Year
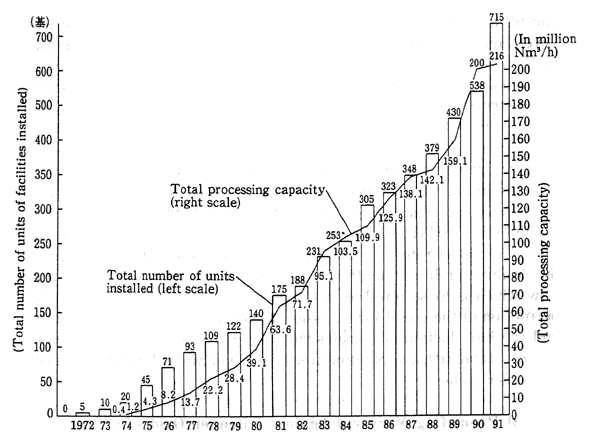
Notes :1: Surveyed by the Environment Agency
2 The figures up to fiscal 1982 are as of January 1 for each year and figures for fiscal 1983 and after are as of March 31 of each year.
As shown in Figure 6-2-2, the number of flue gas desulfurization facilities installed and the scale of flue gas desulfurization capabilities have steadily increased. A widely used desulfurization method is the dry-type selective contact and catalyst reduction method.
Although small commercial-use facilities and burners for home use are not considered soot-emitting sources under the Air Pollution Control Law, it was nonetheless impossible to ignore the volumes of emissions of nitrogen oxides from these sources in large cities. At present, with the aim of reducing the volume of emissions from these sources, there is discussion about introducing such measures as the establishment of numerical technological targets and presenting awards to outstanding low-NOx burners. Low-NOx emitting equipment is being developed through the introduction of various low-NOx technologies.
(2) Measures Against Automobile Emission
Although controls on nitrogen oxides emission from each automobile have been gradually strengthened, there is still a need to further lower emissions in major cities with large volumes of automobile traffic. Therefore, it is necessary to promote not only measures for each automobile, but also comprehensive measures, such as making a physical distribution system more efficient and the promotion of lowemission vehicles.
In addition to those measures, as one approach to prevent health damage from such air pollutants as nitrogen oxides, a number of projects and activities aimed at improving the air quality in local areas throughout Japan are being financed through a fund established by the Pollution-Related Health Damage Compensation and Prevention Association (Hereafter referred to as PHDCPA) as a result of the revision of the Pollution-related Health Damage Compensation and Prevention Law which is to be referred in Chapter 5. (These projects include the promotion of the use of low-emission vehicles, such as electric vehicles, and the introduction of vehicles that comply with the latest emission control standards, and planting trees for clean air by local government and other bodies.)
(3) Promoting Measures Against Nitrogen Oxides in Major Urban Areas
Despite the implementation of the various measures mentioned previously, the levels of air pollution caused by nitrogen oxides in major urban areas remain significant. Given these conditions, the Environment Agency formulated, the "Medium-Term Prospect of Measures Against Nitrogen Oxides in Major Cities" in December 1985, and the "New Medium-Term Prospect of Measures Against Nitrogen Oxides in Major Cities" (hereinafter referred to as New Medium-Term Prospect) in December 1988. On the basis of these prospects, the Environment Agency has promoted systematic and comprehensive measures based on future prospects. The New Medium-Term Prospect forecasted on pollution levels of the fiscal year 1993, and indicated the directions in which the measures should be taken according to the forecast. Based on the forecast, various measures have been promoted to achieve the environmental quality standard as soon as possible. These measures are focusing on three aspects: emission controls against individual vehicles, controls of overall automotive traffic, and emission controls from stationary sources.
An examination of nitrogen dioxide concentrations in fiscal year 1992 in the three regions subject to areawide total pollutant volume controls on nitrogen oxides indicates that the level of annual average values remained almost the same as in the previous year. Also, even though the achievement rate for required environmental quality standards increased from the previous fiscal year, this rate was a marginal 70.3% for general air monitoring stations and 26.4% for roadside air monitoring stations. An estimation of nitrogen oxide emissions by type of source in these three areas in fiscal 1985 shows that the proportion of emission from automobiles was significant, standing at 67% for Tokyo' s 23 wards and other areas, 32% for Yokohama, and 47% for Osaka.
In an attempt to improve the level of air pollution caused by nitrogen oxides in major cities, besides upgrading and strengthening the current measures that have been implemented, it was decided that measures based on new concepts should be implemented and further efforts have been made to reduce emission from automobile nitrogen oxides throughout these areas based on the "Law Concerning Special Measures for Total Emission Reduction of Nitrogen Oxides from Automobiles in Specified Areas" that was promulgated in fiscal 1992 (refer to Section 4).
Also, aggressive steps are being taken to strengthen measures for individual vehicles ; promote the substitution of vehicles for lower-NOx emission vehicles by introducing vehicles that satisfy the latest emission controls; and encourage the use of electric and other low-emission vehicles. Specific steps include preferential tax measures and the use of a fund available under the Pollution-Related Health Damage Compensation and Prevention Law.
In addition to these measures, to respond to high concentrations of air pollution in winter, the Provisional Measures Against Seasonal Air Pollution were formulated. They incorporate such measures as specifying appropriate heating temperatures and putting restrictions on the number of incoming and outgoing trucks in urban regions. With December designated as Air Pollution Prevention Promotion Month, a number of other pollution-prevention activities targeted at the general public are being carried out, including the dissemination of publications that promote the use of public transportation.
6-2-3 Suspended Particulate Matter
Particulate matter in the atmosphere is broadly categorized into two categories: falling dust and suspended dust. In accordance with environmental quality standards, suspended dust is further subcategorized into suspended particulate matter with a particulate diameter of less than 10fハm and other suspended particulate matter. Sources of suspended particulate matter include not only various industrial activities at factories and business establishments and the operation of motor vehicles, but also the natural environment, including soil particles carried by the wind. For dust generated through various industrial activities at factories and businesses, the Environmental Pollution Prevention Law stipulates that 1) particulate matter generated by the combustion of fuels and other matter or by the use of electric power as a heat source is to be regulated as "soot" and that 2) particulate matter generated by crushing and sorting and other similar types of mechanical processing or storage as well as matter that is scattered in the air are to be regulated as "dust." In accordance with the previously mentioned law, matter generated by the operation of motor vehicles is regulated as "particulate matter."
(1) Strengthening Measures Against Suspended Particulate Matter
Environmental quality standards for suspended particulate matter were established in January 1972. In fiscal 1992, the attainment rates for these standards-57.6% for general air pollution monitoring stations and 33.5% for roadside air pollution monitoring stations-remained at low levels, and the implementation of various countermeasures became an urgent task. Therefore, comprehensive studies and analysis on suspended particulate matter were implemented. These included a study on traditional sources of dust and soot ; a study on the formation of secondary particulate matter (including such gaseous particles as sulfur oxides in the environment that have been formed after undergoing physical and chemical changes); and a comprehensive study and analysis of concentrations of suspended particulate matter in the environment.
Table 6-2-1 Target Values (Mean Values) for Permissible Limits
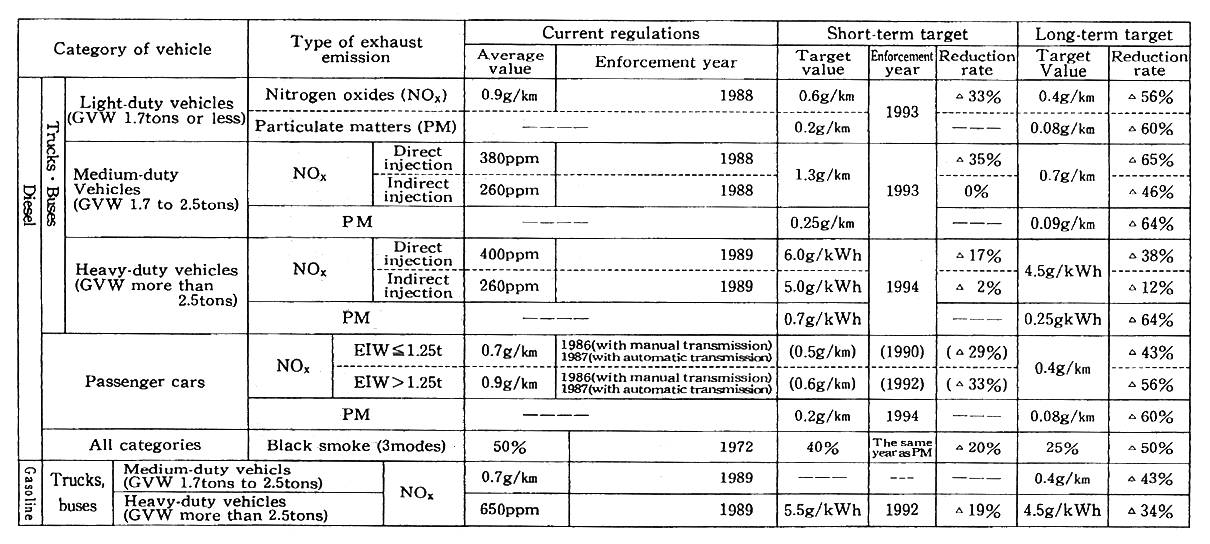
Notes: 1. The short-term target value for diesel-powered passenger cars is the one already notified in December, 1988, and is not the one recommended this time.
2. GVW --- Gross vehicle weight EIW --- Equivalent inertial weight (gross weight assuming two passengers, equal to vehicle weight + 110kg)
3. As for nitrogen oxides, the reduction rate of short-term and long-term targets are in relation to the current regulations. As for particulate matters, the reduction rate of the long-term target is in relation to the short-term target value.
4. As for black smoke, the current regulations and short-term and long-term target values are not average values, but maximum values.
5. O.25g/kWh, 0.7g/kWh, 4.5g/kWh, 5.Og/kWh, 5.5g/kWh, 6.Og/kWh may be respectively converted to O.18g/PSh, 0.5lg/PSh, 3.31g/PSh, 3.68g/PSh, 4.05g/PSh, 4.41g/PSh.
6. The long-term target values are to be achieved as soon as possible, and at the latest within ten years.
In September 1990, the state of pollution and future issues were defined in an interim report issued by a committee examining methods for reducing suspended particulate matter. Taking the contents of this report into consideration, studies and deliberation are being carried out to better understand the mechanisms causing high concentrations of suspended particulate matter in winter (November and December) and to more precisely forecast suspended particulate concentrations.
To attain short-term emission control targets for particulate matter in all motor vehicle exhaust as specified in the recommendations made by the Central Council for Environmental Pollution Control in December 1989, existing controls on black diesel smoke will be strengthened and new controls on all particulate matter in motor vehicle exhaust will be implemented in 1993 and 1994. Furthermore, it is expected that several types of vehicles will be able to attain long-term emission targets by around fiscal 1997 and various technologies are being evaluated so that other types of vehicles can attain these targets in the shortest possible time (Table 6-2-1).
(2) Measures Against Soot and Dust and Regular Particulate Matter
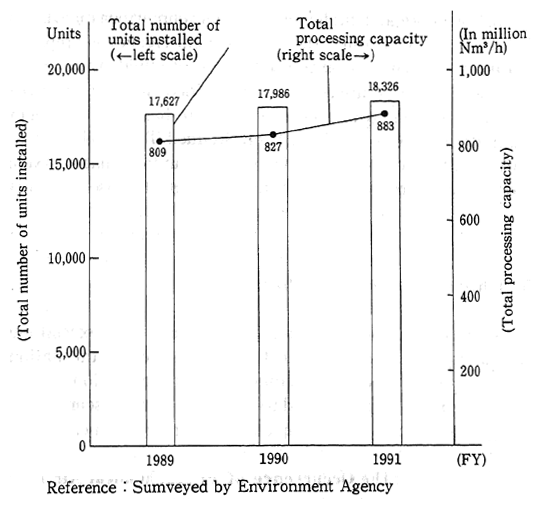
Emission standards for soot and dust are determined by the type and size of facilities. In areas that have a high concentration of facilities and significant levels of pollution, special and more-strict emission standards have been established for new and modified facilities. Countermeasures targeted at soot emission sources include the installation of soot and dust collecting equipment and controlled burning to prevent incomplete combustion (Figure 6-2-3).
For various types of regular particulate matter (dust) other than "special dust" (asbestos is designated as such under an administrative ordinance [refer to 6 (1) Asbestos Countermeasures]), standards have been established for the layout, use, and management of general particulate generating facilities, such as stockpiles and conveyers.
Fig. 6-2-3 Soot and Dust Collecting Facilities by Fisical Year
Reference : Sumveyed by Environment Agency
6-2-4 Measures Against Air Pollution Caused by Studded Tires
In recent years, large quantities of dust arising from motor vehicles equipped with studded tires driving on roads in cold and snowy regions (hereafter called studded tire dust) have become a serious social problem not only because of a deterioration of the living environment, but also because of concerns about adverse effects on people's health. In response to this situation, the Studded Tire Regulation Law was announced and put into force in June 1990. This law stipulates that users have a responsibility to prevent such dust from being generated. Also under this law, the use of studded tires is restricted to areas approved by the Minister of the Environment Agency. As of March 1994, the use of studded tires had been approved for 18 prefectures and 802 municipalities. In particular, on April 1, 1993, the use of studded tires by trucks and large vehicles was restricted to these areas.
The same law also stipulates that the national and local governments must promote and implement various countermeasures to prevent studded tire dust. As a result, the Environment Agency is preparing and distributing pamphlets discouraging the use of studded tires and maps showing the designated areas to which studded tires use is restricted.
At the regional government level, there has been a convening of the Administrative Liaison Council on Studded Tire Problems, formed by 23 affected prefectures, which is carrying out information exchanges and promoting various measures that encourage the use of nonstudded tires.
6-2-5 Photochemical Air Pollution
Concentrations of photochemical oxidants still exceed environmental quality standards in almost every district of the nation, and warnings are issued depending on meteorological conditions. Because of this, in the future, there is the need to more accurately ascertain changes in the degree of pollution and implement appropriate measures.
(1) Measures at the Occurrence of Photochemical Air Pollution
To obtain meteorological data needed to decide whether to issue photochemical air pollution warnings, the Environment Agency conducts meteorological observations at four points on Tokyo Bay and Osaka Bay, where photochemical air pollution tends to occur in summer, and provides meteorological information to related local governments. Using 19 meteorological observation stations across the nation, the Meteorological Agency analyzes and forecasts meteorological conditions under which photochemical air pollution tends to occur and issues reports to local governments. At the same time, when the need arises, the Meteorological Agency announces to the public meteorological information concerning photochemical air pollution. Based on this information and the data from monitoring stations, local governments issue warnings in accordance with the Procedures on Measures at the Occurrence of Photochemical Air Pollution; ask parties responsible for soot and smoke emissions to reduce emissions; call on users of motor vehicles to voluntarily refrain from making unnecessary trips ; and conduct public information activities and establish health preservation measures for residents.
(2) Measures to Reduce Emission of Hydrocarbons
(a) Measures for Restrictions on Emissions of Hydrocarbons from Stationary Sources
In July 1982, the Environment Agency produced a policy document entitled Promotion of Measures Against Hydrocarbons for the Prevention of Photochemical Air Pollution. This policy document took into consideration the results of deliberation on the state of hydrocarbon emissions and an evaluation of emission prevention technologies by the Committee For Countermeasures Against Stationary Sources of Hydrocarbon Emissions. In accordance with this policy document, the Environment Agency made necessary requests to local governments and other related institutions for assistance in promoting measures to reduce hydrocarbon emissions.
(b) Reduction in Hydrocarbon Emissions from Motor Vehicles
In 1970, controls were implemented on hydrocarbons emitted from motor vehicles. For gasoline- and LPG-fueled passenger cars, emissions levels per vehicle have been reduced 92% from levels prior to the implementation of controls.
(3) Promoting Surveys and Studies of Photochemical Air Pollution
Photochemical air pollution is an extremely complex phenomenon that spreads widely. Surveys of photochemical air pollution are carried out in a broad range of areas, including on the mechanisms of photochemical reactions, such meteorological effects as drift and dispersion, the state of emissions of causative substances, photochemical air pollution forecasting models that incorporate these factors, and the effects of photochemical oxidants on plants.
6-2-6 Other Types of Air Pollutants
(1) Measures Against Asbestos
Although asbestos is used in many types of products because of its superior heat resistance and other properties, it is carcinogenic and therefore has an adverse effect on people's health. In 1987, the Environment Agency began surveys on asbestos source countermeasures and on environmental concentrations of asbestos around areas that are sources of asbestos emissions, including factories manufacturing products containing asbestos. The results of this survey were evaluated by the Asbestos Countermeasures Committee, made up of specialists. The committee concluded that there is a need to reduce concentrations of asbestos to the level the World Health Organization (WHO) describes as being so low that the risks of lung cancer and malignant mesothelioma are negligible.
Taking these factors into consideration, in March 1989, the Central Council for Environmental Pollution finished a report on appropriate basic systems for preventing air pollution for asbestos from factories manufacturing products containing asbestos. Based on this report, the Law for the Partial Revision of the Air Pollution Control Law was announced in June 1989 and implemented on December 27 of the same year.
The revised law defined asbestos and other particulate matter likely to damage people's health as "special particulates." At the same time, the law defined facilities that generate special particulates as "special particulates discharging facilities." As for measures to control emissions of special particulate matter, the law ordered planning changes and documentation showing that emission control equipment was installed; required improvements in facilities and made mandatory the adherence to emission control standards; and established provisions for monitoring concentrations of special particulate matter. The Environment Agency is also carrying out surveys on the development and greater use of asbestos substitutes.
(2) Countermeasures Against Harmful Substances
Under the Air Pollution Control Law, in addition to nitrogen oxides, (1) cadmium and its compounds, (2) chlorine and hydrogen chloride, (3) fluorine, hydrogen fluoride, and silicon fluoride, and (4) lead and lead compounds are controlled as "harmful substances" emitted from soot and smoke emitting facilities. Because harmful substances originate in certain raw materials, emission standards for the previously mentioned four categories of harmful substances are applicable only to a limited type of soot emitting facility depending on the type of harmful substance. Particulate matter caused by other substances from soot and smoke emitting facilities are controlled simply as "soot and dust."
(3) Measures Against Nonregulated Matter
(a) Countermeasures for Nonregulated Substances
From the perspective of preventing environmental pollution, studies are being carried out on emission concentrations and the environmental impact of possible toxic substances. The Committee for Measures Against Chloriscated Organic Compounds, which was established to prevent pollution caused by trichloroethylene and tetrochloroethylene, evaluated the health effects and discussed measures for emission controls for these substances. In March 1993, the group issued a report on the results of its evaluations. Taking into consideration the contents of this report, the Environment Agency formulated its Environmental Guideline the following April. With the aim of setting desirable levels for the protection of human health, the Environmental Guideline established (provisional) average annual values of under 250 fハg/M3 trichloroethylene emissions and below 230 fハg/M3 tetrochloroethylene. It also formulated its Provisional Countermeasure Guidelines for Emissions of Trichloroethylene and Tetrochloroethylene and ascertained the state of such pollutants through prefecture governors and mayors of cities subject to government ordinances. The group also examined methods for treating a wide range of substances.
(4) Activities for Dissemination and Propagation
Residents should play an increasingly larger role in helping to preserve the local environment. To increase opportunities for residents to come in contact with the environment and to encourage people to reassess their views on the environment, a nationwide "star watching network" program was started in fiscal 1988 by the Environment Agency. In the summer of fiscal 1993, 5,732 individuals from 245 groups across Japan (in 44 prefectures, 7 cities designated by government ordinance, and 201 municipalities) participated in this star watching program. This program has been instrumental in increasing public awareness of the importance of protecting the Earth's atmosphere.
Also, beginning in fiscal 1989, events called Checks on the Ability of Trees to Purify the Atmosphere were held. Targeted primarily at junior and senior high school students, these events aim to promote a better understanding of the ability of trees to cleanse the atmosphere. In fiscal 1993, 6,000 students from 490 schools participated in these events.
6-3 The Establishment of a Monitoring and Surveillance System
Continuous atmospheric monitoring is necessary to determine whether environmental standards are being attained and to establish various measures for preventing atmospheric pollution. Continuous monitoring also serves as the foundation for administering atmospheric protection measures.
6-3-1 National Air Monitoring Network
(1) The Location of National Air Monitoring Stations
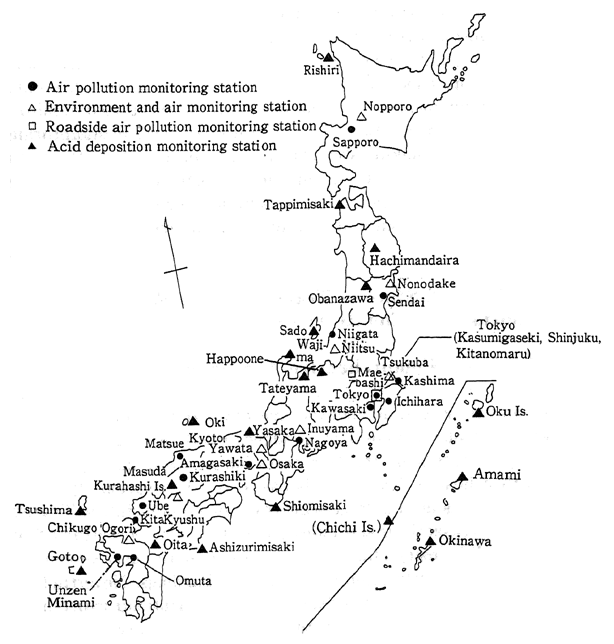
National air pollution monitoring stations and environmental atmospheric monitoring stations have been established at the countrywide level to ascertain the state of air pollution and to obtain basic data needed to implement measures for protecting the environment. The location of the air monitoring network is shown in Figure 6-3-1.
To better determine the state of pollution in principal regions, air pollution monitoring stations have been established in 15 locations across the nation. Also, eight environmental atmospheric stations have been established to ascertain the state of pollution in areas other than the already-polluted regions of Japan's principal plains. Each monitoring station features various types of monitoring equipment for continuous monitoring of such pollutants as sulfur dioxide, nitrogen oxides, and suspended particulate matter. These stations are also analyzing the metal components of suspended particulate matter and suspended dust. Several environmental atmospheric stations are also monitoring hydrogen sulphide, ozone, and mercury. National automobile exhaust monitoring stations have been set up at three locations in Tokyo and also in Maebashi, Gunma Prefecture.
(2) National Acid Rain Monitoring Stations
To upgrade the acid rain monitoring system, in 1987 acid rain monitoring equipment was installed at the 23 air pollution monitoring and environmental atmospheric stations. In 1989, acid rain monitoring stations were first established to analyze pH in precipitation and the elements of acid rain. In fiscal 1993, 14 acid rain monitoring stations were in operation.
Fig. 6-3-1 Location of National Air Monitoring Stations
6-3-2 Regional Air Pollution Monitoring Systems
In accordance with the Air Pollution Control Law, the continuous surveillance and monitoring of air pollution is conducted at the local level under the auspices of governors of prefectures and the mayors of administrative ordinance-designated cities. Monitoring is also carried out by other local government bodies. Moreover, sulfur dioxide concentrations and the volume of fuel use at pollutant sources are continuously monitored. Also, some local government bodies are using telemetry systems to transmit the results of monitoring to a central surveillance center. The national government is also providing prefectures and administrative ordinance-designated cities with support for installing the necessary equipment to carry out the previously mentioned monitoring. The government is also striving to raise the level of monitoring technologies and is making well-planned and concentrated efforts to enhance the efficiency of the monitoring system, while modernizing local environmental-pollution research facilities to gain a better understanding of the current state of harmful chemical matters.
6-4 The Present State of Transportation-Related Pollution and Countermeasures
6-4-1 Taking a Comprehensive Approach
(1) Japan's transportation network has developed quickly during the country's period of rapid postwar economic growth. Although advances in and diversification of the transportation network have provided society with a host of benefits, this has also led to various types of pollution in regions around large-scale transportation facilities. Traffic volume has increased in major cities due to the high concentration of population and industry, the trend toward a more service-oriented economy, and the construction of commercial buildings. Nevertheless, the various components of the urban transportation infrastructure have often been established in a haphazard manner. This has resulted largely from insufficient consideration being given to preventing environmental pollution through such measures as the better coordination of traffic facilities and the use of surrounding land areas and placing restrictions on traffic volume and various types of transportation systems. This lack of consideration has complicated the task of solving traffic problems.
(2) Principal environmental problems resulting from road traffic are emissions of exhaust gas as well as noise and vibrations caused by the operation of motor vehicles. In the future, it will be necessary to make further efforts and take a comprehensive approach to implementing various countermeasures--which will be detailed later--for exhaust emissions of nitrogen oxides as well as for noise and vibrations.
(3) For aircraft noise, with demand for air transportation expected to grow, it will be necessary to even more vigorously promote measures against noise sources and to improve the structure of airports with the aim of meeting environmental quality standards. For the time being, particularly in areas where such measures alone will not likely enable the attainment of environmental quality standards, it is necessary to take such noise-prevention steps as the construction of sound-proof homes. At the same time, in those areas where noise pollution is particularly acute, it is necessary to implement measures to promote systematic land use around airports that would involve shifting to uses of land in which the effects of noise pollution would be minimized while restricting the construction of new residential dwellings.
(4) To attain environmental standards for noise and vibration caused by Shinkansen bullet trains, there is a need to take a comprehensive approach that includes continuing to implement basic measures for vibration and noise sources, as well as measures for the prevention of hazards and the institution of land-use measures in surrounding areas. In particular, the attainment of noise and vibration environmental standards along the Tokkaido, Sanyo, and Joetsu Shinkansen bullet trains has lagged, and therefore the following measures should be taken for a speedier attainment of these environmental quality standards:
a. Continue with basic measures against noise sources.
b. In areas where environmental quality standards are exceeded, promote noise-proofing at nearby residences.
c. Develop and use technologies for reducing noise levels
d. Promote proper land use in areas along railway lines (put restrictions on land use for new dwellings and use this land for public facilities that are less likely to be functionally affected by noise)
(5) Nitrogen oxides and sulfur oxide exhaust from ships are not controlled at present. However, studies on specific international control measures are under way at the International Maritime Organization (IMO) with the aim of adopting some measures as soon as possible after 1995. In Japan, it might become impossible to ignore air pollution caused by ships in cities with big harbors. Therefore, while ascertaining the present state of emissions from ships and trends in emission reduction technologies, methods that accommodate international trends are being examined.
6-4-2 Steps Being Taken Against Road Traffic Pollution
(1) The Current Road Traffic Pollution Situation
(a) Japan's advanced socioeconomic development has been accompanied by a quickly rising concentration of population and industry in urban areas and a sharp upswing in motorization. To this end, the number of registered motor vehicles rose from 21.22 million, at the end of 1971, to 64.5 million, at the end of fiscal 1992, an approximately threefold increase (Figure 6-4-1).
Fig. 6-4-1 Trends in Automobile Ownership
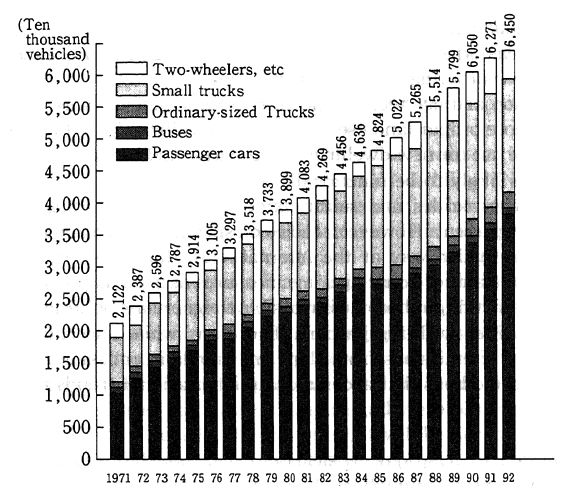
Notes : 1. Prepared on the basis of the Ministry of Transport's
"Statistical Yearbook on Land Transportation"
2. The Passenger cars include light passenger cars.
3. The Small trucks include light trucks.
At present, the trend toward motorization shows no signs of abating. Environmental pollution, noise, and vibrations caused by vehicular traffic have become particular problems in major cities and along trunk roads which form traffic arteries in urban regions.
(b) The results of monitoring by road-side air pollution monitoring stations are shown in Chapter 6-2-1. There are still many monitoring stations, primarily in major urban areas, where concentrations of nitrogen dioxide exceed environmental quality standards, suggesting that improvements are lagging (Table 6-4-1).
Table 6-4-1 The Attainment of Environmental Quality Standards for Nitrogen Dioxide at Stations in Major Urban Areas Designated as Special Areas under the AutomobileNOx Act (Fiscal 1992)

Note : Surveyed by the Environment Agency.
(c) In 1992, to ascertain the state of vehicle noise pollution within the previously mentioned regions, monitoring was carried out at points thought to have average volumes of noise, as well as at points with frequent noise pollution problems. The results of monitoring at 4,511 monitoring stations in Japan's prefectures, cities, towns, and other areas are shown in Figure 6-4-2. (This includes only those areas designated as special regions under the Noise Restriction Law.)
The rates of attainment of environmental quality standards were the lowest in category 2 areas residential areas where it is necessary to maintain quiet. Of the 2-284 monitoring points in category 2, 1,634 points (71.5%) did not attain environmental quality standards in any four-hour period, and 1,003 points (43.9%) exceeded required limits. (Figure 6-4-3)
Figure 6-4-4 shows attainment rates by time of day. At the 4,511 monitoring points, 3,548 monitoring points (78.7%) did not attain environmental quality standards during evening hours, which had the highest nonattainment rate. The late-night time period had the highest rate for exceeding noise limits, with noise limits being exceeded at 1,135 points (25.2%). Because the monitored times of year and times of day do not necessarily correspond depending on the year, simple comparisons cannot be made. However, looking at 2,200 monitoring points where monitoring has continued for five years, 1,073 (89.4%) did not attain environmental quality standards, and the high rate of nonattainment is continuing. Noise is an especially significant problem in large urban areas and in urban areas along trunk roads which form arteries for vehicular traffic.
Fig. 6-4-2 Attainment of the Environmental Quality Standards and Excess rate over the Required Limits (FY 1992)
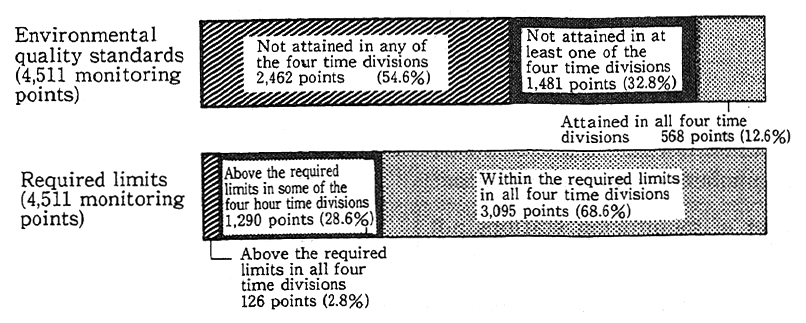
Note : Sumveyed by the Environment Agency
Fig. 6-4-3 Attainment of the Environmental Quality Standards and Excess rate over the Required Limits by Designated Area (FY 1992)
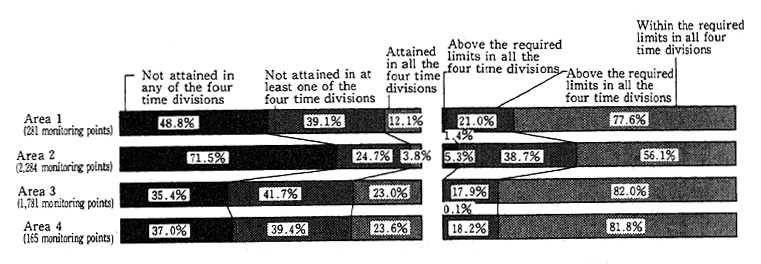
Note: Surveyed by the Environment Agency
Fig. 6-4-4 Attainment of the Environmental Quality Standards and Excess rate over the Required Limits by Four Time Divisions (FY 1992)

Note: Surveyed by the Environment Agency
(2) Countermeasures for Pollution Caused by Road Traffic
a. Environmental Quality Standards and Laws
Environmental quality standards for air pollution and noise are determined in accordance with the provisions of the Environment Basic Law. To achieve these standards, comprehensive measures are being implemented to prevent road traffic pollution.
The Air Pollution Control Law and the Noise Regulation Law stipulate that, to reduce noise and exhaust by improving the structure of vehicles, the Minister of the Environment Agency must establish permissible limits for the volume of vehicle exhaust and noise emissions. At the same time, the Minister of Transport, acting in accordance with the Road Transportation Vehicle Law, must place emphasis on ensuring that these permissible standards are met when determining all necessary matters related to restrictions for road transportation vehicle safety standards.
When monitored levels exceed certain limits, prefectural governors require the Prefectural Public Safety Commissions to take measures as stipulated by the Road Traffic Law. Also, when there is a recognized need, prefectural governors can express their views to road management authorities on matters related to improvements to roads and reductions in concentrations of vehicle exhaust and noise volumes. (Table 6-4-2).
Table 6-4-2 Demands and Opinions on Vehicle Noise under the Noine Regulation Law

Note : Surveyed by the Environment Agency
The Law Concerning Special Measures for Total Emission Reduction of Nitrogen Oxides from Automobiles in Specified Areas (hereafter called the Automobile NOx Law) for reducing total NOx emission from automobiles in special areas is aimed at achieving the environmental quality standards for nitrogen dioxide and protecting the health of citizens. To achieve these objectives, a Basic Policy for NOx reduction and NOx Emission Reduction Plans have been formulated to reduce the volume of NOx emission from vehicles in specified areas where pollution caused by such vehicle emissions is a conspicuous problem. Special NOx emission standards have been established for buses and trucks that are registered in these areas. There are also measures that aim for the rational use of vehicles targeted at businesses.
Under the Vibration Regulation Law, when vibrations from road traffic exceed a required limit and it is recognized that these vibrations are having serious adverse effects on the living environment, the governor of a prefecture or city can request the road management authorities to take such steps as repaving, maintaining, and repairing the relevant section of the road. Also, the prefectural and city governors can require the Prefectural Public Safety Commission to take appropriate measures as stipulated under the Road Traffic Law.
Over the past several years, only one demand (in fiscal 1991) for addressing road traffic vibration was made to road managers and the Prefectural Public Safety Commission