Quality of the Environment in Japan 1994
Chapter 1. In Search of Environmentally Friendly Lifestyles
Most people living in contemporary Japan are enjoying quite affluent lifestyles.
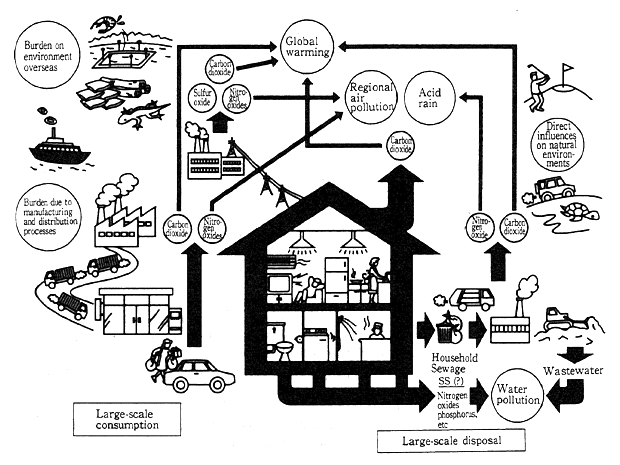
As described in the introduction, people live their lives amid systems for the recycling of materials and energy. However, contemporary Japanese lifestyles involve the consumption of large quantities of materials and energy taken from the natural environment and the return of large quantities of waste water, waste gases, and refuse back to the natural environment. These large-scale consumption and disposal processes place a heavy burden on the environment that supports our existence.
The burden contemporary lifestyles impose on the environment is illustrated in a somewhat simplified form in Figure 1-1-1, and the concrete environmental impact of individual aspects of people's daily lives is a main subject of this chapter. The chapter also presents examples of the activities of the growing number of private citizens who are working to modify modern lifestyles to reduce their environmental impact. Finally, methods of promoting environmentally friendly lifestyles and behavior are considered along with strategies for creating a new environment-friendly society in which environmentally friendly lifestyles and behavior are the norm.
Fig. 1-1-1 Environmental Burdens Due to Modern Lifestyles
1-1 The Burdens Modern Lifestyles Impose on the Environment
1-1-1 Changes in Consumption Behavior
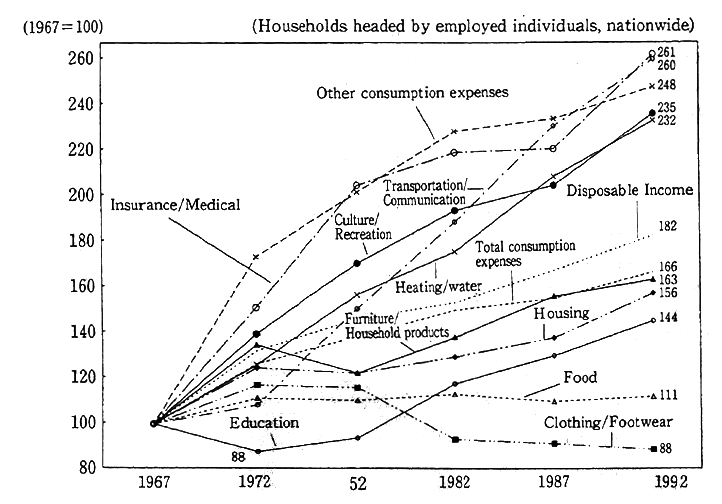
A review of the changes that have taken place in household consumption behavior over the past 25 years is useful for putting modern lifestyles in perspective. As shown in Figure 1-1-2, average household expenditures have increased approximately 60% during this period, with particularly rapid growth in such expense categories as insurance/medical and transportation/communication (up about 160%), culture/recreation and heating/water (up about 130%), and furniture/ household products (up about 60%.) The population's desire for convenience and comfort is reflected in such developments as the rise in automobile-related expenses that has accompanied the rising ownership of automobiles, in the growth in consumer durables-related expenses that has accompanied the increase in the size and sophistication of consumer durable goods, and in the rise in heating-and water-related expenses that has accompanied the stepped-up consumption of energy. In addition, within the culture/recreation category, there has been a sharp surge in expenses related to hotel accommodations and package tours, a trend that illustrates the effects of the population's greater desire for leisure.
Fig. 1-1-2 Lifestyle Changes as Reflected in Household Expenditures
Notes : 1. Figures were calculated based on information from the
Management and Coordination Agency, Survey of House-hold Expenditures (Kakei Chosa) and Consumer Price Index (Shohi-sha Bukka Shisu)
2. Real consumption values are calculated by adjusting nominal consumption values for changes in the consumer price index.
Source : Economic Planning Agency, Annual Report on the National Life (Kokumin Seikatsu Hakusho,)
Changes have also taken place in how people allocate their time. The amount of time spent working has tended to decline. The 44-hour work week was introduced in most work places in April 1989, and the average amount of time worked annually has fallen from 2,111 hours in 1978 to 1,958 hours in 1993. The decrease in work hours and the introduction of laborsaving devices in homes have increased the amount of free time available for watching television, reading newspapers, and engaging in other leisure activities. According to surveys on the population's use of time conducted by the Japan Broadcasting Corporation (NHK) in 1985 and 1990, the average amount of free time enjoyed by Japanese individuals rose significantly during the five-year period through 1990, from 3 hours 51 minutes to 4 hours 7 minutes on weekdays ; from 4 hours 39 minutes to 5 hours 8 minutes on Saturdays ; and from 6 hours 8 minutes to 6 hours 22 minutes on Sundays.
Regarding daily routines, the NHK surveys indicate that the number of people that stay up past 11:00 p.m. rose from 24% in 1980 to 39% in 1990, while the number of people that stay up past midnight rose from 8% in 1980 to 13% in 1990. Thus, it appears that there is a growing share of nocturnally oriented people among the population.
Many of these changes in the population's preferences and habits -such as the rise in the use of automobiles for greater convenience and comfort, more participation in leisure activities along with the increase in free time, and the growth in the use of electricity for lighting due to the tendency to stay up later-directly augment the burden borne by the environment. The environmental impact of changes in the population's preferences and habits during recent years is the subject of the following section.
1-1-2 Environmental Burdens Resulting from Daily Life
(1) Consumption of Materials and Energy
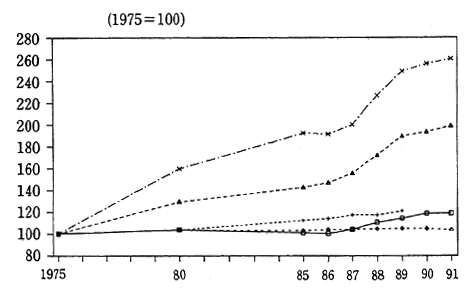
In the course of their everyday lives, Japanese people consume large quantities of materials and energy. For example, the Japanese population's annual per capita energy consumption on an oil-conversion basis is 3.54 tons of oil. While only 76.3% of the OECD average of 4.81 tons, the Japanese figure is more than twice the worldwide average of 1.52 tons. Japan's annual per capita paper consumption is 234.7 kilograms, or more than five times the world average of 44.5 kilograms. As shown in figure 1-1-3, Japan's per capita consumption of energy, paper, plastic, and other materials has risen over the years, although the rise clearly accelerated during the period of strong economic expansion during the latter half of the 1980s and decelerated from the time of the economic downturn in the early 1990s.
Fig. 1-1-3 Per Capita Consumption of Materials and Energy
Note: Symbols for consumption volumes :
![]() Energy consumption + Household water consumption
Energy consumption + Household water consumption
![]() Calorie consumption
Calorie consumption ![]() Paper consumption
Paper consumption
![]() Plastic consumption
Plastic consumption
Sources : Prepared from various materials, including Comprehensive Energy Statistics (Sogo Enerugi Tokei) Japan 's Water Resources (Nippon no Mizu Shigen), Agriculture White Paper (Nogyo Hakusho), Paper and Pulp Statistics (Kami-Parupu Tokei), and information from the Japan Plastic Industries Association.
The consumption of large volumes of materials has increased the convenience and material affluence of people's lifestyles. On the other hand, the consumption of large volumes of materials also accelerates the rate at which materials must be obtained from the environment, giving cause for concern that sustaining such resource depletion over the long term might be impossible. In addition, the consumption of materials imposes numerous secondary environmental burdens, such as those related to production, distribution, use, and disposal processes.
As discussed in last year's Environmental White Paper, Keio University's Industrial Research Center and other research facilities have calculated the amount of carbon dioxide generated in manufacturing and distribution processes prior to the receipt of a given product by the ultimate consumer. Using the Keio results and other information, to determine the CO2 impact of some of the products that comprise the largest share of household expenditure on food products, one finds that the consumption of a single kilogram of meat causes the generation of 0.8 kilogram of carbon dioxide on a carbon-conversion basis. The number of kilograms of carbon dioxide generated due to consumption of a kilogram of other food products is 2.4 for tuna, 0.2 for vegetables, and 1.1 for salt. It is estimated by the National Environmental Research Center that the production and distribution of a single automobile generates 1,695 kilograms of carbon dioxide.
As Japan's dependence on foreign sources of products and materials increases, a growing share of the environmental burdens related to manufacturing processes for products consumed in Japan is borne overseas. For example, shrimp cultivation in Southeast Asia has been accompanied by such problems as the destruction of mangrove forests, the deterioration of water quality, and land subsidence due to excessive pumping of groundwater. Similarly, banana cultivation has had considerable impact on the environment as a result of the use of large quantities of agricultural chemicals.
Turning to household energy use, one finds that the combustion of such fossil fuels as kerosene, natural gas, and gasoline burdens the environment with emissions of carbon dioxide and nitrogen oxides, while electricity use also causes emissions of carbon dioxide and nitrogen oxides from thermal power plants. Per capita generation of carbon dioxide (carbon conversion basis) was 2.61 tons in fiscal 1991, which, according to estimates by the Environment Agency, was about twice the corresponding figure for fiscal 1966 and 14.5% higher than the figure for fiscal 1981.
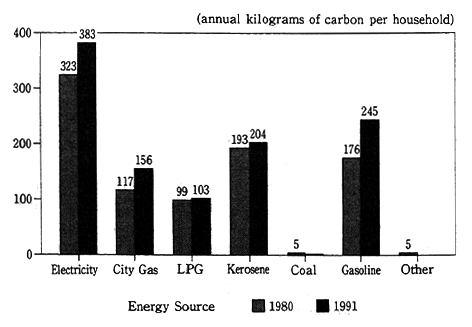
The Environment Agency has also estimated the composition of carbon dioxide emissions arising from the various daily energyconsuming activities of an average household (Figure 1-1-4). Focusing on types of energy sources, the agency's calculations indicate that during the past decade the amount of carbon dioxide generation due to household use of gasoline and electricity has risen relatively quickly. By type of activity during the past decade, it appears that there have been sharp rises in carbon dioxide emissions due to the use of electricity for motive power in equipment and lighting fixtures (up 24%), automobiles (up 39%), and air-conditioning units (up 50%).
Fig. 1-1-4(a) Household Carbon Dioxide Generation by Type of Product/Activity
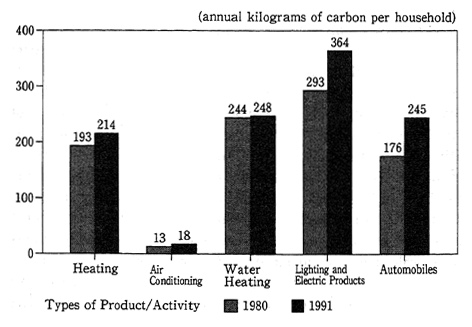
Fig. 1-1-4(b) Household Carbon Dioxide Generation by Type of Energy Source
Source: Environment Agency estimates
Fig. 1-1-5 Progress in Reducing Per Unit Energy Consump-tion of Principal Household Appliances
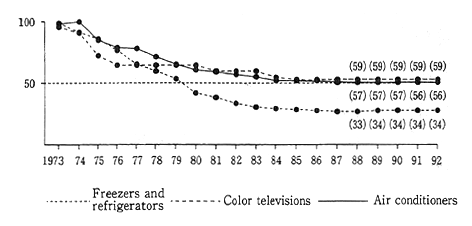
Note : 1. Figures for freezers and refrigerators represent an index of average monthly electricity consumption for two-door, 170-liter-class freezer-refrigerators (1973 = 100).
2. Figures for color televisions represent an index of electric-ity consumption for 19-and 20-inch units (1973 = 100).
3. Figures for air conditioners represent an index of electricity consumption for room air conditioners comprised of an interior and an exterior unit (1973 100) Source : Consumer Electric Product Manufactures Association (Kaden Seihin Kyokai)
Fig. 1-1-6 Ownership of Household Electrical Appliances
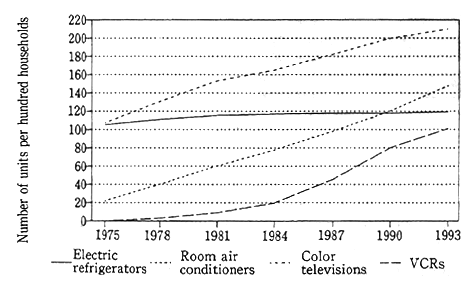
Source : Figures were calculated based on Economic Planning Agency, Suruey of Consumption Trends (Shohi Doko Chosa)
Fig. 1-1-7 Growth in Size and Performance of Household Electrical Appliances
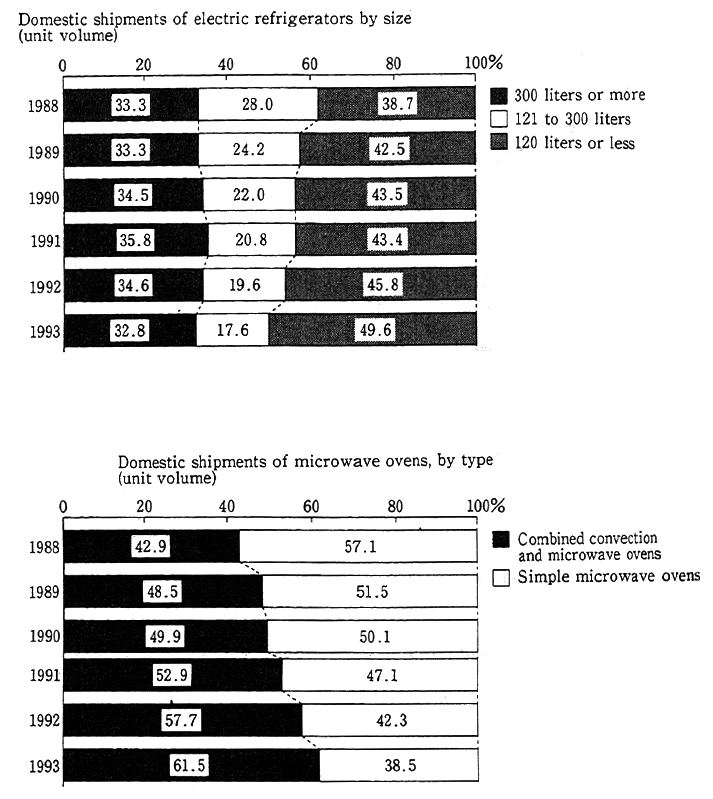
Source : Electric Product Manufacturers Association, Japan Electric Equipment Industry Association
One factor behind the rise in carbon dioxide emissions due to household activities is growth in the size, sophistication, and ownership rates of electrical appliances, automobiles, and other consumer durable goods. Regarding electrical appliances, for example, per unit energy consumption has fallen substantially since the first oil crisis, but improvement in efficiency has slowed in recent years (Figure 1-1-5). On the other hand, there has been a striking rise in the ownership of many electrical appliances products, with many households having two or more refrigerators, air conditioners, and color televisions. For several types of product, there appears to have been an accelerating shift from ownership of one unit per household, to ownership of one unit per household member (Figure 1-1-6). In addition, there is an increasing tendency to select relatively large, high-performance models, which generally consume more electricity (Figure 1-1-7).
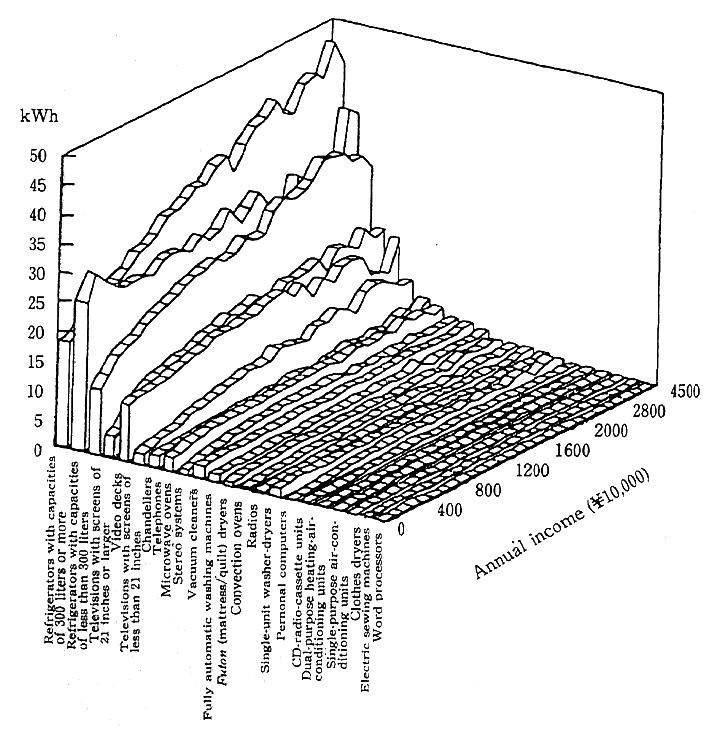
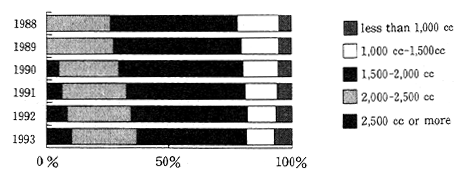
It is noteworthy that the tendency to own larger applainces and multiple units per household increases in step with income levels. In other words, as people become more affluent, they tend to own more appliances. According to a survey by the National Environmental Research Center, high-income households generally use refrigerators with capacities of 300 liters or more and televisions with screen sizes of 20 inches or more and also tend to use VCRs and other products that constantly consume electricity, thus causing these households to consume high volumes of energy (Figure 1-1-8). In addition, there is a general preference for automobiles with large engine displacements (Figure 1-1-9). In sum, although technology has made it possible to reduce the per unit environmental burden attributable to many types of products, this reduction has been canceled out by lifestyle preferences that entail increasing consumption volumes and purchases of large, luxury-type products, thus giving rise to an overall pattern of steady growth in carbon dioxide emissions.
Fig. 1-1-8 Energy Consumption Due to Household Electrical Appliances (per household, in a single autumn month)
Source : National Environmental Research Center
Fig. 1-1-9 Exhaust Emissions by Size of Automobile
Source : Prepared based on materials from the Automobile Inspection and Registration Association
These trends, while affected by consumer preferences, are largely determined by a variety of economic factors. With regard to automobiles, the accelerated growth in real disposable income and the wealth effect due to the inflation of asset prices during the bubble economy period supported an increase in purchases of automobiles while also causing a rise in the share of relatively large automobiles with engine displacements of more than 2,000 cc (which bear a more prestigious 33 or 34 licence plate number). Other factors behind this trend include the elimination of a tax on luxury products, the revision of the automobile taxation system, and the reduction of insurance premiums, all of which reduced the effective expense differential between small and large vehicles. According to a survey conducted by the Japan Automobile Industry Association, since the nature of tax reforms became clear, the share of newly purchased cars with engine displacements of over 2,500 cc and 3,000 cc and bearing 33 or 34 licence plates has risen to more than 40% and 30%, respectively.
Also contributing to the rise in energy consumption are changes in the way people make use of energy consuming durable goods in line with their desire to adopt more-affluent lifestyles. For example, according to a survey by the Energy Saving Center, the share of households that set their air-conditioning equipment at temperatures of more than 28 declined from 48.3% in fiscal 1992 to 39.4% in fiscal 1993. Regarding interior lighting equipment, for interior design reasons, households prefer lighting fixtures that use bulbs rather than flurorescent tubes, but these consume greater amounts of power. There is also a trend to meet the needs of the growing share of elderly people in the population by creating brightly lit living environments that are more comfortable for people with deteriorating eyesight.
(2) Disposal
Items that people use in their daily lives that are no longer needed are disposed of. The daily per capita weight of refuse rose from 1,007 grams in 1986 to 1,118 grams in 1991. The incineration of refuse generates carbon dioxide and nitrogen oxides, while the disposal of refuse in landfills creates a generally unpleasant environment in the vicinity of the landfills and also places a burden on the environment due to leaching of waste liquids. The composition of refuse has become increasingly diverse, with a growing share of plastics and other materials that do not easily decompose in the natural environment. In addition households dispose of many products that contain environmentally harmful substances, such as refrigerators that contain CFCs, electric products that incorporate PCBs as electric insulators, and batteries that contain mercury.
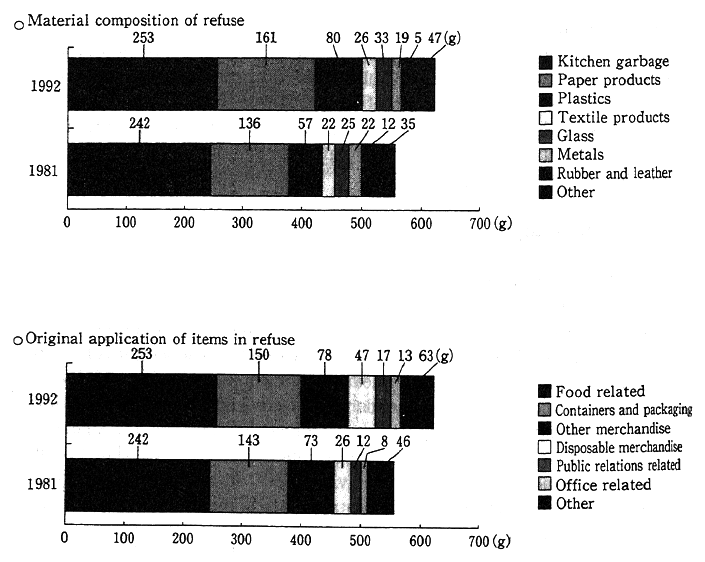
The municipal government of Kyoto has conducted a survey on the composition of household refuse that offers insight into disposal patterns. Kyoto's total refuse volume is increasing, and the daily per capita weight of Kyoto residents' refuse rose from 551 grams in fiscal 1981 to 622 grams in fiscal 1992. About 80% of the refuse is composed of kitchen garbage, paper products, and plastics. Consumption of paper and plastic products has grown rapidly in recent years, and the shares of refuse composed of these products have increased to nearly 20% and 40%, respectively. Analyzing refuse by the original application, about 40% is food related and 20% is container and packaging related. Growth in the volume of various types of refuse during the period from fiscal 1981 to fiscal 1992 was 5% in the case of containers and packaging, 6% for merchandise, more than 40% for direct-mail marketing materials and other materials used for advertising, and almost 80% for time saving and laborsaving disposable products, such as diapers and cigarette lighters (Figure 1-1-10).
Fig. 1-1-10 Composition of Household Refuse
Source : Prepared based on materials from the Kyoto Municipal Sanitation Department
Looking at the composition of kitchen garbage, one finds that almost 40% is left-over food from meals, while 14% is food products that were disposed of without being used at all. In addition to whole vegetables and fruit, considerable amounts of packaged food products are thrown away while still in the original packaging.
The daily per capita weight of Kyoto residents' kitchen garbage declined from 262 grams in fiscal 1981 to 244 grams in fiscal 1992. Because of the increasing popularity of prepared food products and eating out, the share of kitchen garbage composed of cooking scraps has fallen from 59.8% to 52.9% while the share of table scraps has risen from 27.8% to 37.5% (Table 1-1-1).
Table 1-1-1 Changing Composition of Kitchen Garbage (Wet Weights)
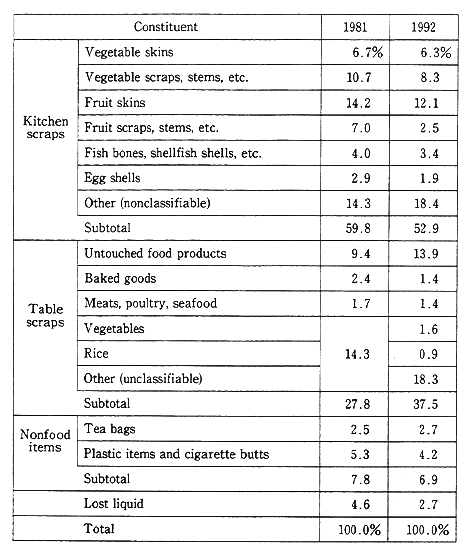
Notes : Figures were calculated based on a sampling of 100 bags of garbage, which held the garbage of about 50 households. The total weight of the bags, which were collected from the same district at both survey times, was 147.7 kilograms on September 21, 1981, and 116.8 kilograms on October 15, 1992.
Source : Kyoto Municipal Sanitation Department, Takatsuki
The results of the survey reflect changes in the Japanese population's food consumption patterns: growth in leftover table scraps, a shrinking in the consumption/disposal cycle for food products, and a rise in the amount of containers and packaging used. These lifestyle -related changes in the volume and composition of garbage are one cause of the increased burden being placed on the environment.
(3) Water
The Japanese population's daily lifestyles entail the use of water for various applications-such as those related to the kitchen, the bathroom, washing machines, and flush toilets-and all this water is disposed of as household sewage. As this sewage contains diverse organic materials and nutrient salts, it can cause organic pollution and eutrophication. A large share of environmental burdens due to these problems is attributable to household sewage. In Tokyo Bay as a whole, for example, household sewage was responsible for about 69% of the chemical oxygen demand (COD) and 58% of the phosphorus in 1989.
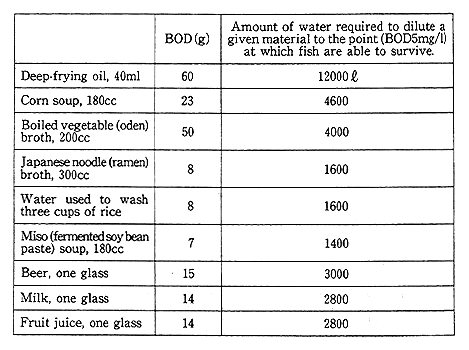
Table 1-1-2 BOD Load Resulting from Kitchen Waste Products
Source : National Environmental Research Center
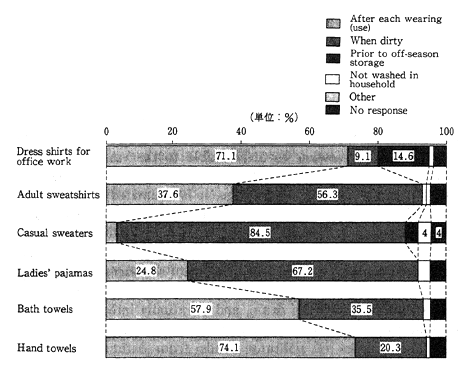
Fig. 1-1-11 Standards for Determining Times of Laundering
Source : Kobe Cooperative Society (?), Lifestyle Monitor Questionnaire (Kurashino Monitaa Ankeeto), 1993
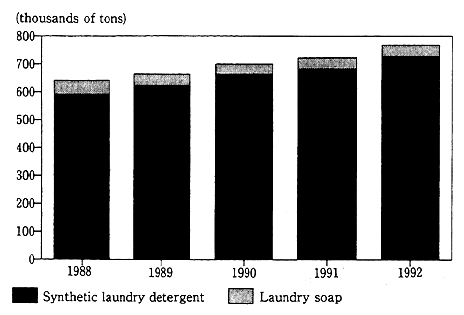
Fig. 1-1-12 Sales of Laundry Detergent for Household Use
Source : Prepared based on materials from the Japan Soap and Detergent Industry Association
According to an Environment Agency survey of the biochemical oxygen demand (BOD) load attributable to household sewage, 30% (BOD13g) was due to physiological waste products and 70% (BOD30g) was due to various other waste products contained in household sewage. The sanitary treatment of physiological waste products is required by law, and such products are not released directly into the environment. Accordingly, an overwhelmingly high share of the environmental burden due to household sewage is attributable to the various other waste products. Of the environmental burden due to the various types of other waste products in household sewage, it is estimated that 57% results from kitchen wastewater, 30% from bathtub wastewater, and 13% from laundry wastewater and other sources. The size of the share resulting from kitchen wastewater reflects the fact that the process of preparing meals often leads to the use and disposal of seasonings, oils, and other substances that cause considerable pollution loads. Pouring these substances directly down the drain, and eventually into bodies of water, causes seriously high levels of pollution load (Table 1-1-2).
The sources of pollution loads from bathtubs and washing machines include such materials as detergents and shampoos. Also, people have become increasingly fastidious about clothes washing in recent years, as is reflected in a trend toward laundering clothes after each time they are worn rather then when the given item of clothes is perceived to have become dirty (Figure 1-1-11). This situation has supported steady growth in the volume of laundry detergent sold (Figure 1-1-12).
The volume of shampoo products sold has risen in recent years, in part due to the increasingly widespread trend among young people and others of shampooing their hair each morning, although sales volume is currently stable. A single shampooing, using an average of 12 milliliters of shampoo, results in a BOD load of 1.8 grams. This load is about 75% of that associated with a single laundry load using an average of 25 grams of concentrated laundry detergent, which results in a BOD load of 2.4 grams. Thus, while the trend of greater attention to personal hygiene may support increased cleanliness in the population's daily lives, it is also augmenting the water pollution load.
(4) Housing and Transportation Methods
Urban housing and transportation patterns are closely related to people's lifestyles. This section of the Environment White Paper examines changes in Japanæs urban land-use patterns, together with the transportation-related trends and pollution loads that have resulted from these changes.
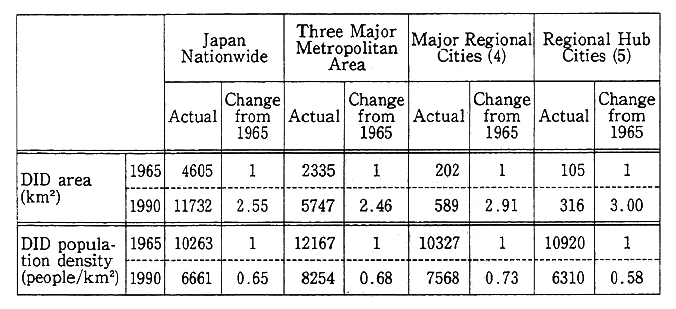
The surge in land prices and the growing ownership of automobiles in Japan have led to a progressive spread of relatively low-density urban districts. In 1960, Japan's densely inhabited districts (DIDs) covered 3,900 square kilometers and had an average population density of 10,600 people per square kilometer. By 1990, these figures had changed to 11,700 square kilometers and 6,700 people per square kilometer, respectively. In other words, over a 30-year period, the DID area tripled while average density dropped 37%. Among the different types of urban areas, it appears that the trend of expansion in low-density urban areas has been most pronounced in the regional hub cities (Table 1-1-3). This trend of expansion in low-density urban areas can also be clearly seen in the Landsat satellite photographs (Figure 1-1-13).
Table 1-1-3 Area of and Population Density in DIDs
Source : Prepared by the Environment Agency based on a national survey conducted by the Management and Coordination Agency (Somu-cho).
Notes: The three major metropolitan areas include Saitama Prefecture, Chiba Prefecture, Tokyo, and Kanagawa Prefecture ; Kyoto, Osaka, and Hyogo Prefecture ; and Aichi and Mie Prefectures. The major regional cities (4) include Sapporo, Sendai, Hiroshima, and Fukuoka. The regional hub cities (5) include Shizuoka, Kanazawa, Okayama, Matsuyama, and Kumamoto.
Looking at the nature of population growth in major metropolitan areas from 1985 to 1990, the populations of the central districts of Tokyo and Osaka, or within a 10-kilometer radius of the city centers, decreased. The populations in a band of 10 to 20 kilometers from the city centers increased, but the rate of increase was less than that for the region within a 50-kilometer radius from the city centers. For Nagoya, the growth in the 0-to-10 kilometer band was also less than that within the 50-kilometer radius. The parts of metropolitan areas with the fastest population growth were Tokyo's 40-to-50 kilometer band, Osaka' s 30-to-40 kilometer band, and Nagoya's 20-to-30 kilometer band. The regions within the 50-kilometer radius of the center of all three metropolitan areas displayed similar doughnut-like patterns of declining or stagnant population growth in the central districts and strong popular tion growth in the relatively verdant outlying districts. In Tokyo, the population decline in central districts halted in the early 1980s, slowing the tendency toward the doughnut-like pattern. Amid the skyrocketing of land prices during the bubble economy, however, the rate of population decline in central districts accelerated, and the population of the central 10-kilometer area fell 6.9% from 1985 to 1990. The situation in Osaka paralleled that in Tokyo, with the population decline in central districts slowing in the early 1980s, followed by a renewed shift of population to outlying suburban areas as land prices surged during the bubble economy.
The growth in suburban populations has brought about changes in transportation patterns. Since the level of public transportation in the suburbs is lower than that in central urban districts, the role of automobiles in suburban transportation is greater. Having begun rising in the early 1960s, automobile ownership in Japan has reached a level compa - rable to levels in Western Europe, although they remain considerably lower than that in the United States. While automobile ownership has grown throughout Japan, the rise has progressed further in outlying regional areas with relatively low levels of public transportation service (Figure 1-1-14).
Fig. 1-1-13
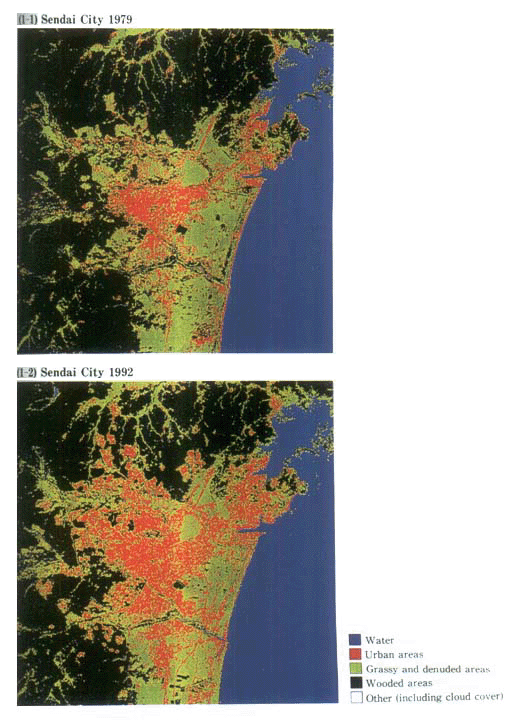
Source : Landsat Data
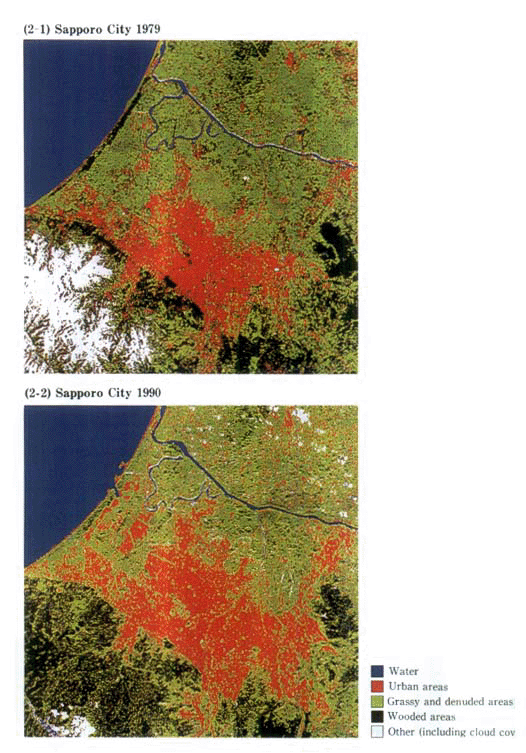
Source : Landsat Data
Fig. 1-1-14 Rise in Automobile Ownership (Number of automobiles per 1,000 people)
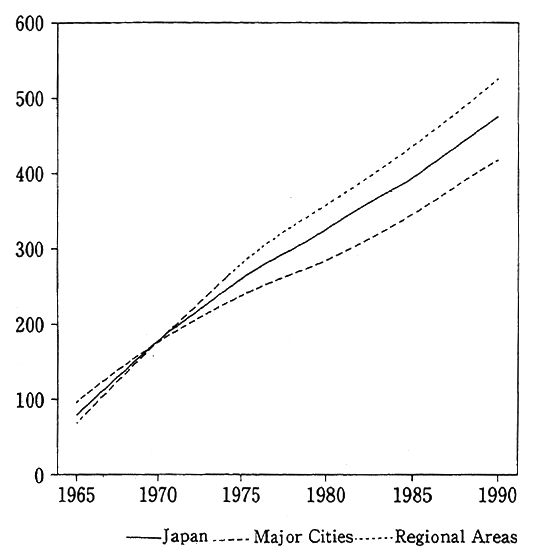
Sources: Prepared based on the Review of Land Transport Statistics (Rikuun Tokei Yoran), the national census (Kokusei Chosa), and other sources.
Changes in daily lifestyles have also brought about an increase in the number of occasions for automobile use related to education, health care, shopping, leisure, and other activities. Looking at the main applications of automobiles, one finds that the share of use for commuting to work and school has declined, while automobile use for shopping, errands, and leisure has risen (Figure 1-1-15). The Japanese population' s suburbanization has prompted such phenomena as the construction of shopping centers with large-scale parking lots convenient to road transportation. This trend is accelerating suburbanization and increasing people's dependence on automobiles. In Japan, shopping centers were located in central commercial districts until the early 1970s, but factors, including the establishment of convenient road and parking facilities, have caused a rise in the number of suburban shopping centers. Shopping center construction in the suburbs has increased in recent years; the suburban share of new shopping centers was more than 70% in fiscal 1991.
Fig. 1-1-15 Principal Uses of Automobiles (Multiple Answers)
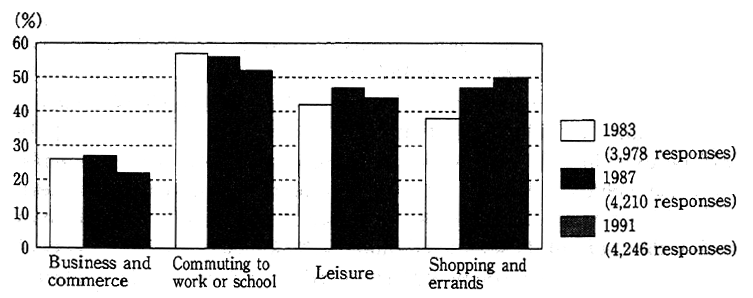
Source Japan Automobile Manufacturers Association (Nippon Jido-sha Kogyo Kyokai)
Let us next look at the relationship between the environment and automobiles and other daily transportation methods. Automobiles and other motorized transportation modes reduce travel times and increase the the convenience and comfort of people's lifestyles. However, they also exert negative environmental influences due to noise pollution and vibration, and their combustion of fuel generates emissions of carbon dioxide, a cause of global warming; oxides of sulphur and nitrogen, causes of throat irritations and acid rain ; and nitrogen oxides and hydrocarbons, causes of photochemical smog.
Carbon dioxide emissions due to transportation have increased steadily and represented 19.0% of Japan's total carbon dioxide emissions in fiscal 1991. The Environment Agency estimates that carbon dioxide emissions due to transportation amounted to 2.6 million tons in fiscal 1991. As that figure was up 4.5% from fiscal 1990, a growth rate surpassing the 2.5% increase in transportation volume, it is clear that the rise in carbon dioxide emissions due to transportation persists.
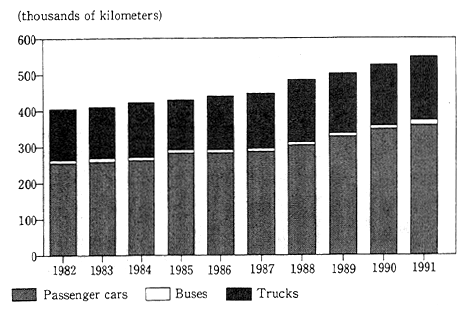
Because of the introduction of stricter regulations regarding emissions of nitrogen oxides, sulphur oxides, and hydrocarbons, there is a trend toward declines in such emissions per motor vehicle of a given class, using the same fuel. According to a survey by the Environment Agency, the average amount of nitrogen oxides emitted by a passenger car traveling one kilometer at speeds of from 15 to 25 kilometers per hour fell from 2.28 grams in 1973 to 0.34 grams in 1990. However, automobile ownership has risen sharply, as described previously, and the total distance traveled by automobiles is increasing (Figure 1-1-16). As will be explained in Chapter 4-1, the decrease in nitrogen oxide emissions per vehicle kilometer of a given type of motor vehicle has been canceled out by such factors as increases in the use of motor vehicles and in the share of diesel-fueled motor vehicles. As a result, the level of compliance with environmental standards has remained low in such major metropolitan areas with regulations on overall volume of emissions as Tokyo's 23 wards, Yokohama, and Osaka. Largely because diesel fuel is less expensive than gasoline, more than 70% of trucks were diesel fueled as of March 1993. In recent years, the popularity of off -road four-wheel-drive vehicles boosted the number of diesel-fueled passenger vehicles, which showed a year-to-year increase of 13.4% in 1993.
Fig. 1-1-16 Total Distance Traveled by Motor Vehicles (thousands of kilometers)
Source Prepared based on the Transport and Economic Statistical Review (Unyu Keizai Tokei Yoran)
Since patterns in motor vehicle use are closely related to city size, we will examine the patterns in the three major metropolitan areas, in major regional cities, and in regional hub cities.
In the area served by the metropolitan transportation systems of the three major metropolitan areas centered around Tokyo, Nagoya, and Osaka, high population density has facilitated the development of high-speed train systems, which carry more than 70% of public transport passengers, and the development of comprehensive mass transportation systems that are highly efficient. Despite this, however, the number of passengers carried by automobiles has risen rapidly, doubling in each metropolitan center during the period from 1975 through 1991. Looking at the shares of passengers carried by automobiles and trains, the passenger share of automobiles in the Tokyo area, for example, rose from 19% in 1975 to 30% in 1991.
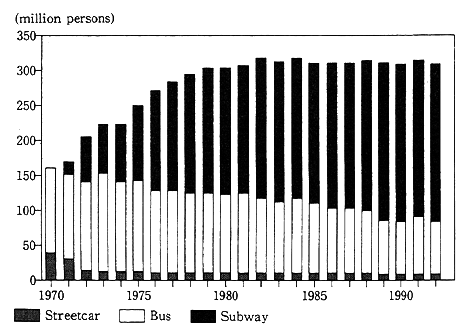
Looking at the transport methods used for commuting to work and school by residents of such major regional cities as Sapporo, Sendai, Hiroshima, and Fukuoka, about 30% of residents use public transportation while about 40% use private automobiles. These proportions reflect a situation intermediate between those of the metropolitan areas with high levels of public transportation and the regions with low levels of public transportation. In recent years, Sapporo, Sendai, and Fukuoka have either established or extended subway systems (Figure 1-1-17).
Fig. 1-1-17 Number of Passengers Carried by the Sapporo Municipal Transport System
Source: Prepared based on materials from the Sapporo Municipal Transport Bureau.
The share of residents using public transportation to commute to work and school in Kanezawa, Okayama, and other regional hub cities is only about 15%, considerably lower than in the major metropolitan areas or the major regional cities. The share of residents making use of private automobiles for commuting is quite high at levels between 40% and 57%.
(5) Leisure
In recent years, a rise in income levels and a decline in the number of work hours have combined to increase the importance of free time in people's lives. According to the Public Opinion Survey on National Lifestyles (Kokumin Seikatsu ni Kansuru Seron Chosa) conducted by the Prime Minister's Office, the share of the population desiring to emphasize leisure and free time now and in the future has become quite high.
While people use their free time to engage in innumerable types of activities, the Leisure Development Center (Yoka Kaihatsu Sentaa) has conducted a survey that indicates that the activity the largest share of people would like to take part in during their free time is domestic tourism (76.2%) and that 40% of the population would like to increase their contact with the natural environment by taking part in such activities as picnicking, hiking, and walking outdoors. The share of the population participating in such other outdoor leisure activities as automobile-based camping and skiing has increased in recent years, and it is expected that this trend will continue.
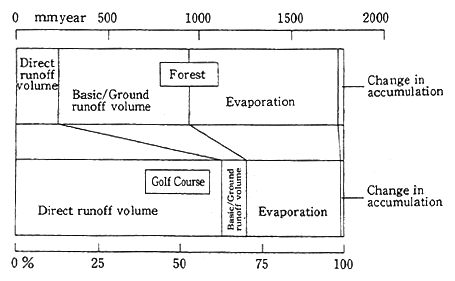
Many of the leisure activities people want to participate in take place amid the natural environment, and there is great value in enriching people's lives by increasing their contact with and understanding of the natural environment. If sufficient care is not taken, however, there is cause for concern regarding the negative environmental impact that the construction of leisure facilities and participation in leisure activities may cause. Noting the population's rising interest in leisure activities and the desire of many regional public bodies to promote regional development, many companies began investing in resort development projects during the bubble economy period, when abundant funding was available. As a result, the number of resort facilities in Japan has increased considerably since the latter half of the 1980s. Many of these facilities were designed to take advantage of sites with attractive natural surroundings, and there was concern that such facilities themselves could have a negative influence on those attractive surroundings if appropriate care was not taken. For example, the conversion of forestland into leisure facilities has accelerated (Figure 1-1-18). If forestland is converted into a golf course, however, the capabilities of the land deteriorate or are lost with respect to the accumulation of groundwater (Figure 1-1-19), the prevention of soil erosion, the absorption of air pollutants, and the sustenance of wildlife. There is thus reason for concern that such conversion may reduce or eliminate the many important functions forestland plays in environmental preservation.
Fig. 1-1-18 Conversion of Forestland for Urban-Type Applications (hectares)
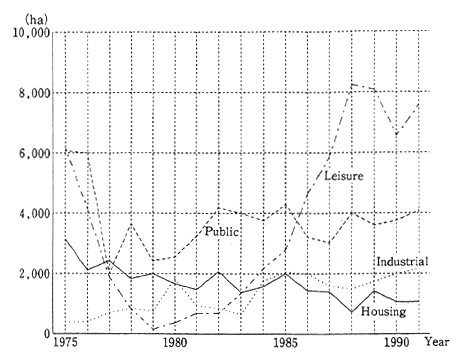
Fig. 1-1-19 Composition of Rain Runoff from Wooded Land and Golf Courses
Source: Fukushima, et al, Kunimatsu
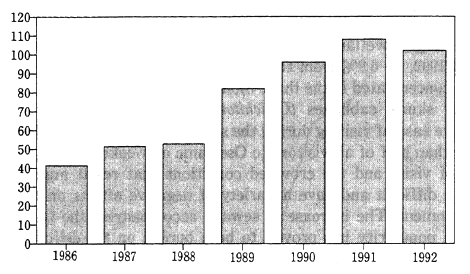
Many recent resort development projects were predicated on overly optimistic demand projections made during the bubble economy. Since the collapse of the bubble economy, the number of golf course development projects has declined (Figure 1-1-20), and developers have withdrawn from many projects. In addition, even development projects in accordance with the fundamental concept of the Resort Law have been canceled or greatly postponed. The Management and Coordination Agency conducted a survey that indicated that, as of July 1992, construction had not yet begun on 83.3% of the sports, recreational, and other specified facilities approved by nine prefectures as being in accordance with the basic concept of the Resort Law during 1988 and 1989. Environmental ramifications played a role in stopping a number of proposed projects. In some cases, environmental impact assessments were made on the initiative of the developers, but in other cases, irreconcilable conflicts arose when residents of nearby villages objected to the negative effects of golf course development on the volume and quality of their water sources, and these conflicts combined with other factors to make a given project unviable. In other cases, construction was never begun because parties planning private-sector leisure facilities were not able to reach agreement with local authorities. Amid these circumstances, a growing number of regional public bodies began establishing guidelines for the implementation of environmental impact studies prior to the creation of golf courses, ski resorts, and other leisure facilities. As of 1989, more than 2O cities and regional governments had established such guidelines.
Fig. 1-1-20 Number of Golf Course Development Projects
Source: Prepared based on materials from the Japan Golf Course Enterprise Association (Nippon Gorufu-jo Jigyo Kyokai).
As a result of the Japanese population's increasing interest in outdoor activities, a large number of people are participating in leisure activities amid the natural environment. The number of people visiting natural parks and other areas with abundant natural surroundings is growing annually, but a large share of such visiting continues to be concentrated in particularly well-known tourist areas during limited periods of time when vacations are most easily taken.
For example, the Ose district within Nikko National Park, which is the largest wetland area on Honshu, was visited by 539,790 people in fiscal 1992, up 6.9% from the previous fiscal year. About 70% of visits were concentrated in the three months from June, reflecting the flowering of skunk cabbages (Lysichiton Amtschatcense) in June and the relative ease of visiting during the summer vacation period. In addition, more than half of all visitors to Ose came on weekends. The concentration of visits and the crowded conditions that result make enjoying nature difficult and have a variety of negative effects on the natural environment. The increase in sewage accompanying the Ose district's rise in popularity has proved to be a burden on the delicate wetland ecology, and several problems, such as those related to changes in vegetation patterns, have emerged. In view of this, progress has been made in recent years with regard to the installation of combinedtreatment septic tanks at all facilities in the area and the laying of a pipeline to send the water treated in the tanks outside of the wetlands. Use of some of this equipment has already begun. There have also been problems regarding the denudation of land in Ose that took place earlier when the forest roads in the district were undeveloped and when the behavior of visitors was less than exemplary. Much, although not all, of the denuded land has been restored thanks to revegetation efforts, programs to educate visitors regarding proper interaction with the natural environment, the introduction of stricter regulations governing usage, and other measures.
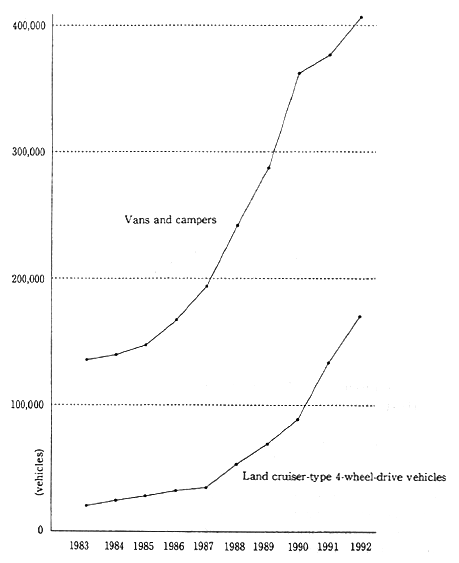
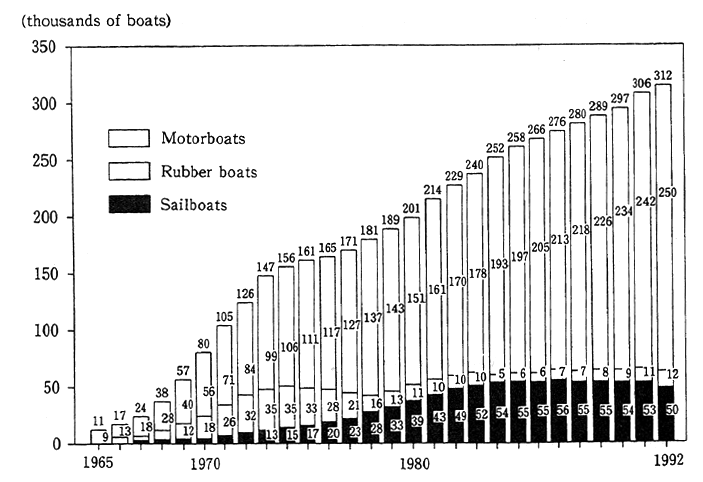
In addition, ownership of four-wheel-drive vehicles, motor boats, and other motor vehicles in Japan has increased during recent years (Figures 1-1-21 and 1-1-22), and the use of such vehicles has become quite popular throughout the country, including areas with an abundance of pristine natural surroundings. In many cases, such motor vehicle use has resulted in noise pollution, destruction of vegetation, disturbance of wildlife, and other damage to the natural environment. In view of this, since 1990, the director of the Environment Agency has prohibited the use of motorized vehicles and boats and the landing of airplanes in numerous designated districts within national parks and other special areas. At the end of fiscal 1993, such restrictions had been established for 26 districts within national parks and other areas, with a total area of 136,680 hectares, and patrols of the districts and other measures designed to enforce the regulations have been implemented.
Fig. 1-1-21 Number of Newly Registered Recreational Vehicles
Source: Japan Auto-Camping Association (Nippon Ooto Kyampu Kyokai)
Fig. 1-1-22 Ownership of Pleasure Craft
Source; Japan Marine Leisure Safety and Promotion Association (Nippon Kaiyo Rejyaa Anzen Shinko Kyokai)
3. Consciousness of Environmental Burdens Due to Daily Lifestyles
As has been explained, increases in the convenience and comfort of daily life have brought about great changes in the volume and character of the environmental burdens generated by households. The consumption and subsequent disposal of large volumes of materials and energy are increasing the scale of environmental burdens, while the character of these burdens is changing as, for example, household disposal of such hazardous materials as batteries that contain mercury. Amid these circumstances, Japanese have become increasingly conscious of the environmental impact of their day-to-day lifestyles.
A survey of trends in the popular consciousness of environmental issues was recently conducted in Germany and Japan by the German Social Survey Method and Analysis Research Center, Japan's National Environment Research Center, and the NHK Cultural Research Center.
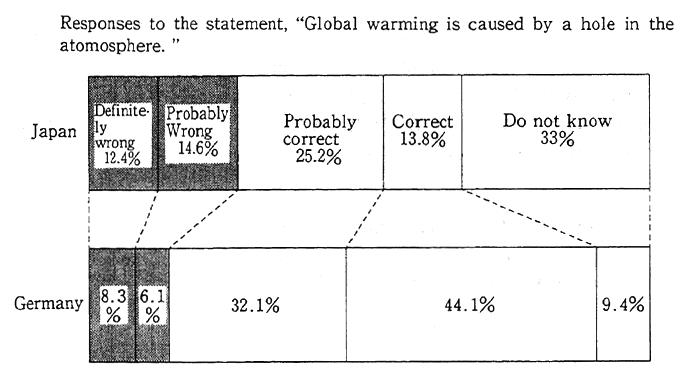
Regarding the scientific understanding of environment-related issues, the survey indicated that, although the share of Japanese respondents with correct understanding of specific scientific issues was higher than that among German respondents, a greater share of Japanese respondents said that they did not understand the issues (Figure 1-1-23). It seems that the Japanese population may be somewhat divided, with one group of concerned people who are working to deepen their understanding of environmental issues and another sizable group of people who are not concerned with the issues and therefore do not understand them.
Fig. 1-1-23 Awareness and Scientific Understanding of Global Environment Issues
Source : The NHK Cultural Research Center and the German Social Survey Method and Analysis Research Center, International Society Survey Plan (1992, subsequently referred to as ISSP)
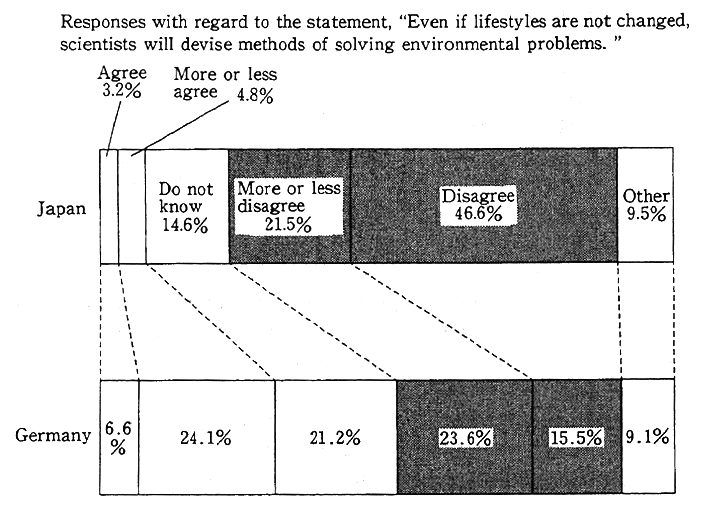
There is increasing recognition among Japanese people that they must reexamine and change their current lifestyles in order to reduce the environmental burdens resulting from their daily lives. As a result, the share of Japanese responding negatively with regard to the optimistic expectation that scientists will probably devise methods of solving environmental problems even if lifestyles remain unchanged was greater than the corresponding share of German respondents (Figure 1-1-24).
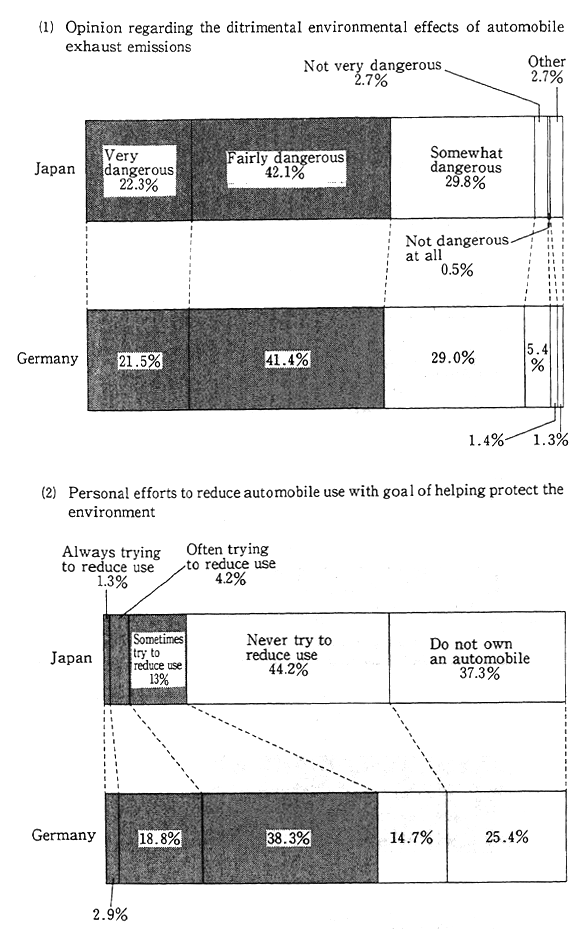
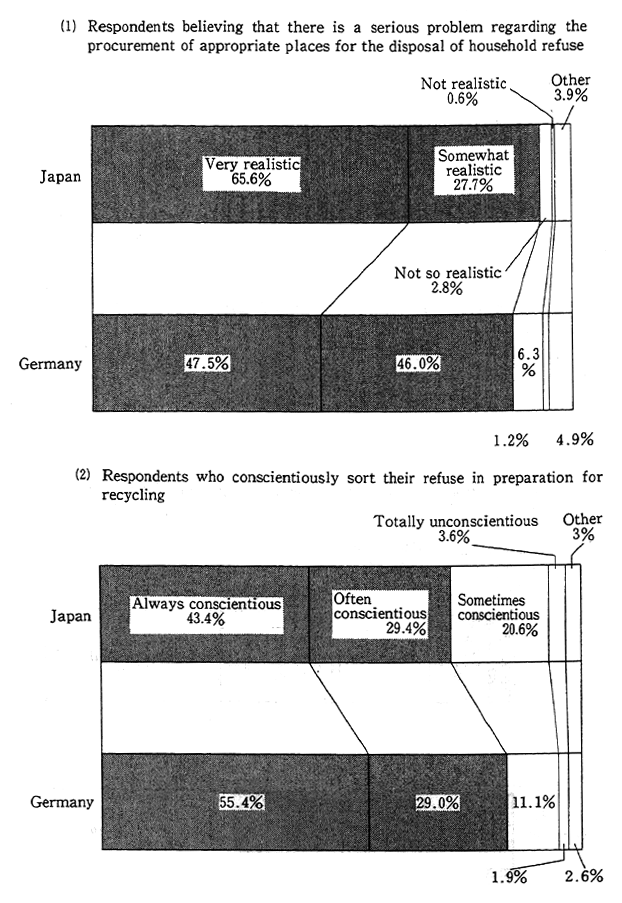
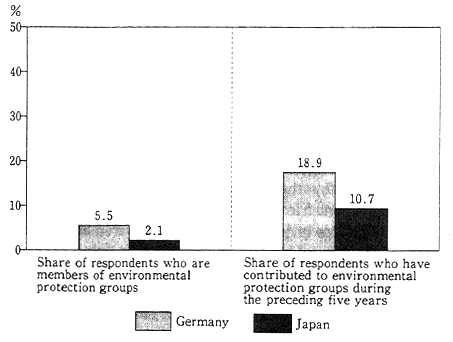
However, there is a size gap between the share of respondents that is highly conscious of environmental issues and the share of respondents that have actually modified their behavior in line with their level of awareness. A large share of respondents agreed that automobile exhaust emissions have dangerous effects on the environment, for example, but the share of respondents who are actually reducing their use of automobiles is relatively small (Figure 1-1-25). Similarly, while a large share of respondents agreed that finding appropriate places to dispose of household refuse is among society's most serious problems, the share of Japanese who conscientiously sort their refuse to facilitate recycling is smaller than the corresponding share of Germans (Figure 1-1-26). Furthermore, the share of Japanese who are actively participating in efforts to help protect the environment by becoming members of environmental protection groups or contributing to such groups are only about half the corresponding share among Germans (Figure 1-1-27). Based on these findings, it appears that, although Japanese are aware of the need to change their lifestyles, they tend not to modify their behavior in line with their awareness. Moreover, a large share of the population is hesitant to take active steps to help protect the environment. We will continue to examine the gap between consciousness and actual behavior in the next section.
Fig. 1-1-24 Consciousness of Need to Change Lifestyles
Source : ISSP survey
Fig. 1-1-25 Consciousness and Behavior Regarding Automobile Use
Source; ISSP survey
Fig. 1-1-26 Consciousnes of Refuse-Related Problems and Importance of Recycling
Source: ISSP survey
Fig. 1-1-27 Memberships in and Contributions to Environmental Protection Groups
1-2 New Types of Lifestyles
1-2-1 Trends in Environment-Friendly Lifestyles
As described in Section 1-1, contemporary Japanese consumption and economic behavior patterns involve the consumption of large volumes of various resources and the disposal of large volumes of unneeded things, both of which are combining to place a growing burden on the environment. The scale of the world's population, energy use, agricultural production, and other human activity has increased rapidly, particularly since World War II. At the same time, the most affluent 20% of the world's population has come to enjoy 80% of global income, while the poorest 20% of the world's population receives only 1.4% of global income. As a result, the industrialized nations are consuming most of the world's environmental resources, and some observers have noted that there may not be sufficient resources remaining for the use of future generations and for the development of developing countries.
On the other hand, there is a broadening movement to reevaluate contemporary lifestyles, directing due attention to environmental considerations. At the Earth Summit held in June 1992, recognition was given to the population problems of developing countries as well as to the considerable environmental impact of the industrialized countries' large-scale consumption, disposal, and manufacturing activities. The eighth principal of the Rio Declaration expresses the objective of reducing and ultimately eliminating nonsustainable production and consumption patterns to enable sustainable development and a high quality of life for all the earth's population, while Chapter 4 of Agenda 21 of presents a plan for bringing about changes in consumption patterns. Similarly, Japan's current economic plan, the Five-Year Plan for Making Japan a Leading Nation with Regard to the Quality of Life, which was approved by the Cabinet in June 1992, has the goal of creating an environment-friendly economic society composed of citizens leading simple lifestyles in harmony with the environment. Creating a society capable of sustainable growth that places few burdens on the environment is one of the fundamental goals of the Basic Environment Law, which was enacted in November 1993 and provides for a variety of measures to be taken to help realize that goal.
In January 1994, the government of Norway sponsored a symposium on sustainable consumption that was attended by ministers of the environment from many leading countries as well as representatives from the OECD and industrial organizations and other nongovernmental organizations. The results of the symposium were summarized in the form of a statement entitled An Agenda for Reform (Table 1-2-1). The Director-General of the Environment Agency, Wakako Hironaka, presented a speech to the symposium on the subject of information needs related to the goal of changing consumption patterns. On the suggestion of the moderator of the symposium, the OECD has begun preparing an action plan related to sustainable consumption, which is scheduled to be completed by 1997.
Against this background of rising international and domestic recognition of the need for efforts to promote sustainable consumption, a growing number of such efforts have been undertaken in Japan. For example, the government and regional public entities have begun providing various types of information and financial support for such efforts, and many companies have begun taking the initiative with regard to the development of environment-friendly products and the establishment of environmental management systems. In this section, we will examine the portion of these efforts focused on consumers.
(1) Reevaluating the Consumption of Large Volumes of Materials and Energy and the Disposal of Large Volumes of Materials
The volume of resources that are taken from the natural environment and the volume of unneeded materials that are disposed of due to the Japanese population's daily lifestyles are steadily increasing, and the burden of these processes on the environment is rising in parallel. In view of this situation, it is important that we work to reduce the environmental burden resulting from our daily lives by shifting from the current pattern of large-scale consumption and disposal and by aiming to adopt sustainable consumption patterns, which involve efforts to select the products we consume with due attention to environmental considerations and to the possibility of using products for relatively long periods of time. Efforts to reduce the environmental burden resulting from the population's daily lives by reducing the volume of materials consumed and disposed of and reducing the volume of energy consumed have already been begun.
A. Considerations at Time of Product Purchases
It is during the process of product purchasing that decisions are made determining the flow of materials into households. Since purchasing decisions will determine whether the refuse and other waste products of a given household will increase or decrease, such decisions are also primary determinants of changes in the environmental burden resulting from household waste. Further, because encouraging consumers to select products that cause a low level of environmental burden will also promote the manufacture of such products, such encouragement has the potential of helping increase consideration given to environmental factors throughout economic society.
There is a spreading movement, known as the green consumer movement, that is aiming to marshal consumers' latent power to make economic society more environment friendly. Support for this movement is strong in Europe, as is reflected in the best-seller status of The Green Consumer Guide, a book published in the United Kingdom in September 1988, and the appearance throughout Europe of numerous other books designed to help help consumers make purchasing decisions with due attention to the related environmental situations. Such purchasing manuals for environment-friendly consumption have also been published in Japan. For example, a citizens group in Kyoto has created a green shopping guide book entitled This Store is Friendly to the Environment (Kono Mise ga Kankyo ni Yasashii).
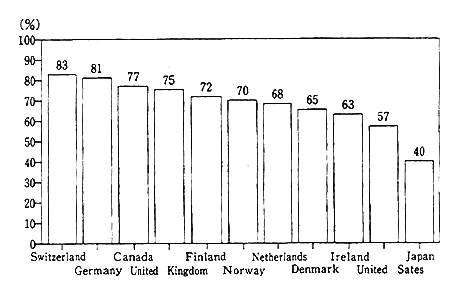
Environment-conscious consumer movements are spreading throughout the industrialized countries. According to a survey published by Gallup International in April 1992, the share of consumers who try to avoid using products with negative effects on the environment is greater than 80% in Switzerland and Germany and more than 70% in Canada, England, Finland, and Norway. The corresponding level in Japan is somewhat lower, at about 40% (Figure 1-2-1).
Fig. 1-2-1 Share of People Who Avoid the Use of Products With Negative Effects on the Environment
Source : Gallup International, The Health of the Planet Survey '92
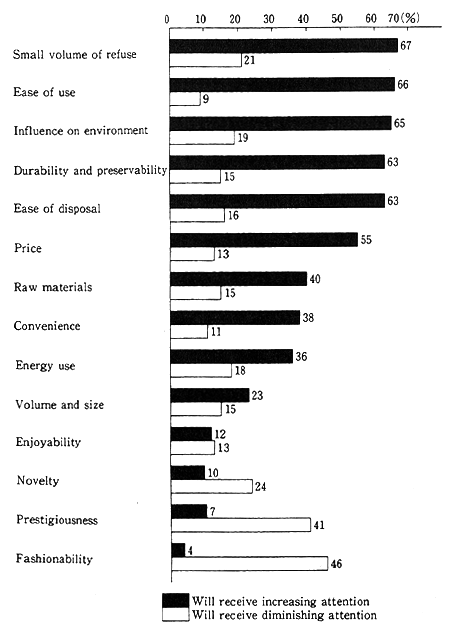
The values upon which Japanese consumers base their product purchasing decisions have also been changing. In addition to such considerations as price and convenience, many consumers anticipate devoting increasing attention to such factors as the volume of refuse ultimately generated by a given product, the overall environmental effects of the product, and the durability and storability of the product while giving less attention to such factors as fashion and ostentatiously conspicuous consumption (Figure 1-2-2).
Fig. 1-2-2 Factors Determining Consumer Purchasing Decisions
Source: Tokyo Municipal Government, Survey on Municipal Residents' Consumption Behavior (Tomin no Shohi Kodo ni Kansuru Chosa), 1993
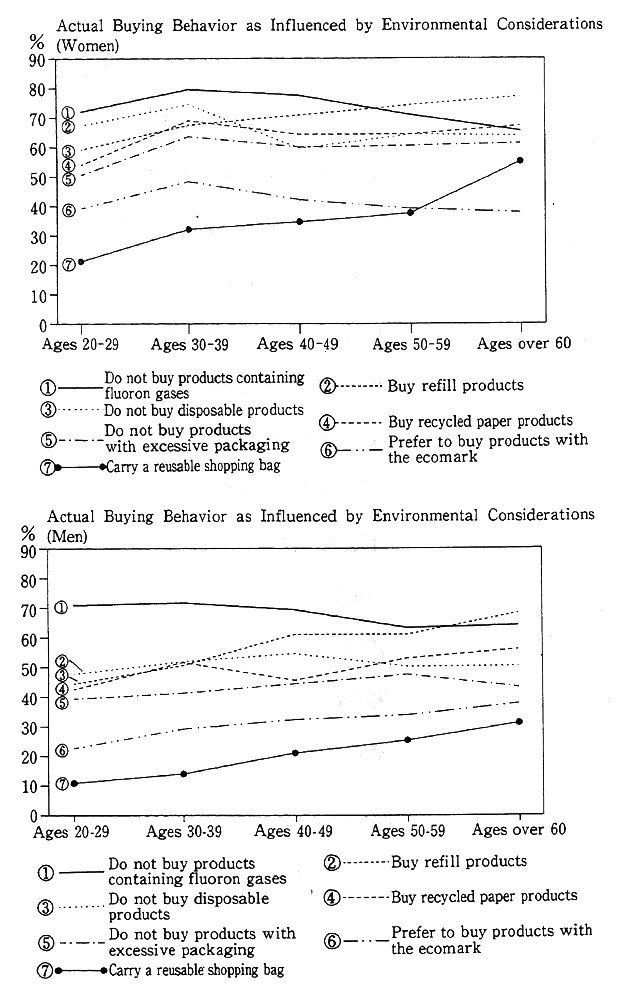
A survey conducted by the Nissay Basic Research Center on the attention consumers actually devote to environmental considerations when shopping indicates that more than 60% of consumers do not buy disposable products or products that contain fluoron gases, almost 60% of consumers buy refill products (lightly packaged products for refilling standard containers) and products incorporating recycled paper, and almost 40% of consumers prefer to buy products that carry the ecomark. In addition, about half the consumers surveyed report that they reject products with excessive packaging. When it comes to carrying one's own reusable shopping bag to stores, an activity requiring some forethought and effort, however, the share of consumers who do the environmentally right thing is only about 30%. Analyzing the survey results by the sex and age of respondents, one finds that women generally give more consideration to the environment than men and that women between 30 and 50 years old are particularly environmentally conscientious (Figure 1-2-3).
Fig. 1-2-3 Displaying Consideration for the Environment at Time of Product Purchases Actual Buying Behavior as Influenced by Environmental Considerations
Source : Nissay Basic Research Center, Survey on the Ecolives of Urban Residents, 1993
Having noted the rise in consumer consciousness regarding products' environmental effects, manufacturers are working to expedite the development of products designed to show due consideration to the environment. For example, major manufacturers of kitchen detergents began manufacturing refill products in the latter half of 1990, and such refill products have grown to account for half of all sales of certain types of kitchen detergents. The number of products that have received permission to bear the ecomark, which attests to their environment friendliness, has increased from 955 in 1989 to 2,599 in 1993.
In addition, there are a growing number of networks that directly link consumers with manufacturers and providers of environment -friendly products and services. Particularly popular examples of these networks include cooperative buying associations that link consumers with producers of organic agricultural products and systems that take consumers' orders for soap products from factories that manufacture such products from waste oil. So-called life cooperative associations throughout Japan enable consumer groups to participate in product manufacturing, distribution, and marketing operations. Having long been involved in the cooperative purchasing of powdered soap and organic agricultural goods, such organizations have recently become involved in the development of environment-friendly products-such as stationary products that are made from recycled paper and thereby help preserve forest resources, soap products made from waste oil, and refill products-as well as in the creation of systems for awarding qualified products with special product marks that indicate environment friendliness. In Hyogo Prefecture, consumers' associations and other groups have joined together to create programs for promoting shoppers' choice of environment-friendly products, for conferring awards to environment-friendly companies, and for selecting and working to increasing the diffusion of environment-friendly products.
So-called fair-trade programs have become popular among consumers in industrialized countries, particularly the United Kingdom, Germany, and the Netherlands. These programs aim to facilitate the self-help efforts of people in developing countries as well as to support the sustainable economic development of developing countries by arranging for the purchase of coffee beans, other agricultural commodities, and traditional craft products at prices several times higher than those prevailing on world markets. Since the fair-trade system enables manufacturers in developing countries to participate directly in the price setting process, prices can be set with an eye to realizing social and environmental protection objectives, such as providing the manufacturers with the funds required to establish their economic independence and to cover the extra labor and other expenses entailed by the management of agribusinesses with low levels of agricultural chemicals. Similarly, a Japanese private-sector association has begun a cooperative purchasing program that features a fund for providing ¥2O of financial support for each kilogram of imported bananas that are grown in developing countries using low levels of agricultural chemicals. In Europe, products imported through fair-trade programs have generally been marketed through church groups, charity bazaars, and mail order routes, although the range of marketing routes has become broader in recent years due to the strong support of consumers. Many supermarkets and other stores throughout the United Kingdom now handle products imported through fair-trade programs, and the number of such stores in Germany has risen to about 20,000. In the Netherlands, coffee imported through fair-trade programs has come to represent 7% of the domestic coffee market.
B. Reducing Environmental Burdens by Reducing the Disposal of Unwanted Materials
Efforts to reduce the volume of unwanted materials disposed of can lower the environmental burdens associated with the decomposition and purification of such materials, while related efforts to make better use of resources taken from the environment can decrease the volume of resources that must be newly taken from the environment. Effectively reducing the volume of unwanted materials that are disposed of requires that attention be given, not only to the penultimate stage of product life cycles, at which the products are thrown away, but also to the stages of product purchasing and product use. It is thus important that a three-stage approach to reducing disposal volumes be taken, and the stages of this approach can be described as the three Rs, namely reduce, reuse, and recycle.
Efforts to reduce the volume of unwanted material disposal at the product purchasing stage, by working to decrease the volume of unneeded materials that enter households, have already begun, as is reflected in Figure 1-2-3.
Lengthening the time period during which a given product is used is an important prerequisite for realizing sustainable consumption behavior, and the average length of consumer durable product use periods has been increasing in recent years. From the second quarter of 1992 to the fourth quarter of 1993, for example, the average usage period increased from 10.2 years to 10.4 years in the case of refrigerators, from 11,1 years to 12.5 years for air conditioners, and from 9.1 years to 9.6 years for televisions. The deterioration of economic conditions in the wake of the bubble economy has combined with other factors to restrain purchases of durable goods and encourage consumers to use the durable goods they own for longer periods of time. A survey, conducted by the Household Electric Appliance Association (Kaden Seihin Kyokai) indicates that consumers would like to extend their product usage periods to an average of 11.7 years for refrigerators, 118 years for air conditioners, and 10.8 years for televisions. However, using products for extended periods of time sometimes entails arranging for the products to be repaired. Since such repairs are sometimes not possible due to a lack of replacement components, many people have suggested that better product repair systems be established. In addition, as seen in Figure 1-22, the share of consumers intending to give increased attention to durability and storability on the occasion of their product purchases has risen to more than 60%. Supported by this trend and based on the principle that wood resources that require a close to a century to grow should be made into products that can be used for a comparable period of time, there has been a noteworthy movement in which craftspersons' shops focus on the production of durable wooden furniture and household goods while also directly arranging for the planting of deciduous trees.
With regard to recycling activities, one interesting development is the increasing organization and popularity throughout Japan of flea markets for the exchange and sale of unneeded household products. Regional public entities have moved to create recycling plazas, recycling shops, and other facilities that help arrange the sale and exchange of unneeded products, such as furniture and electric products, as well as to disseminate information that facilitates such exchanges among consumers and to provide locations for flea markets. The general population has become increasingly aware of the many opportunities for selling and exchanging used products through flea markets and recycling shops, and a large share of the population has reported either a desire to make active use of such opportunities or a potential interest in such opportunities (Figure 1-2-4).
Fig. 1-2-4 Opinions Regarding the Use of Systems for the Exchange or Sale of Used and Unneeded Goods

Active movements to promote the reuse of cans and other containers have also begun. Glass container recycling systems have a history more than a century long in Japan. Since the early 1960s, however, production has begun of disposable containers made from a variety of materials. The volume of reusable containers (returnable bottles) has subsequently decreased, reflecting corporate efforts to change container designs as part of marketing strategies and to reduce distribution costs, the increasing use of vending machines, and changes in consumer lifestyle patterns.
Amid these trends, in November 1993, a consumer cooperative association in Kanegawa Prefecture began implementing its Green System plan in cooperation with the association's members, bottlerecovery businesses, and manufacturers. Aiming to promote the reuse of glass containers for such food products as vinegar and jam, the plan's organizers are working to simplify the reuse of such containers by reducing the number of container types from 10 to 3. The cooperative association's members are actively disseminating information on the plan, and their initial target is to boost the recycling rate for relevant containers to 80% within a year of the plan's inception. In view of the lack of systems for gathering and transporting used containers, the association and bottle-recovery businesses are cooperatively shouldering this burden at present.
European countries are taking positive steps to promote beverage bottle reuse. Denmark has passed laws, in effect from 1990, requiring that all domestically produced beer and soft drinks be packaged in reusable containers. Finland has given an incentive to employ reusable containers by instituting a tax on all nonreusable containers, and the share of beer and carbonated soft drinks sold in reusable containers has subsequently risen to more than 90%. Norway, Sweden, and other countries have also adopted the strategy of increasing taxes on nonreusable containers. Thus, a number of countries are working to promote the use of reusable containers by such legal means as the institution of laws and regulations requiring the use of reusable containers and through such economic means as the taxation of nonreusable containers and the establishment of preferential tax rates or tax exemptions for reusable containers. However, reusable glass containers are heavy, requiring considerable energy to transport, and easily broken. In view of this, the use of plastic reusable containers has begun in several locations in Europe as well as in Japan.
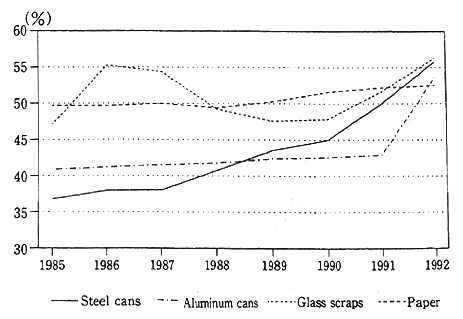
Many types of products that are not amenable to reuse can be recycled. Products that are currently recycled separately or as mixed refuse include glass bottles, cans, paper, PET plastic bottles, cardboard food packaging, plastic food trays, and clothing. In addition to reducing the volume of refuse that must be disposed of and the volume of resources that must be extracted from the environment, such recycling has the effect of lowering energy use. For example, a comparison of the energy required to produce cans and paper from old cans and paper, as opposed to virgin resources, reveals that the use of recycled resources requires only about 33% the energy in the case of steel cans, 3% in the case of aluminum cans, and 25% in the case of paper. In bottle manufacturing, if the volume of glass scrap is increased 10%, the amount of energy used will be cut 2.5%. While materials recycling programs consume energy for transportation processes, this amount of energy is quite small compared with the scale of manufacturing-related energy use. Moreover, by reducing energy use, recycling has the effect of decreasing emissions of carbon dioxide, nitrogen oxides, and other substances that increase the pollution load on the atmosphere. Currently, a variety of recycling systems are in operation, such as collection programs organized by regional public entities, group collection prow grams organized by local resident groups, and collection facilities provided by supermarkets and other stores. As a result, the volume of materials recovered is increasing (Figure 1-2-5).
Fig. 1-2-5 Recycling Shares of Selected Rpoducts in Japan
Sources: Prepared based on materials from the Can Processing Countermeasures Association (Kan Shori Taisaku Kyokai), the Aluminum Can Recycling Association (Arumi Kan Risaikuringu Kyokai), and the Glass Bottle Recycling Promotion Association (Gurasu Bin Risaikuringu Suishin Renge) and Used Paper and Pulp Statistics (publication from government body).
In addition, programs have been organized to collect organic garbage, which makes up almost half of household refuse by weight, for conversion into fertilizer. In Nogimachi, Tochigi Prefecture, a program for the collection of sorted raw garbage is under way. The garbage collected is composted at a local resource conversion center, and the resulting product is distributed to local farmers and other residents. In Kaji City, Gifu Prefecture, and other locations, programs have been organized to promote garbage composting by subsidizing households' purchases of composted products. In addition, leftover food and cooking scraps from students' meals are composted as a part of numerous elementary schools' environmental education programs, and the resulting fertilizer is used on the schools' gardens and other locations.
In view of the large share of household refuse that packaging materials has come to account for in recent years, a program aimed at reducing such packaging waste has been organized in Germany. As a demonstration of green sentiment, the movement encourages consumers to deposit unneeded packaging at supermarket cash registers, thereby hoping to influence manufacturers' and marketers' consciousness of packaging-related issues. In 1991, Germany introduced a law that aims to reduce packaging waste by requiring packaging materials manufacturers and marketers to collect and either reuse or recycle packaging materials. From January 1992, collection operations for secondary product packaging, such as boxes in which food containers are placed and gift packaging, have been introduced in supermarkets and other stores. As companies that participate in resource recovery systems that achieve specified level of waste recovery are exempted from the requirement to manage collection operations directly, collection through the private-sector Dual System Deutschland (DSD) system has increased. Recently, according to a survey conducted by the German Social Survey Method and Analysis Research Center in 1993, the percentage of German consumers who left packaging materials at a store during a given month reached 54%. Reacting to this trend, product marketers are working to reduce or eliminate packaging for many types of products.
C. Reducing the Air-Pollution Load from Energy Consumptiou
As described in Section 1-1, the rise in household energy consumption and automobile use in Japan has boosted the volume of carbon dioxide generated per household about 20% during the past decade.
In response, numerous programs aimed at helping reduce household carbon dioxide emissions have been initiated. For example, a growing number of cooperatives, other consumer groups, regional public entities, and other organizations have begun distributing household environmental accounting booklets. These booklets help individuals gain a better understanding of the environmental burdens that result from their lifestyles and provide information needed to make educated decisions regarding the modification of those lifestyles. In addition to a variety of items designed to encourage more attention to such issues as water usage, refuse reduction, and direct contact with the natural environment, the booklets contain sections for checking the levels of energy consumption and automobile usage.
Aiming to reduce households' energy consumption and carbon dioxide emission, the Hiroshima Prefecture Association of District Sanitation Organizations has created a household environmental accounting booklet that contains spaces for recording consumption volumes of electricity, gas, kerosene, gasoline, and other energy sources. The completed booklets are sent to the association, which calculates each household's carbon dioxide emission and records the results in the booklets, which are then returned to the participating households (Figure 1-2-6). The booklets also give information on average global levels of carbon dioxide emission by households with the same number of members as the given household, thereby enabling the household to grasp the large scale of its energy consumption and of related environmental burdens. An information magazine distributed in conjunction with the household environmental accounting booklets supplies participating households with the overall statistical results of the survey together with information on environmental protection. Because of carbon dioxide's invisibility to the naked eye, people have only abstract perceptions of its role in their daily lives. This type of household environmental accounting booklet program is expected to raise the level of consciousness regarding carbon dioxide and promote the adoption of lifestyles that entail the emission of relatively low levels of carbon dioxide.
Fig. 1-2-6 Check List for Energy Consumption and Carbon Dioxide Emis. sion
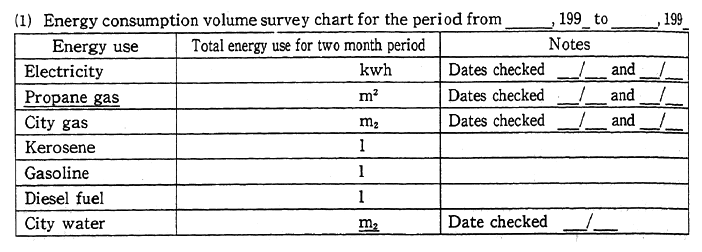
Note: Please draw a line in the space provided for energy-use items that are not applicable
(2) Notification of Results of Program to Calculate Volumes of Energy Consumption and Carbon Dioxide Emission (How to read this notification)
A. Energy consumption volume: The amount of energy your household consumed from each type of energy source.
B. Carbon dioxide emission volume : The carbon dioxide emission from your household, calculated based on information on your household's energy consumption.
C. Average household emission level : The average household level of carbon dioxide emission among surveyed households, calculated based on information on energy consumption.
D. Average emission leval adjusted for number of household members : The average level of carbon dioxide emissions for other households with the same number of members as your household, calculated based on information on energy consumption.
E. Appraisal : An asterisk indicates that your household emission volume (B) exceeds the average emission level adjusted for number of household members (D).
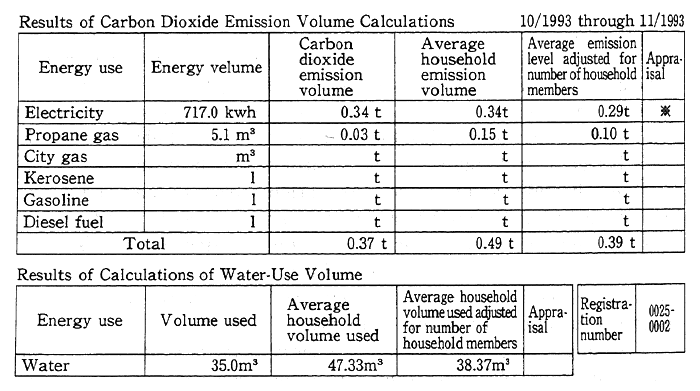
Note : After household complete and submit form (1), form (2) is sent to them.
Source: Hiroshima Prefecture Association of District Sanitation Organizations
Fig. 1-2-7 Opinions on Desirable Future Treds in Appliances
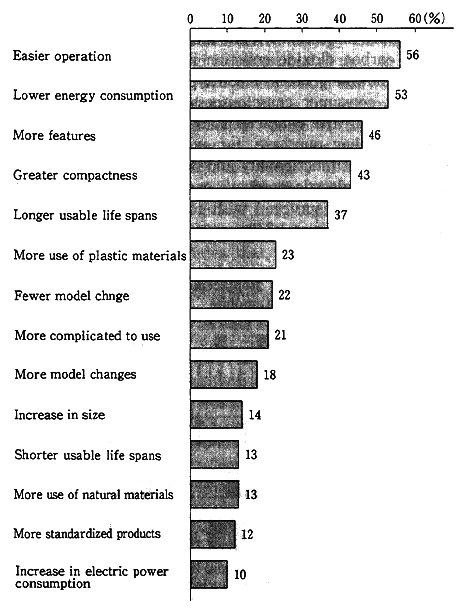
Source: Tokyo Municipal Government, Survey Regarding Municipal Residents Purchasing Behavior (Tomin no Shohi Kodo ni kansuru Chosa), 1993
As described in Section 1-1, one factor determining the amount of a household's carbon dioxide emission is the amount of energy consumed by such durable goods as electric products and automobiles, and it appears that consumer consciousness regarding such products is changing. Reviewing the characteristics that consumers seek in the electric products they purchase, for example, one finds that while consumers want multifunctionality and other characteristics that tend to increase a given electric product's energy consumption, more than half of the consumers surveyed wish to select products with lower energy consumption (Figure 1-2-7).
Fig. 1-2-8 Plans for Replacement of Most Recently Purchased Automobile
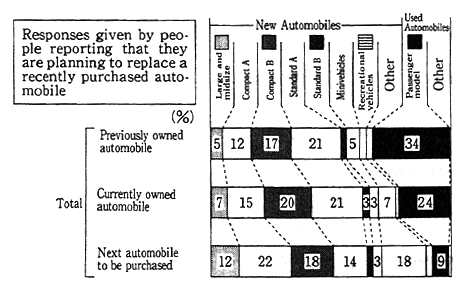
Notes: *1 Mini vehicles include mini bonnet vans. *2 Recreational vehicles include bonnet wagons, off-road wagons, cab-over wagons.Off-road wagons include offroad vans.
Source: Japan Automobile Industry Association
According to a survey by the Japan Automobile Manufacturers Association, the share of people who want higher gas mileage and cleaner exhaust emissions from the next automobile they purchase, even if models with such characteristics are somewhat more expensive than other models, has risen to more than 60%. The responses collected in the survey include some apparent contradicti ons, however, since the people surveyed also generally expressed the desire to purchase models that are larger and have higher engine displacements than the models they currently own (Figure 1-2-8).
The use of thermal insulation and double-paned windows to reduce the energy consumed for heating homes is increasingly widespread. The H ousing and Construction Energy Saving Organization (Jutaku-Kenchiku Sho-Enerugi Kiko) estimates that, in fiscal 1992, the share of newly built housing that incorporated thermal insulation was 91.6% for single-family housing and 95.8% for apartments and condominiums, while the share of existing structures that was insulated was 27.7% for single-family housing and 52.3% for apartments and condominiums. The total domestic sales volume of two-layered insulated glass, including products for use in office buildings and in housing, grew from 1,752,000 square meters in 1987 to 2,516,000 square meters in 1992. The Residential Environment Planning Research Center (Sumi Kankyo Keikaku Kenkyu Sho) estimates that, in Tokyo, the introduction of lO0mm-thick insulation and double-paned windows in single-family housing can reduce energy consumption for heating more than 60%, while the introduction of 25mm-thick insulation and double-paned windows in multiunit housing structures can reduce heating-related energy consumption almost 60%. The energy savings due to the reduced use of heating equipment can significantly reduce the pollution load on the atmosphere. Moreover, in a relatively cold region such as Hokkaido, the introduction of 100mm-thick insulation and double-paned windows in single-family housing can reduce heating-related energy consumption more than 75%.
Thus, many households have begun reevaluating their methods for selecting and using energy-consuming products, and this trend is already producing positive results. The National Environment Research Center (Kokuritsu Kankyo Kenkyu Sho) has estimated the degree to which household carbon dioxide emission can be reduced by means of such efforts.
First, projections were made based on the assumption of continued increases in the number of households; the total area of residential living space; the use and size and performance of such energy-consuming goods as televisions, refrigerators, and automobiles; the use of heating and air conditioning; and the volume of hot water used. Based on these assumptions, the center projects that the emission of carbon dioxide resulting from household energy consumption and automobile use in 2010 will be to 1.4 times the 1990 level of 64.6 million tons.
Next, the projection scenario was changed by assuming that households throughout Japan implement various types of measures to reduce their carbon dioxide emissions. A 10% drop in refrigerator use by 2010, for example, would reduce carbon dioxide emission at that time by 1.7 million tons, for example, while simply keeping the size of televisions and refrigerators to their 1990 level would bring about a 2. 6-million-ton carbon dioxide reduction.
In addition, considerable changes in the volume of carbon dioxide emission could result if households select household equipment on the basis of relatively long-term projections of costs and benefits. For example, since the initial purchase price of an incandescent light fixture is less than that of a fluorescent light fixture, the incandescent product will be selected by people with a short-term perspective. However, the lower electricity consumption and longer usable life span of a fluorescent light fixture makes it more economical than the incandescent light fixture if all costs for usage periods of about three years or more are considered. Thus, the adoption of longer-term perspectives on the costs and benefits of lighting product purchases could bring a rise in fluorescent lighting fixture use, which would cause declines in electric power consumption, in the number of light bulbs manufactured, and in related carbon dioxide emission. Similarly, if people accept that the balance of the economic costs and benefits of investment in the installation of heat-insulation materials will become positive after about 10 years, then the use of insulation will rise and the use of heating equipment will decline. If consumers can accept a 20-year wait before the balance of the economic costs and benefits of investment in the installation of solar water heating systems becomes positive, then the use of such systems will rise, thereby reducing carbon dioxide emission by about 15.2 million tons. Thus, if energy-consuming products and other products are selected based on long-term perspectives, the initial costs may be higher, but considerable reductions in carbon dioxide emissions will result.
Regarding the selection of household automobiles, if 10% of households that use standard-size models select compact models when they replace their current vehicles, and 10% of households with compact models select mini vehicles when they replace their current vehicles, Japan's total carbon dioxide emissions will be reduced approximately 700,000 tons annually. If all current automobile owners purchase vehicles with 10% better fuel mileage when they replace their current vehicles, Japan's total carbon dioxide emissions will be reduced approximately 3.9 million tons.
If paper recycling programs expand and the share of used paper that is recycled increases 10% from the current level, carbon dioxide emissions would be cut about 500,000 tons.
If households take all the environmental protection initiatives described in the previous four paragraphs, the level of household carbon dioxide emissions in 2010 will be only about 1.1 times the 1990 level (Figure 1-2-9). Thus, by changing usage methods for energy-consuming products and modifying perspectives related to the purchase of such products, considerable reductions in carbon dioxide emissions can be achieved.
Fig. 1-2-9 Means of Reducing Household Emissions of Carbon Dioxide
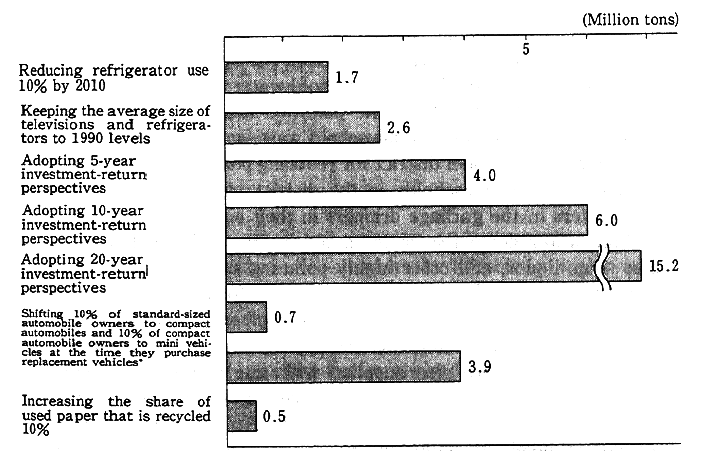
Note: Figures represent the reduction of carbon dioxide emissions in 2010 projected to result from the given situations. * Assuming the shift is begun from 1995. Source: National Environment Research Center
(2) The Natural Water Recycling Process and Nature-Friendly Leisure Activities
Household wastewater eventually becomes reusable as drinking water after passing through a lengthy natural recycling process that begins with the purifying activities of certain bacteria. A variety of efforts are being made to arrange for waste water disposal and water usage patterns based on due consideration of the natural water recycling process, thereby ensuring that the benefits of this process can be maintained. In addition, as the amount of leisure activities that are conducted amid natural surroundings is increasing, other efforts are beginning to be made with the goal of reducing the environmental burden resulting from such leisure activities.
A. Consideration for Natural Water Recycling Process
Individual households can play an important role in reducing the large impact household wastewater has on the quality of water resources, which was described in Section 1-1. This section will focus on programs aimed at modifying household water-use patterns.
About 73% of the organic pollution load in rivers in Saitama Prefecture is attributable to household wastewater. In 1992, the prefecture designated a model district for reducing pollution due to household wastewater. The households in the district were encouraged to use paper filters in the garbage drainers in their sinks; stop sending ricewashing water down the drain ; avoid leaving unfinished portions of miso soup, liquor, and other highly polluting substances; stop sending cooking oil down the drain ; wipe leftover food from dishes before washing them; use appropriate amounts of soap and detergent for laundry ; reuse bath water; and use appropriate amounts of shampoo. The households were also supplied with sets of products helpful in combating water pollution, including paper filters for garbage drainage and chemicals for congealing waste oil. As a result, considerable declines in levels of pollutants in the waterways within the model district were achieved, including drops of 53.2% in BOD, 50.8% in suspended substances (SSs), 40.9% in nitrogen, and 43.7% in phosphorus (Table 1-2-2). Of the people within the district, 90% reported being concerned with the pollution of local waterways and 57% believed that household wastewater was the prime cause of such pollution. Residents showed a high degree of concern about and understanding of their own role in water pollution, and a considerable share of them reported that they continued working to reduce the level of pollutants in their household wastewater after the survey period. The organizers of similar campaigns to reduce pollutants in household wastewater in other areas of Japan have reported the achievement of reductions between 20% and 30%. In areas served by sewage systems, reductions in levels of pollutants in household wastewater have reduced the difficulty of sewage treatment operations.
Table 1-2-2 Results of a Campaign to Reduce Pollutants in Household Wastewater
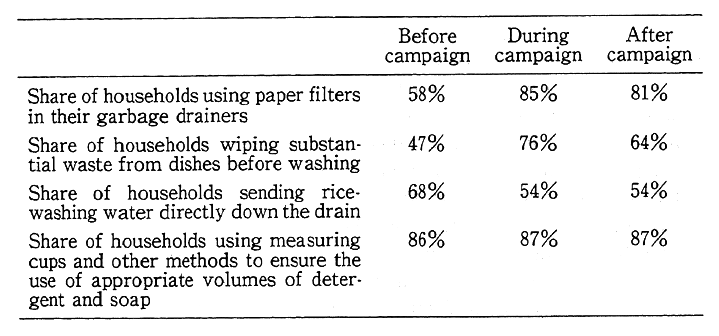
Source: Saitama Prefecture
To reduce the burden of pollutants from kitchens, which are the source of the largest share of pollutants in household wastewater, educational programs and study groups related to ecologically-friendly cooking techniques-entailing such practices as the reduced use and reuse of broth and gravy-have been organized by local public entities and consumer groups in Ishikawa Prefecture and other locations. Many types of ecologically-friendly cooking techniques have been developed, including those that involve the cooking and use of vegetable skins and other portions of food products that are often wasted, thereby reducing the volume of garbage. Consumers are also being taught to reduce energy consumption by using stoves and ovens more efficiently.
Besides programs focused on activities within households, programs have been organized throughout Japan to encourage household members to engage in additional efforts to increase the cleanliness of natural water resources. These include programs in which residents of particular areas conduct water-quality surveys themselves, thereby gaining a better grasp of the water pollution situation, and programs aimed at making use of local residents' intelligence and energy to clean up water resources and make such water-based wildlife as fireflies viable.
B. Leisure Activities that Are in Harmony with Nature
As described in section 1-1, the increase in leisure time and other factors have led to a considerable rise in the Japanese population's participation in various leisure activities. A growing number of programs have been organized to minimize the environmental burdens that result from these activities.
Many types of leisure activities, such as alpine skiing and golfing, require the construction of large-scale facilities, causing considerable changes in the natural environment of their sites; however, movements aiming to make use of unaltered natural environments for leisure activities, without large-scale facilities, are emerging. While broad areas of mountain vegetation must be cleared to create slopes for alpine skiing, for example, many private-sector organizations are working to promote cross-country skiing, a sport in which participants tour natural snow-covered terrain and enjoy contact with relatively natural surroundings. Some organizations are promoting nature-friendly leisure activities with the specific goal of reducing the environmental burdens related to large-scale leisure facilities. Nature games and other activities in which participant make use of their five senses amid natural surroundings have become popular in the United States and Western Europe, and programs are under way to promote such activities among Japanese young people.
There are a growing number of private-sector organizations promoting leisure activities that make use of the natural environment without large-scale facilities. By 1991, the number of such organizations in the Tokyo area alone had risen to over 400, of which the largest share, 210 groups, were focusing on the observation of nature and wild birds, and almost 70 groups aimed to promote hiking, camping, and other simple modes of contact with natural surroundings (Figure 1-2-10). To support such activities, a growing number of such basic amenities as nature-watching facilities and hiking trails are being put in place.
Fig. 1-2-10 The Promotion of Contact with Nature (Tokyo Area) Source: Environment Agency
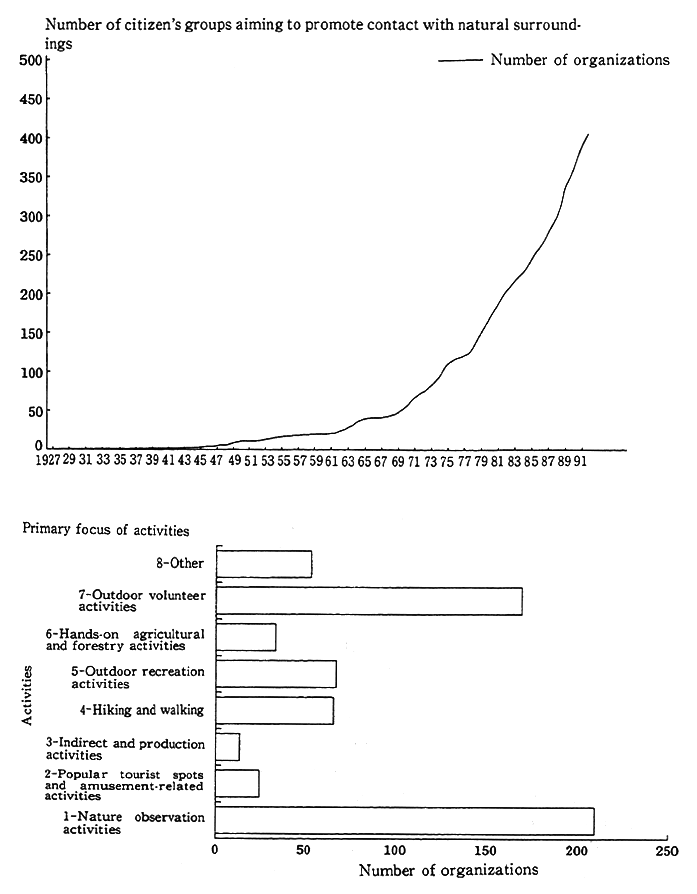
Note: Figures for the number of organizations promoting contact with nature are based on the results of a survey of local city and village governments (47.6% response rate, 846 replies), and the analysis by type of activity is based on a survey of the activities of 428 citizen groups.
Although the influx of large numbers of tourists into natural settings can impose environmental burdens such as those related to the destruction of vegetation, air pollution from motor vehicles, and littering, there is increasing interest in so-called eco-touring activities that allow tourists to come into more contact with nature while minimizing related environmental burdens.
Eco-touring is extremely popular in such regions as eastern and southern Africa, Costa Rica, Ecuador, the United Kingdom, and the United States. It involves such practices as limiting the number of tourists, such as the measures taken by Ecuador to prevent large incursions of visitors into the Galapagos Islands, and the use of tourist guides who explain the local flora and fauna and help tourists gain better understandings of local environments.
Regarding the United States and Europe, in 1991, environmental protection groups, transportation concerns, and hotel industry groups from Germany and other countries cooperated to create the European Eco-Tourism Association, which engages in information dissemination and educational activities and also provides advice to tourists, tourismrelated groups, and hotel-related groups. Being promoted in England is the concept of sustainable green tourism, which places a minimal burden on the environment and helps promote the balanced development of the special characteristics of various regions. According to the England Countryside Committee, green tourism is distinguished by its small scale, consideration of social and environmental side effects, and focus on the special cultural and environmental characteristics of a given region. It aims to maintain respect for the scenery and environment while promoting gradual development, and participants are encouraged to use public transportation. To promote green tourism, private-sector organizations are creating a variety of guide books and check lists for distribution among tourists.
In Japan, also, a growing number of people are participating in tours designed to allow participants to come in contact with and gain a better understanding of nature. These tours include bird-watching, whale-watching, nature-watching, mountain climbing, and camping expeditions. Recently, the Japanese public has shown rising interest in tours that enable the observation of wildlife and pristine nature and participation in adventurous activities in national parks overseas.
Further, there is a growing variety of activities organized with the goal of allowing participants to combine leisure and travel with work that contributes to environmental preservation. Since 1991, for example, the Japan Desert Greenery Implementation Association has organized tours to plant trees and help prevent desertification in China. The number of participants on these tours has surged from 70 in fiscal 1991 to 345 in fiscal 1993, and the association is working to realize a plan that calls for the planting of a million trees in the Kubuchi Desert of Inner Mongolia. Also enjoying increasing popularity are similar treeplanting tours in Borneo and other tropical areas and tours to collect trash left by mountain climbers in the Himalayas as well as domestic can-collection tours and litter-cleanup campaigns at major tourist destinations.
1-2-2 Efforts to Overcome Obstacles
The gradual rise in environment-friendly lifestyles stems from the increasingly broad recognition of many environmental problems within Japan. This recognition does not always bring about changes in behavior, however, and it cannot yet be said that the trend of adopting environment-friendly lifestyles has deeply penetrated Japanese society as a whole. Moreover, in some cases, combinations of social and economic factors are working to stymie the movement toward environment-friendly lifestyles. In this section, we will examine the factors that are promoting and hindering moves to adopt environmentfriendly lifestyles, as well as responses to related situations.
Among the factors encouraging people to give due consideration to the environment in their everyday lives are such economic factors as the beneficial effects that reducing the consumption of energy and water can have on household finances. Other factors include the topicality of environmental issues, the consciousness that one's own behavior can actually help protect the environment, familiarity with recycling systems, and the environmental protection campaigns being carried out by certain merchants (Figure 1-2-11).
Fig. 1-2-11 Reasons for Engaging in Environment-Friendly Behavior
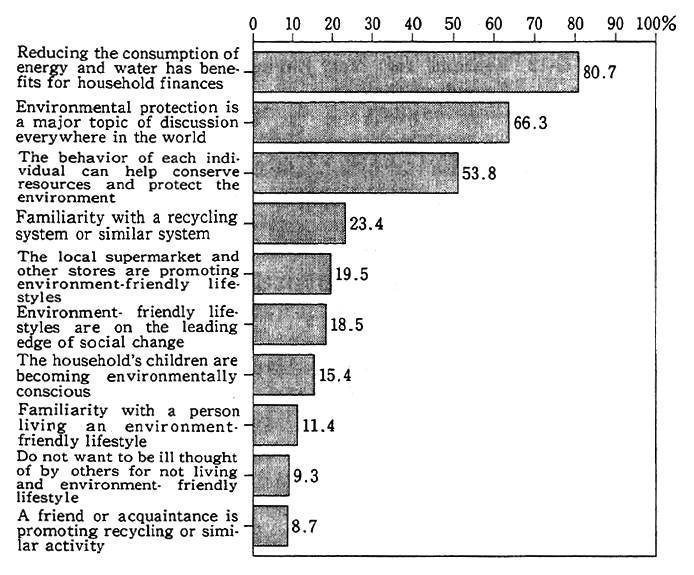
Source : Nissay Basic Research Center, Survey on the Ecolives of Urban Residents, 1993
The factors most commonly cited as discouraging people from giving due consideration to the environment during their daily lives are skepticism regarding the effectiveness of individual initiatives, lack of familiarity with environment-friendly products and services, and a lack of understanding of what actually needs to be done (Figure 1-2-12).
Fig. 1-2-12 Reasons for Not Engaging in Environment Friendly Behavior
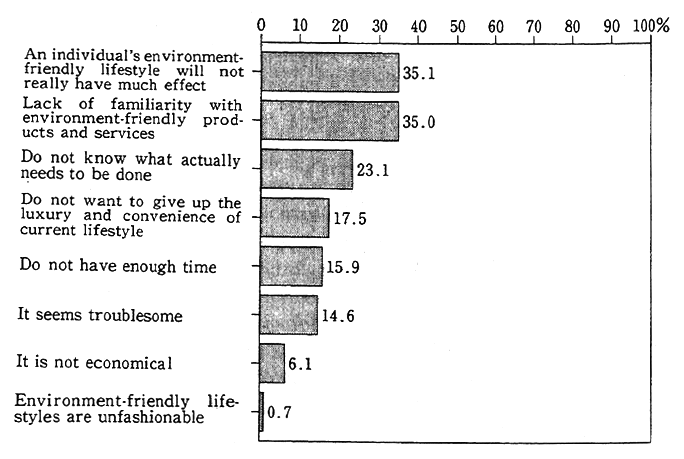
Source : Nissay Basic Research Center, Survey on the Ecolives of Urban Residents, 1993
Thus, it appears that one of the most important obstacles to the adoption of environment-friendly lifestyles is a lack of sufficient information on what needs to be done and on the ultimate effectiveness of doing what needs to be done. Aiming to fill this information gap, regional public- and private-sector organizations are distributing many easy-to-read publications, with such titles as Eco Life Guide Book and Life Environment Check List. Such efforts to promote the diffusion of information about environment-friendly consumption behavior among consumers are important.