Quality of the Environment in Japan 1995
(3) The Environment Agency has been examining the levels of chemical substances present in the environment since the fiscal year 1974. During the years from FY1979 through FY1988, the agency con-ducted a 10-year project named the first Comprehensive Environmental Survey of Chemical Substances. The objective of this survey was to efficiently and systematically examine those tens of thousands of exist-ing chemical substances, in order to assess their environmental safety.
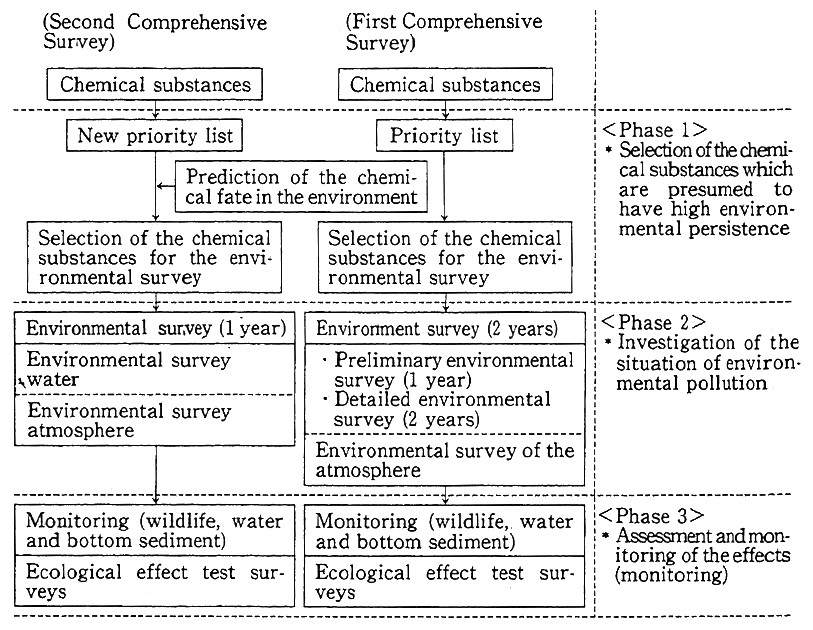
New measures must be taken to cope with changes that took place in those years, such as general manufacturing methods, lifestyles, possible new pollution created by highly-advanced technologies, and examination methods to accommodate advances of technologies, and so on. In May 1988, the Expert Committee on Chemical Substances of the Environmental Health Committee, Central Council for Environmental Pollution Control made a proposal regarding how the general inspection survey on environmental safety should be improved in the future. This proposal suggests the following: 1) expansion of types of chemical substances to be examined, 2) careful selection of substances to be examined utilizing a prediction of environmental fate of chemicals, and 3) general improvement of the examination by expanding types of substances to be examined and by reducing the time period of examina-tion. The Environment Agency has been enforcing the second Compre-hensive Environmental Survey of Chemicals since the fiscal year 1989, taking these suggestions into consideration. Figure 6-7-2 illustrates the system outline of Comprehensive Environmental Survey of Chemicals.
In the fiscal year 1994, environmental investigations of chemical substances, experiments to study ecological impact, monitoring of water and bottom sediments, biological monitoring, etc. were im-plemented according to this system.
Various studies have been continuously conducted with considera-tion of the expanded use of chemical substances. These include: investi-gation on evaluation methods of environmental hazard caused by vari-ous types of chemical substances emitted to multiple environmental media, from their production stage and their use ; review of legislation pertaining to environmental preservation; studies on improvement of information regarding chemical substances ; and studies on support to be given to local communities for controlling chemical substances.
Ever since their production was discontinued in 1972, PCBs have been kept in the custody of business owners without proper disposal methods being developed. To resolve this, a study on technologies for safe disposal of PCBs has been conducted. The study seeks PCB dis-posal methods other than destruction by incineration, such as chemical disposal methods, and also disposal methods of matter contaminated by PCBs.
Fig. 6-7-2 Outline of Compmchensive Envirohmental Survey of Chemicals
(4) In order to cope with environmental pollution caused by chemical substances, legislation requiring notification to assess safety of newly-introduced chemical substances prior to their production, importation, or marketing, have been enforced in countries such as Japan, the U. S. A., and many European countries. In the U. S. A., alerted by past major accidents caused by chemical substances, laws have been established concerning measures to be taken at times of accidents, notification of the amount of harmful chemical substances possessed and the amount emitted to the environment, etc. International organizations such as OECD, the World Health Organization (WHO), the United Nations Environment Programme (UNEP), etc. actively supervise various activ-ities to control hazards of chemical substance. Japan has been actively participating in these activities as well.
1) Activities of OECD
OECD established guidelines for the safety testing of newly-introduced chemical substance (Chemical Substances Safety Test Methods) and MPDs (minimum pre-marketing sets of data). OECD has also been conducting chemical hazards assessment projects (hazard assessments).
OECD has also investigated on GLP (good laboratory practice), exchange of information, and economic impact of chemical substance control.
As a result of these activities, various decisions and recommenda-tions on measures concerning control of chemical substances have been adopted.
OECD is currently promoting activities in which member coun-tries share the work of gathering, organizing, and providing information on the progress of safety testing of existing chemical substances (clear-ing house activities). Another project that OECD is currently promoting is an international project in which member countries test and investi-gate potential hazards of the existing high production volume chemical substances whick have been studied little as far as their safety is concerned.
2) Activities of WHO
In accordance with the decision made by the WHO General Assembly, the International Programme on Chemical Safety (IPCS) has been implemented in close cooperation with major research organiza-tions worldwide, under joint initiative with UNEP and the International Labor Organization (ILO). Activities of this program include: risk assessment of high priority chemical substances; development of health hazard evaluation methods ; publication of environmental health criteria for each substance, and so forth.
3) Activities of UNEP
UNEP initiated the International Registry of Potentially Toxic Chemicals (IRPTC) of which the objective is to collect and accumulate the existing information regarding impacts that chemical substances can have on humans and the environment, and to provide information regarding regulations for chemical substances in various countries. Operations such as publishing the profile of the data, answering ques-tions, publishing the IRPTC Bulletin, etc. have been carried out as well. The London Guideline, which specifies procedures of information exchange at the time of international trades of chemical substances that are prohibited or strictly controlled, adopted a system requiring notifi-cation to the importing country and approval of such substances prior to their trade (PlC).
4) Follow-up of Agenda 21
In June 1992, the United Nations Conference on Environment and Development (UNCED) adopted an action program called "Agenda 21," which is a compilation of the activities implemented by international organizations. Agenda 21 specifies items for which international tnea-sures should be taken as part of the "environmentally sound manage-ment of chemicals, including prevention of illegal international traffic in toxic and dangerous products." To follow-up Agenda 21, the Interna-tional Conference on Chemical Safety (ICCS) was held in April, 1994, and the Intergovernmental Forum on Chemical Safety (IFCS) was established. The items specified. in Agenda 21 are as follows
1) Expanding and accelerating international assessment of chemical risks
2) Harmonization of classification and labelling of chemicals
3) Information exchange on toxic chemicals and chemical risks
4) Establishment of risk reduction programmes
5) Strengthening of national capabilities and capacities for manage- ment of chemicals
6) Prevention of illegal international traffic in toxic and dangerous products
7) Enhancement of international cooperation
(5) With consideration to the international movements described above, the concerned ministries and agencies are actively working on coordinating the regulations of chemicals specified by OECD, safety inspections of the existing high production volume chemical substances, and so forth. They are also carrying out various activities in order to achieve the reliability of test data so as to promote mutual acceptance of data. Those activities include: improvement of domestic system concerning GLP adopted by the OECD Council; evaluation of proce-dures for ecological effect assessments; studies on comprehensive evaluation methods of chemical substance safety; collection and analy-sis of domestic and international information regarding chemical sub-stance safety.
As for the preparation of Material Safety Data Sheet (MSDS) intended for exchange of information regarding chemical substance safety among busineses the Guideline concerning Submission of Infor-mation regarding Safety of Chemical Substances has been established to promote the use of MSDS.
2. Comprehensive Environmental Survey of Chemicals
(1) Environmental survey
In the fiscal year 1993, the environmental survey for water was conducted for water and bottom sediments in 56 regions and for fish in 52 regions nationwide. Investigations on the high priority substances iprobenfos, tributyl phosphate, and tris (2-butoxyethyl) phosphate, were conducted in 56 regions nationwide. For the rest of 15 high priority substances, investigations were conducted in ten to 24 regions.
Environmental surveys of atmosphere were conducted in 18 loca-tions nationwide examining 20 substances.
1) Environmental survey (water)
Out of 18 high priority substances, four substances including iprobenfos, tris (2-butoxyethyl) phosphate, etc. were detected in the water. Four substances including iprobenfos, tricresyl phosphate, etc. were detected in samples of bottom sediments, and five substances including iprobenfos, tributyl phosphate, etc. were detected in fish (Table 6-7-1). The following is the summary of judgment toward the results of the survey this time:
i. Iprobenfos
Although it was detected in all media of water, bottom sediments and fish, the frequency of detection was low, and the levels of detection in the water and fish were low. It is judged that the results of this survey do not suggest any significant hazard.
ii. Tributyl phosphate
Since the frequency of detection in the samples of water and bottom sediments was high, it is judged that this is one of the substances that needs to be constantly monitored from now on for its level of existence in the environment. However, the data from this survey does not suggest immediate hazard since the level of detection in the water is low, and the level detected in fish is roughly one digit greater than the level detected in the water. Continuous monitoring is required to watch for change in detection levels.
Table 6-7-1 Result of Environmental Survey for Water (fiscal year 1993)
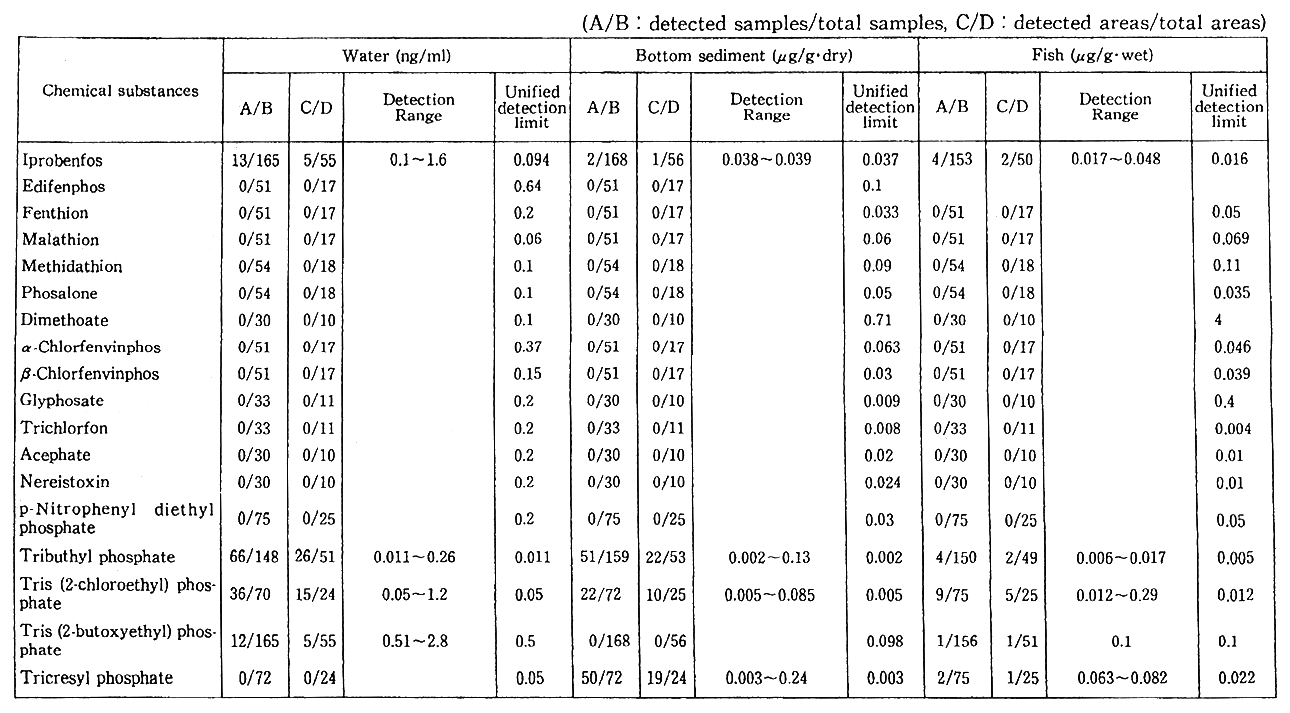
Note : Areas examined include only those areas with valid measurement values.
iii. Tris (2-chioroethyl) phosphate
The frequency of detection in water and bottom sediments was high. This substance is reportedly influential to daphnids even at low level. This is one of the substances that needs to be monitored carefully for its level of presence in the environment. However, the levels detect-ed in this survey do not suggest an immediate hazard. Environmental survey for this substance should be conducted on regular intervals to monitor change in detection levels. It is also necessary to investigate its potential impact to ecosystems.
iv. Tris (2-butoxyethyl) phosphate
Although it was detected in both water and fish, the frequency of detection was low and the level detected in the water was low. The level detected in fish was greater than the level detected in the water only by one digit. Therefore, it is judged that there is no immediate hazard indicated by the survey this time.
v. Tricresyl phosphate
Since the level detected in bottom sediments was high, this is one of substances that should be monitored constantly from now on for its level of presence in the environment. However, since it was not detected in water and the frequency of detection in fish was low, it is judged that the results of this survey do not suggest any immediate hazard. Environ-mental survey on this substance should be conducted at regular intervals to monitor change in detection levels.
2) Environmental survey (atmosphere)
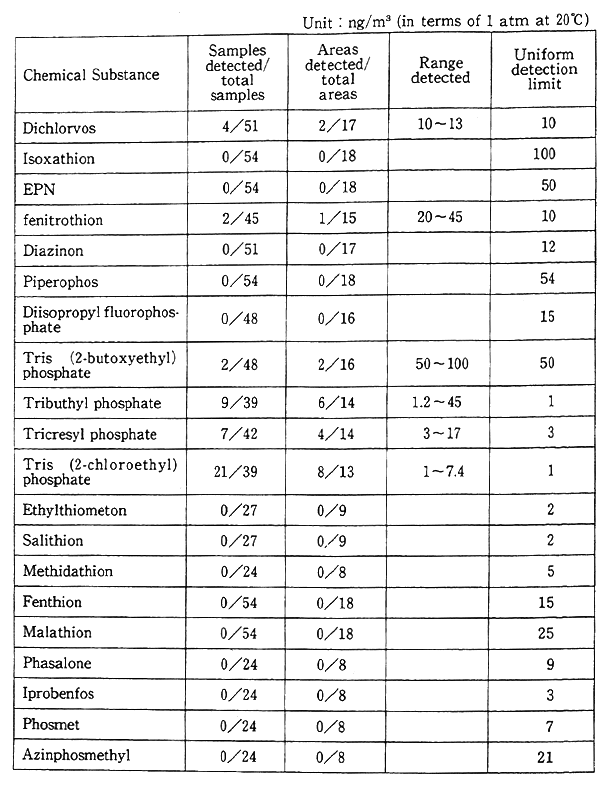
Out of six substances detected in the atmosphere, tributyl phos-phate, tricresyl phosphate, and tris (2-chloroethy1) phosphate were detected most often.
However, since the levels detected were low, it is judged that the results of this survey do not suggest any immediate hazard. Environ-mental survey on these substances should be conducted at regular intervals to monitor change in levels of detection (Table 6-7-2).
Table 6-7-2 Result of Atmospheric Environmental Survey (fiscal year 1993)
(2) Summary of monitoring of water and bottom sediments
Monitoring of water and bottom sediments has been implemented since the fiscal year 1986 as part of an environmental survey of chemical substances. The monitoring is performed by means of a gas chromato-graphy/mass spectrometer (GC/MS) which is capable of analyzing multiple chemical substances at the same time with high sensitivity. With this device, the chemical substances (mainly Class I Specified Chemical Substances) whose presence are confirmed in water or bottom sediments by the result of an environmental survey, are monitored for their long-term change in residual levels.
In the fiscal year 1993, environmental surveys on 19 substances were conducted in 19 areas nationwide. Ten substances including trans-chlordanes were detected in the water, and all 19 substances were detected in bottom sediments (Table 6-7-3).
None of the substances were detected in waters of six monitored areas. The average number of substances detected in the water of the other 13 areas was between one and four, which is considered low, except in the water at the mouth of the Yamato River in which nine substances were detected.
The average level of detection of the substances in bottom sedi-ments was higher than that detected in the water. More than five substances were detected in the waters of 17 areas ; more than half of the substances to be examined were detected in the waters of the 12 areas. By studying the highest detected levels of each substance examined, it is suggested that the contamination levels in enclosed inner bays are higher than in other areas.
(3) Summary of biological monitoring
Monitoring is conducted to observe residual chemical substances in organisms such as fish, shellfish, and birds to observe changes in environmental pollution over the years. The chemical substances to be looked for in the monitoring are among those classified as Class I Specified Chemical Substances according to the Chemical Substance Control Law, and also those that should be carefully monitored to prevent pollution judging from the result of the environmental survey of them.
In the fiscal year 1993, 24 substances were examined for their residual levels within organisms, in 20 areas nationwide. The result of this survey shows that substances such as PCBs, chiordanes (5 sub-stances) still remain in vast areas of the environment even though use of these substances has been discontinued, and that they need to be monitored carefully in future.
Table 6-7-3 Result of Monitoring of Water and Bottom Sediment (fiscaL year 1993)
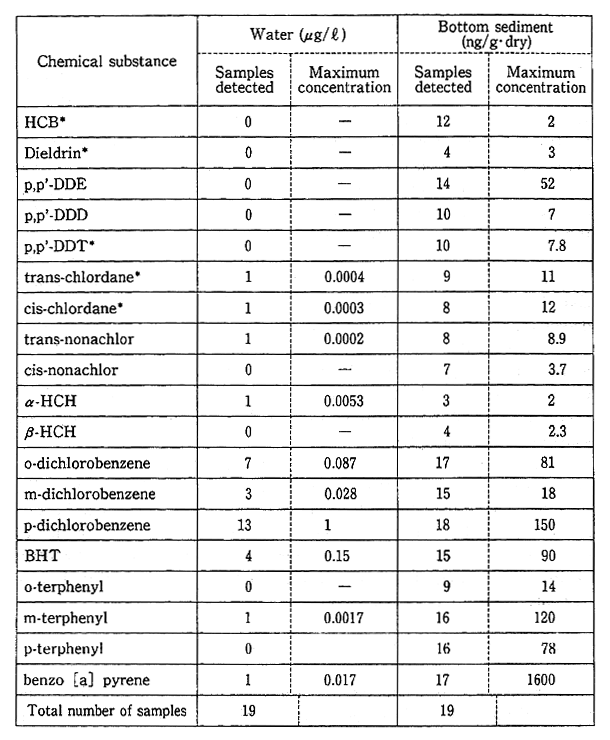
Note : "*" denotes Class I Specified Chemical Substances.
Concerning the status of environmental pollution caused by organotin compounds, the Expert Committee on Chemical Substances of Environmental Health Committee of the Central Environmental Council made the following judgments in consideration of the results of the biological monitoring together with the results of the survey of designat-ed chemical substance.
(Tributyl tin compounds)
Tributyl tin compounds was detected in vast areas of the environ-ment. Although its residual levels detected in water show a tendency towards improvement, the levels detected in wildlife, in which sub-stances accumulate more easily as compared to water, show no marked fluctuations. Current contamination levels do not suggest an immediate hazard. However, since high levels are detected at some locations, measures for environmental pollution should be continuously promoted and the status of the pollution should be monitored.
(Triphenyl tin compounds)
Although triphenyl tin compounds was detected in many organ-isms, its levels of contamination in water and organisms show a decreas-ing tendency, with few exceptions. Considering the current state of production of triphenyl tin compounds, its levels of contamination are expected to improve in the future. However, continuous measures for pollution control and monitoring are necessary.
3. Summary of Survey of Designated Chemical Substances
With the occurrence of the PCE-related environmental pollution problems as a turning-point, the Chemical Substance Control Law was established in 1973, in order to control chemical substances that have similar properties to PCBs (i.e., low degradability, high accumulability, and chronic toxicity). Amendments were made to the law in 1986 after the occurrence of underground water contamination caused by trichlor-oethylene and tetrachloroethylene. New stipulations such as Class II Specified Chemical Substances and Designated Chemical Substances were added to the law at that time. Also added to the law by the amendments are control systems that apply prior to and after execution of operations, such as notification of estimated and actual production or importation quantity.
As for Designated Chemical Substances, when pollution harmful to human health is expected to be caused by a certain substance, an investigation of toxicity of the substance is to be ordered. If the result of the investigation proves its toxicity, the substance is to be classified as Class II Specified Chemical Substances. Besides mandatory prior notification of their amount of production or importation, the Class II Specified Chemical Substances are subject to regulation of their amount of production or importation as necessary.
In order to understand the state of residual levels of the Designat-ed Chemical Substances and the Class II Specified Chemical Substances within the environment, the Environment Agency has started the Inves-tigation and Surveys on the Possibility of Designated Chemical Sub-stances Remaining in the Environment since fiscal year 1988. Investiga-tion areas were expanded and accuracy of measurement equipment was improved. In fiscal year 1990, the agency also started exposure route surveys (investigations on the amount of chemical substances in each environmental media that human being are exposed to in daily life). The agency adopted the unified detection limit method for their measure-ments. The name of the investigation was then changed to the Investiga-tion and Survey of Designated Chemical Substances, etc.
In the fiscal year 1993, the residual levels of four chemicals including 1,4-dioxane in the water and bottom sediments were inves-tigated in 34 areas, the residual levels of six chemicals including trich-loroethylene in the atmosphere were examined in 28 areas, and exposure route surveys were conducted in nine areas to examine six chemicals including trichloroethylene.
4. Summary of the Investigation of Pollution Caused by Chemical Substances Created Unintentionally
Chemical substances that were created unintentionally during processes of synthesization or incineration have caused environmental pollution. The Environment Agency has started the follow-up survey on pollution caused by toxic chemical substances in the fiscal year 1985, in an effort to understand environmental impacts caused by the residue of chemical substances that are created unintentionally. In the fiscal year 1993, the name of the project was changed to the Investigation of Pollution Caused by Chemical Substances Created Unintentionally since the objective of the investigation was to study chemical substances that have been created unintentionally.
In the fiscal year 1993, the monitoring of dioxins (a general term for polychlorodibenzo-p-dioxin (PCDD) and polycholorinated diben-zofuran (PCDF)) and an environmental survey on coplanar PCBs, a type of PCB that has a flat structure (does not contain replacement chlorine in its orthosite), were carried out.
The following are judgments made by the Expert Committee on Chemical Substances, Environmental Health Committee of the Central Environmental Council regarding dioxins:
1) The levels of dioxins present in the general environment are not considered harmful to human health at this point. However, even though dioxins levels detected are insignificant, it is necessary to continue monitoring changes in its levels of contamination.
2) It is also essential to strive to clarify its contamination mecha-nism, such as sources of generation and its behavior in the environment, and to collect knowledge on its toxicity.
Residue of coplanar PCBs in the environment is thought to originate from the emission of products containing PCBs to the environ-ment. Although use of PCBs was discontinued in 1972, and it has been classified as a Class I Specified Chemical Substance according to the Chemical Substance Control Law since June 1974, the status of pollution caused by PCBs should continuously be investigated and changes in its levels should be monitored uninterruptedly.
Section8. Environmental Conservation Measures in Land Utilization
1. Rational Land Use
The objective of the National Land Use Plan is to give priority to public welfare and ensure long-term well-balanced use of national land while conserving the natural environment. It is an administrative guide-line for the use of national land.
In conformity with the amendments of the National Land Use Plan (a national plan) in December 1985, revisions were made to all National Land Use Plans (local plans)' in each prefecture.
The national plan is to be revised in 1995 in view of the following considerations; 1) the present plan is set to be completed in 1995; 2) there is a large gap between targeted and actual conditions for goals for size classified by use; 3) new issues have arisen after establishing the present plan; such as rise of pi.ibl-ie interest in environmental conserva-tion, serious land issues, the rapid aging of its. poulation, increase of areas with low population, and the advance of resort development
There are 1,764 municipalities which had their own National Land Use Plans (municipal plans) as of the end of March, 1994 To establish a system to promote National Land Use Plans, the Govern-ment is providing support to those prefectures that carry out adminis-trative operations for the Plan The Government is also working on preparation of operation manuals for the plan and development of a support system for establishment and revision of the National Land Use Plan.
The Land Use Master Plan is to he formed by the governor of each prefecture in accordance with the National Land Use Plan This plan designates five areas classified by their usage and indicates items concerning coordination of land use This plan is superior to those plans that have been established in accordance with individual laws such as the City Planning Act, Natural Parks Law, and functions as a compre-hensive coordinating plan for the administration.To promote appropri ate and rational land use, this plan should take part directly in land dealings. As for land development, this plan should be used indirectly as a standard, as individual laws take precedence over this plan As of the end of March 1994, approximately 9.72 million ha has been designated for urban areas, approximately 17.34 million ha for agricultural areas, approximately 2552 million ha for forest areas, approximately 535 million ha for natural park areas, and approximately 0 1 million ha for nature conservation areas The areas not included in any of these five, are approximately 0.24 million ha.
2. Appropriate Location of Industry
In order to pesolve industrial pollution radically, at is essential to have appropriate planning of industry locations. Restrictions for the locations of new factories have been enforced in large cities by the strict application of laws such as the Law concerning Restrictions on Indus-tries, Etc., in Bwild-Up Districts in the National Capital Region.
Efforts have .been made to promote industrial relocation and new or additional constructions of factories in areas inviting industries, in accordance with the Industrial Relocation. Promotion Law Various activities were carried out such as. effective use of System of Subsidies for the Promotion of Industrial Relocation creation of core industial parks by the Regional Promotion and Development Corporation. and loans provided by Japan Development Bank, etc.
In the course of implementing measures for industrial relocation, guidance was given to ensure that environmental consideration was duely mado in the establishment of a factory Use of the sites where factories used to exist, has been planned carefully so as to contribute to improvement of the urban environment
For those small factories that are located in residential areas and are causing environmental pollution, the Japan Environment Corpora-tion has been making efforts to have them move into industrial parks in locations collectively as a group where it is appropriate The corpora-tion carries out construction and transfer of group factory facilities, according to companies' requests The Small Business Promotion Cor-poration, in cooperation with prefectures, provides various support to small businesses For those small businesses that are scattered in urban areas, the corporation builds industrial parks in the suburbs into which those businesses can move, and also provides loans to small businesses for funds necessary to build cooperative factories
Concerning individual factory locations, measures to improve the industrial environment were promoted in accordance with the Stan-dards concerning Factory Locations based on the Factory Location Law, in order to keep harmony with the surroundings. Loans for improv-ing the factory environment were provided by the Japan Development Bank and the Small-and Medium-sized Business Corporation. Also, loans for promoting industrial relocation for the purpose of pollution prevention were provided by the Small-and Medium-sized Business Corporation.
3. Improvement of Green Buffer Zones
To prevent industrial pollution and natural disasters and to improve the environment, measures for the appropriate use of land in the area need to be taken. Creating a green buffer zone between an industrial area that could cause pollution or disaster and an residential and commercial area is one of those measures. The Ministry of Con-struction provides subsidies to local governments and the Japan Envi-ronment Corporation in order to promote improvement of green buffer zones In the fiscal year 1994, the ministry provided subsidies for 11 projects including 4.2 billion yen provided to the Matsumoto Airport Green Buffer Zones (Matsumoto city). The Japan Environment Corpora-tion promotes improvement of green buffer zones by transferring im-proved green buffer zones to local governments.
The Ministry of Transport has carried out green buffer zone improvement operations for nine airport areas including Osaka Airport and Fukuoka Airport (fiscal year 1994 project expenditure 87 billion yen)
Section9. Promotion of Environmental Education, Preservation Activities, and Public Relations
1. Promotion of Environmental Education
(1) Education and learning about environmental issues
Recently, pollution originating from urban areas or lifestyles, and global environmental issues are becoming the main focus of all environ-mental problems At the same time, people's desire to commune with their natural surroundings, and for preserving and creating a pleasant environment is on the increase In coping with these intricate and diverse environmental problems, it is essential that every single person has sufficient understanding and awareness toward the relation between the environment and man, and that every person maintains a lifestyle with consideration to the environment Promoting environmental educa-tion and active learning comprehensively, in conformity with the Basic Environment Plan, is critical from now on People from all age groups should be involved in this movement at every possible opportunity, such as at school, in communities, at home, at work place, etc
In an attempt to increase the awareness of people toward envi-ronmental problems, the Environment Agency took measures such as broadcasting shows, producing movies, holding seminars, making and distributing educational materials, and so on The agency also carried out various activities to spread knowledge on environmental preserva-tion such as holding the environmental conservation vision sympo-sium, environmental education symposium, symposium on environmen-tal amenities. and conducting investigation on how environmental conservation activities should he carried out
The Local Environment Conservation Fund, funds established in the fiscal year 1989, in all prefectures and ordinance-designated cities, was used to promote active and effective environmental education projects in each community For those people who are m charge of the environmental education in those local governments mentioned above, an environmental education seminar and the national liaison conference, a conference intended for promotion of information exchange, were held. Also, an environmental education database which is a compilation of information containing examples of the environmental education projects, was provided.
Since there is a general understanding that the cooperation among the concerned ministries and agencies, especially between the Environment Agency and the Ministry of Education, is very important in promoting environmental education, those two parties have agreed to maintain close communications in this respect.
The Ministry of Education enforced various activities to promote social education on environmental issues. Those activities include: implementing comprehensive social educational projects that offer opportunities for environmental learning and activities ; planning and developing projects that deal with environmental education on a regional basis and the demand for environmental learning opportu-nities; providing financial aid to those municipalities that implement support projects to activate social educations ; and producing reference material intended for instructors of social environmental education.
To promote national movements concerning the conservation of resources and energy, the concerned ministries and agencies have been conducting activities to enlighten the people on environmental issues to help create lifestyles that are in harmony with the global environment. The Economic Planning Agency promoted various voluntary consumer activities.
(2) Scholastic education on environmental conservation at schools
Conventionally, environmental, education at schools has been provided in subjects such as social studies, science, physical and health educations, etc. Significant improvement has been made in current teaching schemes in respect to environmental issues.
To further promote environmental education at schools, the Ministry of Education has produced and distributed instructors' refer-ence material for elementary, middle, and high schools. The ministry is currently in the process of producing a case study edition. The ministry also designated ten municipalities as the Environmental Education Promotion Model Municipality in which environmental education is to be promoted with cooperations among schools, homes, and commu-nities. The environmental education fair was held in Saitama Prefec-ture. Various research conferences concerning how environmental edu-cation should be provided in the future were held, and presentations and exhibitions on various environmental activities were made at the fair. In order to improve the capacity of teachers in charge of environmental education, a seminar for them was held at Tokyo Gakugei University.
2. Promotion of Environmental Conservation Activities
(1) General environmental conservation activities
To resolve current environmental problems, voluntary and active efforts to lower the burden on the environment created by daily living and business activities should be made by the people and businesses. The Basic Environment Plan is to promote voluntary environmental man-agement and desired activities.
Recently, as people's interests in environmental problems grows, there is an increasing number of people who are willing to participate in environmental conservation activities. Many businesses have an interest in activities that are beneficial to environmental preservation as well. However, there are emerging problems and confusion in real situations as to what activities are "friendly to the environment," how one can participate in environmental conservation activities, and so on. It is required that appropriate information be given, social conditions be improved, and measures to further promote environmental preservation activities by the people and businesses be enhanced.
Concerning promotion of citizens' environmental conservation activities, the Environment Agency held the environmental conservation activities study meeting in Saitama Prefecture in the fiscal year 1994. The agency also collected and provided information in order to support local governments' policies for promoting environmental conservation activities funded by the Local Environment Conservation Fund. For promoting consumption patterns with more consideration to the envi-roninent, the Government supervised the Eco-mark system, and in fiscal year 1994 established an Advisory Group concerning New Directions of Environmentally Friendly Products to explore new policies on environ-mentally friendly products, including the Eco-mark products. This advisory group discussed such matters as introduction of a concept of life cycle assessment to Eco-mark and selection of Eco-mark product categories from the standpoint of the Government's environmental policy.
As for promotion of environmental conservation activities con-ducted by business organizations, the Environment Agency is striving to spread the Guideline on Corporate Activities Amiable to the Environ-ment which was made public in February 1993. The agency has also conducted surveys on the state of corporate environmental conservation activities yearly since 1991, and broadly provided related information on a large scale.
The life cycle assessment (LCA) is a method to quantitatively, scientifically, and objectively understand and evaluate the burden creat-ed by products to the environment by the cycle of production-consumption-disposal. The concerned ministries and agencies are con-ducting investigations of The method from the technical standpoint, while considering the progress of studies of standardization by the International Organization for Standardization (ISO).
The Ministry of International Trade and Industry is taking measures based on the Law concerning Improvement of Laws pertain-ing to Upgrading of Energy Demand and Supply Mechanism, which was enforced in April 1993 (partially enforced in August 1993), and also taking various support measures based on the Law of Provisional Measures for Projects and Activities to Rationalize Use of Energy, Etc., and Utilize Recycled Resources which was enforced in June 1993. In October 1992, the ministry requested corporations to establish Environ-mental Voluntary Plans, and conducted an interim investigation on it in December 1994. The result of the investigation revealed that 362 corpo-rations have established plans, and the number is expected to increase in the future.
Works on international standardization concerning environmen-tal management have been in progress by the International Organiza-tion for Standardization (ISO), which is a non-goveramental interna-tional organization that promotes international standardization in order to ensure smooth international trades. Japan is among those actively participating in the international standardization activities. In June 1993, the Environmental Management Standards Council was estab-lished, with members consisting of individuals with expertise and expe-rience, industries, and consumers, under the Japan Industrial Standards Council (JISC), a member organization of ISO.
(2) Promotion of global environmental conservation activities by private organizations
Recently, various activities for global environmental conserva-tion have been actively conducted by private organizations, especially in the U. S. A. and European countries. In Japan, a growing number of private organizations have been operating various environmental con-servation activities, such as tree-planting, protection of wildlife, not only domestically, but also in many developing countries and other areas. And people in various fields have growing interest in these movements. To conserve the global environment, these grass-roots movements and participation of the people from various fields are essential. Especially in Japan, activities operated by private organiza-tions (so called non-governmental organizations, NGOs) in both areas of socioeconomic system reform and more intensified support for develop-ing countries, need to be strengthened. Therefore, supporting these activities is a pressing matter.
The Basic Environment Plan, which was decided upon by the Cabinet in December 1994, puts forth promotion of specific activities to conserve the environment as a chief policy of voluntary and positive activities by each sector. The plan also indicates to encourage activities by private sector.
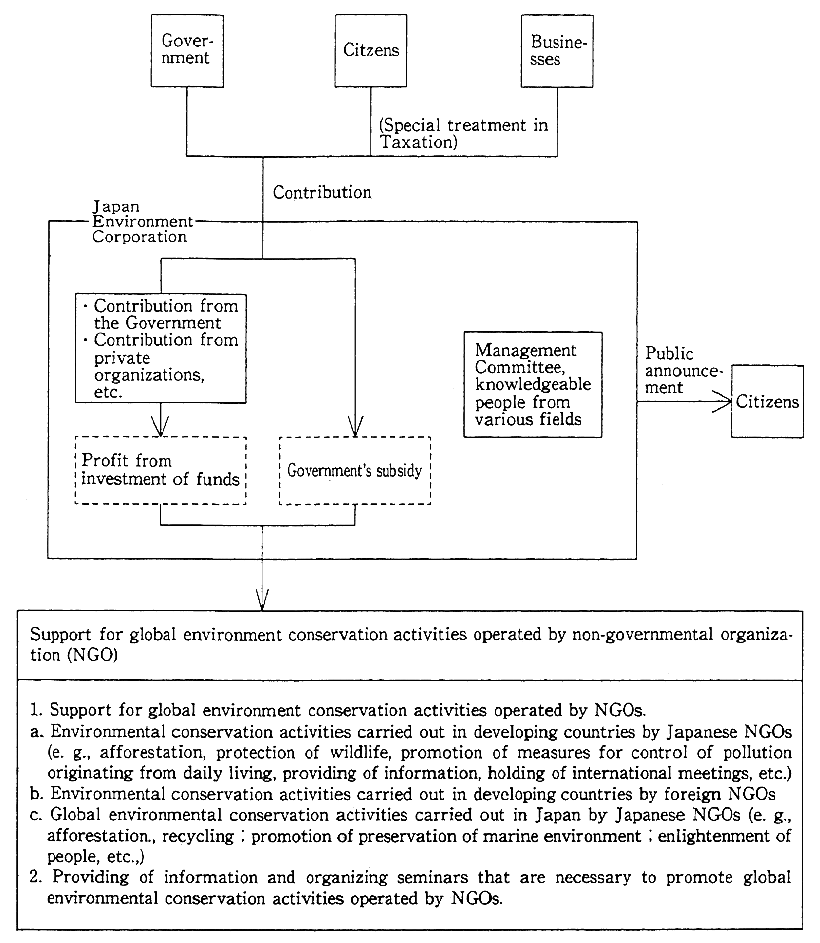
The Japan Environment Corporation has conducted numerous activities utilizing the Japan Fund for Global Environment which was established in May 1993, by governmental and private contributions. Those activities include support for activities operated by domestic and overseas private organizations such as afforestation and protection of wildlife in developing countries; support for activities domestically operated by Japanese private organizations such as afforestation, recy-cling; research and study necessary to promote these activities ; and the providing of information in regard to these activities (Figure 6-9-1).
In the fiscal year 1994, there were 363 requests for financial support from various private organizations. Approved were 157 cases for support, totaling approximately 630 million yen (Table 6-9-1).
Activities to conserve the environment carried out by private organizations are supported by various governmental support systems such as: financial support for NGOs projects and grant aid for grass-roots groups both provided by the Ministry of Foreign Affairs ; contri-butions made by sales of postcards by the Ministry of Posts and Telecommunications; and the International Volunteer Savings System.
(3) Promotion of recycling activities
In conformity with the amendments made to the Law concerning Promotion of the Utilization of Renewable Resources and the Law concerning Waste Disposal and Public Cleansing, which specifies the recyding of waste, recycling activities by various sectors need to be further promoted.
Fig. 6-9-1 Mechanism of the Japan Fund for Global Environment
Every October, which is designated as Recycling Promotion Month, all ministries and agencies concerned with recycling including the Economic Planning Agency, Environment Agency, Ministry of Finance, Ministry of Health and Welfare, Ministry of Agriculture, Forestry, and Fisheries, Ministry of International Trade and Industry, Ministry of Transportation, and the Ministry of Construction, are to conduct extensive campaign to gain understanding and cooperation of the people toward promoting the use of recycled resources. In the fiscal year 1994, various symposiums were held and awards were presented to those who contributed to the promotion of recycling.
The Environment Agency made progress in research and studies of recycling, and also produced and distributed materials for the promo-tion of recycling.
The Economic Planning Agency provided support to recycling organizations through Resource Conservation Local Promotion Confer-ence" which are established in each prefecture.
The Ministry of Health and Welfare provided support to projects concerning the establishment of waste utilization systems and organiza-tions in an effort to improve the systems of local government. In the fiscal year 1993, the ministry conducted various activities to promote reduction and recycling of waste such as the designation of Waste Reduction Promotion Week (30 May through 5 June).
To further promote recycling, studies on measures for recycling from an economic standpoint were conducted by the concerned minis-tries and agencies. The Environment Agency has been studying this issue since 1992, and has published a report of economic measures for recycling study group in April 1994.
(4) Preventing of the littering of empty cans
The production of canned drinks has drastically increased. Approximately ten billion cans of drinks were produced back in 1981; the production in 1993 was more than 31.8 billion. Some of these empty cans are littering roads, beaches, and rivers, contributing to marring the appearance of the environment. The Environment Agency conducted surveys in some 700 municipalities nationwide, in the fiscal year 1993 about the problem of empty cans. The result shows that, as compared to the past few years in which the number of littered cans remained on the same level, the situation is getting worse.
Various measures are being taken to prevent the problem. The measures of local governments include: establishment of regulations concerning the prevention of littered cans; litter prevention campaigns, and strengthening of cleaning activities. Some of the local governments use empty can collecting machines which issue tickets according to the number of cans thrown into the machine, that are redeemable when purchasing books. Others adopt deposit system to promote collecting of empty cans.
The Government is striving to enhance promotion activities in conformity with the agreement made in the Liaison Council on the Problem of Empty Cans which consists of representatives from 11 concerned ministries and agencies. The Environment Agency and the Ministry of Health and Welfare jointly requested local governments to establish the Environmental Beautification Action Day in order to encourage active participation from the people in every field in the environmental beautification movement, including the prevention of empty cans littering.
3. Public Relations
(1) General public relations
Various public relations activities were carried out by means of all forms of media including TV, radio, newspaper, and magazines, PR bulletin Kankyo (The Environment,) billboards, and movies to appeal to the people regarding the importance of environmental preservation. Also, press conferences were held and related reference materials were distributed.
(2) Central commemoration ceremony of the Environment Day
In accordance with the Basic Environment Law enforced in November 1993, 5 June has been designated as the Environment Day with the objective of enhancing the people's interest and understanding toward environmental preservation as well as heightening their spirit to actively participate in environmental activities. To celebrate this while pledging to further intensify environmental conservation activities, the Central Commemoration Ceremony was held.
(3) Activities during the Environment Month
During the month of June, which has been designated as the Environment Month, an environmental exhibition the Eco-Life Fair was held with the theme being "Let's make friends with the Earth!" Award-giving ceremonies for those who contributed to environmental conserva-tion works and other events whose themes were environmental conser-vation were held as well during this month. Local governments were requested to conduct environment-related events to raise the people's awareness toward environmental issues. A total of 15,630 trees were planted in 208 locations such as welfare facilities, in 45 prefectures and ordinance-designated cities, in cooperation with local governments.
(4) Appeal for the establishment of the Environmental Beautification Action Day
In order to boost and nationalize the environmental beautifica-tion movements carried out in many local communities, the establish-ment of the Environmental Beautification Action Day was promoted to local public entities by the Environment Agency and the Ministry of Health and Welfare.
Section10. Understanding of Local Environmental Situations
1. System to Understand Local Environmental Situations
In order to quickly and precisely understand information on specific environmental problems that happen in all parts of the country, some works related to administrative duties of the Environment Agency, such as investigations, collection and arrangement of reference materials, etc., are partly handled by the Regional Administrative Inspection Bureaus, Regional Administrative Inspection Branches and Administrative Inspection Offices (referred to as "Regional Bureaus, etc." hereafter), which are local subdivision bureaus of the Management and Coordination Agency. Currently, there are 48 inspection officers stationed at the Regional Bureaus, etc., and the Director-General of the Environment Agency directly supervises the managers of the Regional Bureaus, etc.
In addition, four environmental inspection officers are stationed at the Minister's Secretariat of the Environment Agency, whose duties include: communications and coordinations with the Regional Bureaus, etc. ; investigations on local environmental situations related to admin-istrative duties of the Environment Agency ; collection and arrange-ment of reference materials; administrative duties concerning environ-ment monitors; and counseling on administrative duties.
2. Understanding Local Environmental Situations of the Fiscal Year 1994
(1) Collecting information by inspection officers stationed at Regional Bureaus, etc. of the Management and Co-ordination Agency
In the fiscal year 1994, the Environment Agency received 23,703 cases of information concerning local environmental situations, which were reported by inspection officers who are constantly watching the state of the local environment. The major cases reported were; infor-mation concerning protection of nature or wildlife, environmental impacts caused by various development projects, wastes, activities to create a pleasant environment, etc.
(2) Collecting information from environment monitors
In an effort to better understanding of opinions and demands about environmental issues from the people nationwide, 1,500 environ-ment monitors are placed throughout the country. Opinions and demands from these monitors are being used effectively in planning of various measures of the Environment Agency. Questionnaires concern-ing "pollution created by light" were answered by these monitors.
(3) Collection and arrangement of reference materials
The followings are the major data collected and arranged by inspection officers:
1) Information on the local environment, etc.
i. Nationwide environmental situations: Information on environ-mental issues classified by each prefecture or metropolis.
ii. Measures for environmental preservation: Information on mea-sures for environmental preservation that have been enforced by a prefecture at its cost.
2) The present condition of enforcement of envirorment-related laws
Information regarding with the present condition of enforcement of laws such as the Air Pollution Control Law, Water Pollution Control Law, Noise Regulation Law, Vibration Regulation Law, and Offensive Odor Control Law, in each prefecture and ordinance-designated city.
3) Collection of other information
A fact-finding survey on the problem of empty cans was conduct-ed in some 700 municipalities nationwide, with the cooperation of Regional Bureaus, etc.
Chapter7. Current Condition and Measures for Air Pollution, Noise, Vibration, and Offensive Odor
Section1. Current Condition of Air Pollution
The following are the condition of air pollution classified by substance according to the data acquired at air pollution monitoring stations nationwide.
1. Nitrogen Dioxide
(1) Changes in yearly averages
1) General air pollution monitoring stations
In the fiscal year 1993, data of nitrogen dioxide levels were obtained at 1,419 valid monitoring stations in 676 municipalities. (A valid monitoring station is a station that has conducted monitoring for a time period of at least 6,000 hours per year. This applies to the entire section.)
Figure 7-1-1 shows the changes of yearly averages measured at 1,143 continuous monitoring stations for the past ten years. The yearly mean of 1993 was 0.017 ppm, which is the same as 1992, showing fluctuations while remaining at high levels. Long-term changes are explained in Part 1, Chapter 5, Section 1.
2) Road-side air pollution monitoring stations
In fiscal year 1993, data of nitrogen dioxide levels were obtained at 350 valid monitoring stations in 199 municipalities.
The changes in annual averages measured at 236 continuous monitoring stations which have been taking measurement for the past ten years are shown in Figure 7-1-1. The annual mean value of 1993 was 0.034 ppm, which is the same as in 1992, showing fluctuations while remaining at high levels. Long-term changes are explained in Part 1, Chapter 5, Section 1.
Fig. 7-1-1 Changes in Annual Means of Nitrogen Dioxide Levels
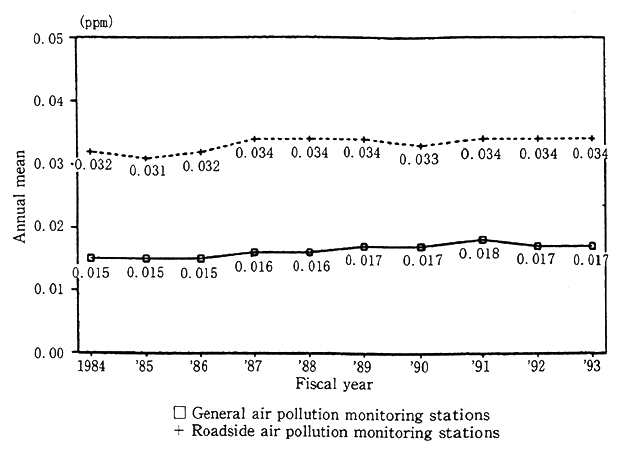
Note: These are the changes of yearly means of nitrogen dioxide levels measured at the stations which had continuous measure-ments since 1970 (since 1971 for the roadside monitoring stations).
(2) Achievement status of environmental quality standards
The environmental quality standard for nitrogen dioxide was revised as Notification No. 38 of the Environment Agency (referred to as "the Notification" hereafter in this paragraph) in July, 1978, which specifies "daily average of hourly values shall be within the range from 0.04 ppm to 0.06 ppm or below." The Notification specifies that, in areas where the daily average exceeds 0.06 ppm, the daily average of 0.06 ppm shall be achieved within seven years in principle (Notification 2-1). The Notification also specifies that, in areas where the daily average is within the range between 0.04 ppm and 0.06 ppm, the level should be maintained within the range, preventing drastic excess of the current level, in principle (Notification 2-2). The achievement status of the environmental quality standard is evaluated by comparing the value equivalent to 98% from the lower end of the daily means of a year (referred to as "98% value of daily mean" hereafter) with the standard value.
Figure 7-1-2 shows the achievement status of the environmental quality standard at 1,419 general air pollution monitoring stations and 346 roadside air pollution monitoring stations (excluding stations of which test sample intakes are located on the road).
As for general air pollution monitoring stations, the ratio of the number of stations with 98% value of daily mean exceeding the upper limit of 0.06 ppm decreased in 1978, and has been leveling off recently with slight fluctuation. The ratio in the fiscal year 1993 was 4.4%, which although is an increase from 2.6% of the previous year, is lower the ratio of 1990 and 1991.
As for roadside air pollution monitoring stations, there were 114 stations with 98% value of daily mean exceeding 0.06 ppm. Locations of those stations are mostly in urban areas such as Tokyo, Osaka, Kana-gawa, etc.
(3) Changes in levels measured in areas of which the level of nitrogen dioxide is within the range specified in the environmental quality standard
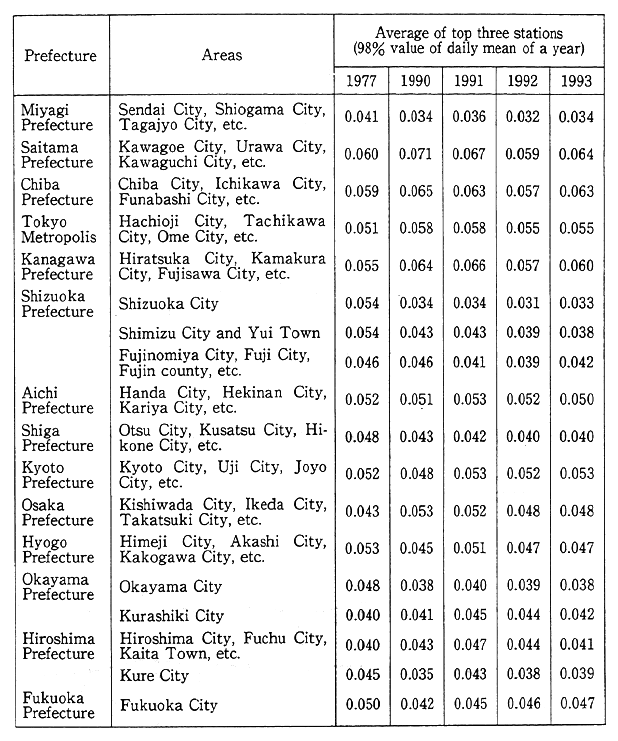
Table 7-1-1 shows the changes in nitrogen dioxide levels mea sured in areas of which the daily means come between 0.04 ppm and 0.06 ppm as specified in the environmental standard, according to the results of the measurements conducted in 1977, and from 1989 through 1993 during which the levels measured apply to the description of 'the current level' in the Notification 2-2.
(4) Nitrogen monoxide
1) General air pollution monitoring stations
In the fiscal year 1993, data of nitrogen monoxide levels were obtained at 1,419 valid monitoring stations in 676 municipalities.
The yearly mean of 28 stations that have been taking measure-ments since 1971 has been decreasing ever since, and has practically leveled off in the past ten years. The yearly mean of 1993 was 0.021 ppm, which is the same as 1992.
Fig. 7-1-2 Changes in Achievement Status of Environmental Quality Standards concerning Nitrogen Dioxide
(General air pollution monitoring stations)
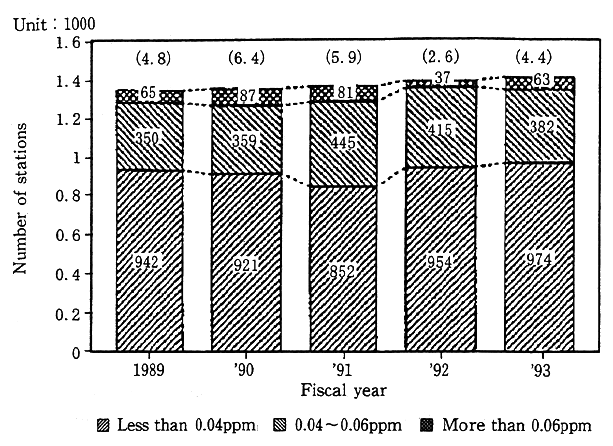
Figures in parenthesis are the ratios of stations at which the levelsexceeded 0.06ppm.
(Roadside air pollution mqnitorring stations)
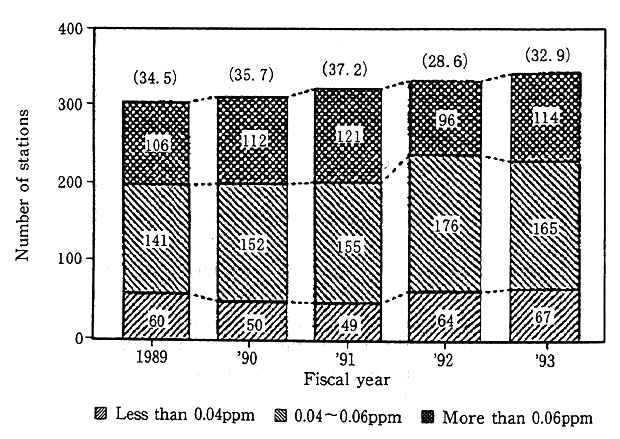
Figures in parenthesis are the ratios of stations at which the levelsexceeded 0.06ppm.
Table 7-1-1 Changes in Nitrogen Dioxide Levels in Areas of which the Daily Means come between 0.04ppm and 0.06ppm (general air pollution monitoring stations)
Note: Data by the Environment Agency
2) Roadside air pollution monitoring stations
In the fiscal year 1993, data of nitrogen monoxide levels were obtained at 350 valid monitoring stations in 199 municipalities.
In the fiscal year 1993, the annual mean of 21 stations which have been taking measurements since 1971 (same as those that measured nitrogen dioxide levels) was 0.061 ppm, which is almost the same as 0.062 ppm of 1992.
2. Suspended Particulate Matter
(1) Changes in yearly averages
1) General air pollution monitoring stations
In the fiscal year 1993, data of suspended particulate matter levels were obtained at 1,440 valid monitoring stations in 673 municipal-ities.
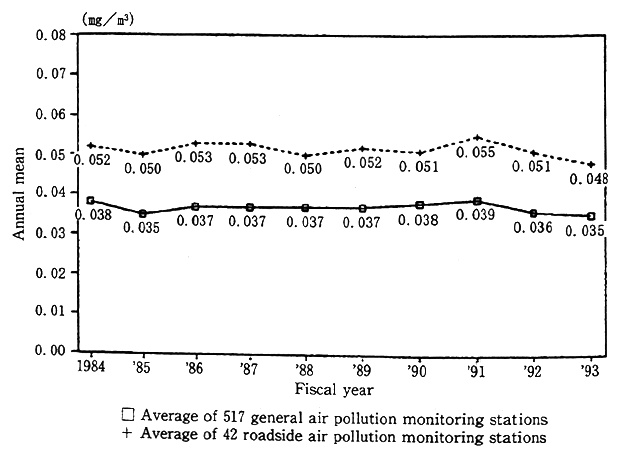
Figure 7-1-3 shows the changes in the yearly means at 517 stations which have been taking measurements for the past ten years. The annual mean of 1993 was 0.035 mg/m3 which is a slight decrease as compared to 0.036 mg/m3 of 1992. Long-term changes are explained in Part 1, Chapter 5, Section 1.
Fig. 7-1-3 Changes in Annual Means of Suspended Particulate Matter Levels
2) Roadside air pollution monitoring stations
In the fiscal year 1993, data of suspended particulate matter levels were obtained at 191 valid monitoring stations in 134 municipal-ities.
Figure 7-1-3 shows the changes in annual means measured at 42 monitoring stations which have been taking measurements for the past ten years. The annual mean value of 1993 was 0.048 mg/m3, which is a decrease as compared to 0.05 1 mg/m3 of 1992. Long-term changes are explained in Part 1, Chapter 5, Section 1.
(2) Achievement status of the environmental quality standard
To meet the standard of a long-term evaluation, the daily average derived from the measured values excluding those within the higher 2% range should be 0.10 mg/m3 or less, and also there should not be occasions where the daily mean exceeds 0.10 mg/m3for two consecutive days in a period of one year.
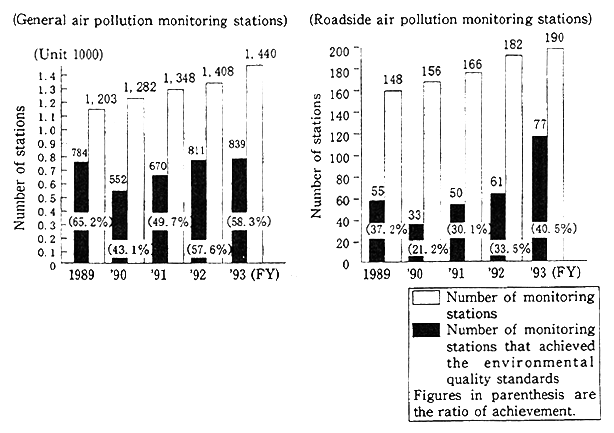
Fig. 7-1-4 Change in Achievement Status of Environmental Quality Standards concerning Suspended Particu-late Matter
Notes:1. Data by the Environment Agency.
2. Excluding those roadside air pollution monitoring stations of which the sample intake is located on a road.
The achievement ratios of the environmental quality standard for long-term evaluations were 57.6% in 1992, and 58.3% in 1993 at general air pollution monitoring stations, and were 33.5% in 1992, and 40.5% in 1993 at road-side monitoring stations. The achievement ratios increased at both types of monitoring stations (Figure 7-1-4).
3. Sulfur Dioxide
(1) Changes in annual averages
1) General air pollution monitoring stations
In the fiscal year 1993, data of sulfur dioxide levels were obtained at 1,600 valid monitoring stations in 688 municipalities.
Figure 7-1-5 shows the changes in the annual means at 1,352 stations which have been taking measurements for the past ten years. The annual mean of 1993 was 0.005 ppm, which is a slight decrease as compared to 0.006 ppm of 1992. Long-term changes are explained in Part 1, Chapter 5, Section 1.
2) Roadside air pollution monitoring stations
In the fiscal year 1993, data of sulfur dioxide levels were obtained at 83 valid monitoring stations in 64 municipalities.
Figure 7-1-5 shows the changes in annual means measured at 41 monitoring stations which have been taking measurements for the past ten years. The annual mean value of 1993 was 0.007 ppm, which is a decrease as compared to 0.009 ppm of 1992. Long-term changes are explained in Part 1,Chapter 5, Section 1.
(2) Achievement status of the environmental quality standard
1) Achievement status of the environmental quality standard according to long-term evaluations
To meet the standard of a long-term evaluation, the daily mean derived from the measured values excluding those within the higher 2% range (i.e., when there are 365 measured values in one year, the seven highest daily means are to be excluded, and the eighth highest daily mean is to be used for judgment) should not exceed 0.04 ppm, and also there should not be occasions where the daily mean exceeds 0.04 ppm for two consecutive days in a period of one year.
Fig. 7-1-5 Changes in Annual Means of Sulfur Dioxide Levels
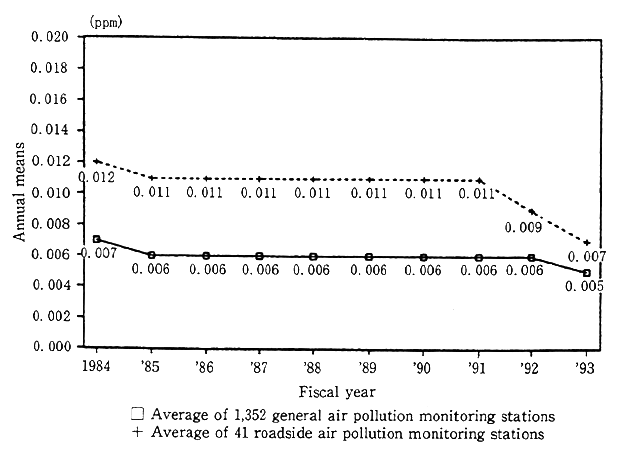
Note: These are the changes of yearly means of sulfur dioxide levels measured at the stations which had continuous measurements since 1965 (since 1973 for the roadside monitoring stations).
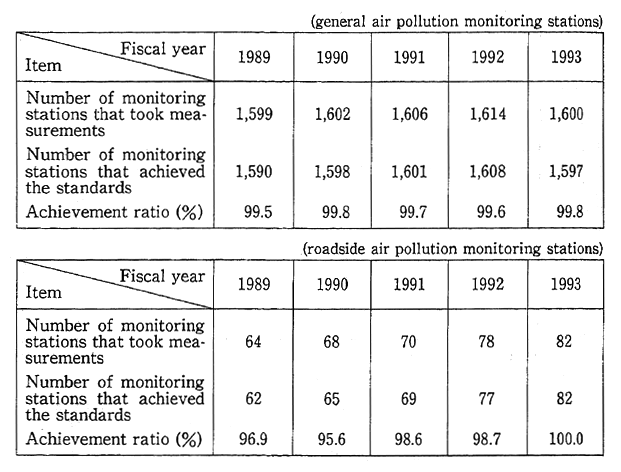
Table 7-1-2 shows the transition of achievement status of the environmental quality standard based on long-term evaluations. It has been maintained at a high level for the past few years.
2) Achievement status of the environmental quality standard according to short-term evaluations
As to the measurements taken at general air pollution monitoring stations, the ratio of the number of stations of which the daily mean of all valid measurement days was 0.04 ppm or less, against the number of all valid stations was 99.8% in 1993, a slight increase as compared to 99.6% in 1992. The ratio of the number of stations that recorded 0.1 ppm or less in one hour at any measuring time, against the number of all valid stations was 96.8% in 1993, a slight increase as compared to 96.3% in 1992. Changes in ratios remain at high levels.
Table 7-1-2 Achievement Status of Environmental Quality Standards concerning Sulfur Dioxide (long-term evaluation)
Notes: 1. Data by the Environment Agency.
2. Excluding those monitoring stations which have not completed the valid monitoring hours.
3. Excluding those roadside air pollution monitoring stations of which the sample intake is located on a road.
As for road-side monitoring stations, the ratio of the number of stations of which the daily mean of all valid measurement days was 0.04 ppm or less, against the number of all valid stations was 100% in 1993, while it was 98.7% in 1992. The ratio of the number of stations that recorded 0.1 ppm or less in one hour at any measuring timeagainst the number of all valid stations was 97.6% in 1993, an increase as compared to 94.9% in 1992. Changes in ratios remain at high levels.
4. Carbon Monoxide
(1) Roadside air pollution monitoring stations
Since carbon monoxide is generated mainly from automobiles, it is important to measure the changes in its levels at streets with heavy traffic, intersection areas, and so on to grasp the state of its pollution. In the fiscal year 1993, data of carbon monoxide levels were obtained at 334 valid stations in 199 municipalities.
1) Changes in annual averages
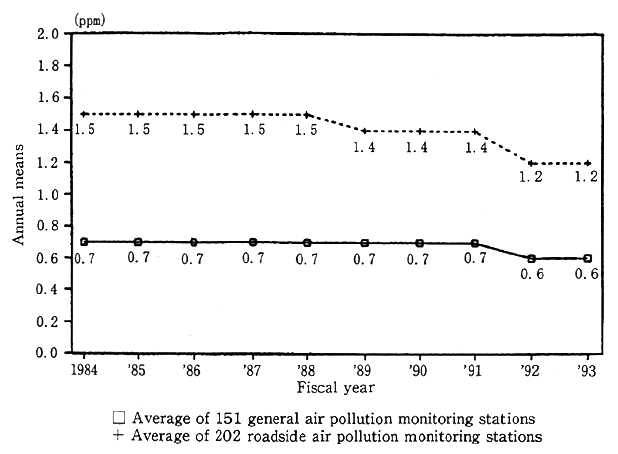
The changes in annual means measured at 202 monitoring sta-tions which have been taking measurements for the past ten years have practically leveled off. The annual mean value of 1993 was 1.2 ppm (Figure 7-1-6). Long-term changes are explained in Part 1, Chapter 5, Section 1.
Fig. 7-1-6 Changes in Annual Means of Carbon Monoxide
Note: These are the changes of yearly means of carbon monoxide levels measured at the stations which had continuous measure-ments since 1971.
2) Achievement status of the environmental quality standard
To meet the standard of a long-term evaluation, the daily average derived from the measured values excluding those within the higher 2% range should be 10 ppm or less, and also there should not be occasions where the daily mean exceeds 10 ppm for two consecutive days in a period of one year.
To attain the standard of a short-term evaluation, the daily mean of hourly values should be 10 ppm or less, and also the mean of hourly values over an eight-hour period should be 20 ppm or less.
All 328 valid roadside monitoring stations (excluding those of which test sample intakes are located on roads) attained the environ-mental standards according to both long and short-term evaluations.
(2) General air pollution monitoring stations
In the fiscal year 1993, data of carbon monoxide levels were obtained at 187 valid monitoring stations in 154 municipalities. All valid monitoring stations meet the environmental quality standard for long-term and short-term evaluations.
Figure 7-1-6 shows the changes in annual means measured at 151 stations that have been taking measurements for the past ten years. Long-term changes in levels are explained in Part 1, Chapter 5, Section 1.
5. Photochemical Oxidants
(1) Measurement results of photochemical oxidants in the fiscal year 1993
Measurement data of photochemical oxidants in the fiscal year 1993 were obtained at 1,110 general air pollution monitoring stations in 617 municipalities, and 39 roadside monitoring stations in 25 municipal-ities.
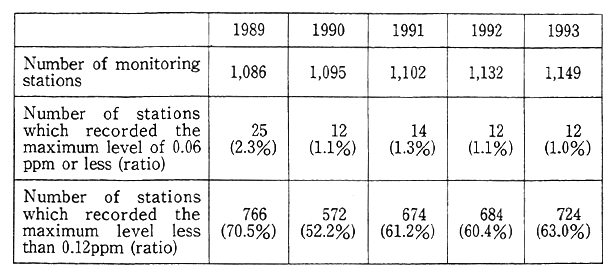
Levels of photochemical oxidants measured continuously remain unfavorable. Table 7-1-3 shows the combined numbers of general and road-side stations at which the highest level in one hour during a day (5 a.m. to 8 p.m.) was 0.06 ppm or less (the level specified by the environmental quality standard), or less than 0.12 ppm (the level that needs awarning issued).
Table 7-1-3 Changes in Number of Monitoring Stations by Level of Photochentical Oxidants (total of general and roadside air pollution monitoring stations)
Source: Environment Agency
(2) Issuance of photochemical oxidants warnings in 1994
1) Issuance of warnings
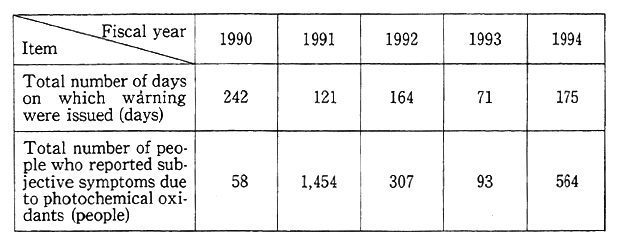
Photochemical oxidants warning (this warning is issued when the hourly value of photochemical oxidants concentration is 0.12 ppm or higher and that the pollution is considered to continue further in view of the meteorological conditions at that time) were issued on a total of 175 days in 19 prefectures in 1994. As compared to 71 days in 15 prefectures in 1993, this is an increase of 104 days, and is the second highest frequency of issuance in the past ten years, next to 242 days in 22 prefectures in 1990 (Table 7-1-4).
Breakdown of the frequency of issuance by month is: two days in April, eight days in May, 37 days in June, 60 days in July, 56 days in August, and 12 days in September.
In 1994, the highest concentration of photochemical oxidants on a day when a warning was issued was 0.223 ppm. There was no issuance of photochemical oxidant alarm (this alarm is generally to be issued when the hourly value of photochemical oxidants concentration is 0.24 ppm or higher and that the pollution is considered to continue further in view of the meteorological, conditions at that time).
Table 7-1-4 Changes in the Total Number of Days on which Photo-chemical Oxidants Warnings were issued, and the Total Number of People who reported Subjective Symptoms due to Photochemical Oxidants (1990-1994)
Note: Data by Environment Agency
2) Breakdown of warning issuance by area
In 1994, photochemical oxidant warnings were issued in the Tokyo Bay area (Ibaraki Prefecture, Tochigi Prefecture, Gunma Pre-fecture, Saitama Prefecture, Chiba Prefecture, Tokyo Metropolis, and Kanagawa Prefecture) on a total of 102 days, and in the Osaka Bay area (Kyoto Prefecture, Osaka Prefecture, Nara Prefecture, and Hyogo Prefecture) on a total of 29 days. The total days of warnings issued in these two areas account for approximately 75% of the total days of warnings nationwide.
3) Number of people who reported subjective symptoms
In 1994, 564 people reported subjective symptoms which may have been caused by photochemical air pollution. This is a drastic increase as compared to 93 cases in 1993.
6. Non-methane Hydrocarbons
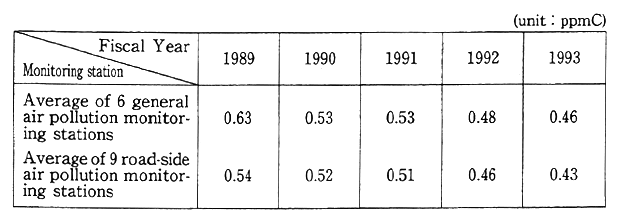
In August 1976, the Central Pollution Countermeasures Council submitted "the Guideline for Hydrocarbons Levels in Atmosphere for Prevention of Photochemical Oxidant Formation." The guideline spec-ifies that non-methane hydrocarbons should be used for measurements of hydrocarbons. The guideline also indicates that the mean level of a three-hour period (6:00 to 9:00 a.m.) of non-methane hydrocarbons that corresponds to the hourly value of 0.06 ppm of photochemical oxidants is between 0.20 ppmC and 0.31 ppmC (ppmC is a ppm value which is based on the number of carbon atoms).
(1) General air pollution monitoring stations
In the fiscal year 1993, measurement data of non-methane hydro-carbons were obtained at 354 stations in 248 municipalities. Table 7-1-5 shows the changes in yearly means from values measured between 6 and 9a.m. at six stations that have been taking measurements since 1978.
(2) Roadside air pollution monitoring stations
In the fiscal year 1993, measurement data were obtained at 171 stations in 109 municipalities.
Table 7-1-5 shows the changes in annual means from values measured between 6 and 9a.m. at nine stations that have been taking measurements since 1977.
Table 7-1-5 Changes in Simple Averages of Annual Means of Non-methane Hydrocarbon Levels between 6 a.m. and 9 a.m. measured at monitoring stations which have been taking measurement since 1978
Note: Data by Environment Agency
7. Dust Fall
Dust fall is caused by particulate matter in the atmosphere which has fallen by means of gravity or rain.
In the fiscal year 1993, measurements of dust fall were taken at 1,201 points where measurements were made for a valid number of hours. There was one measurement point of recorded levels between 20t/km2/month and 30t/km2/month while there were four measure-ment points in 1992. Two measurement points of recorded levels exceed-ing 30t/km2/month in 1993, as opposed to 14 measurement points in 1992.
8. Other Substances
Recently, particulate matter has been a focus of study not only on its amount, but also on its composition. The National Air Pollution Monitoring Stations located in major areas throughout the country are conducting measurements and analysis of those constantly monitored substances mentioned earlier in this section, as well as many other substances. Those include substances that consist of suspended dust (benzene soluble matter, sulfuric radical, nitric radical, vanadium and other heavy metals, benzo(a)pyrene) which is taken by a high-volume sampler, and also the composition of suspended particulate matter (aluminum, barium and other 31 element) which is taken by a low-volume sampler. Measurement and analysis of mercury has also begun since 1982.
In the fiscal year 1985, the Survey of Monitoring Unregulated Air Pollutants was initiated to study on substances that need to be monitor-ed on a long-term basis. In the fiscal year 1993, investigations on asbestos, mercury, organic chlorine solvents (trichloroethylene, tetrach-loroethylene, carbon tetrachloride, etc.) were conducted.
The result of the investigation conducted in the fiscal year 1993 shows that levels of asbestos and mercury were slightly lower than levels measured in the previous investigation. Levels of organic chlorine solvents were reasonably low in residential, commercial, and back-ground areas, but some high levels were measured around lot boundary lines, which is where trichloroethylene and tetrachioroethylene origi-nate from, and surrounding areas. Continuous monitoring needs to be carried out for these substances and sources of trichloroethylene and tetrachloroethylene need to be investigated (Table 7-1-6).
9. Measurement Results at National Air Pollution Monitor-ing Stations
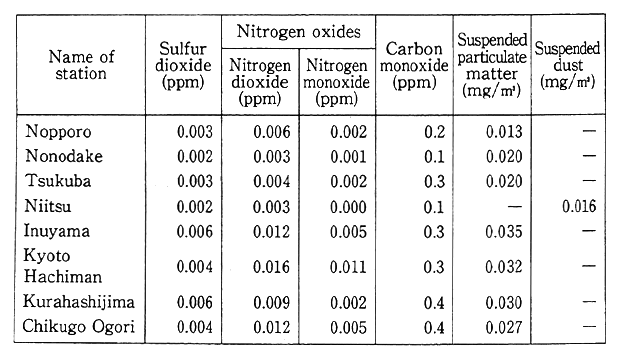
National Air Pollution Monitoring Stations are located at the end of major plains throughout the country to continuously monitor sub-stances contributing to air pollution such as nitrogen oxides and sulfur oxides. Measurements taken at these stations are used to know the levels for areas with no air pollution (background levels)(Table 7-1-7).
Table 7-1-6 Result of Monitoring of Non-regulated Air Pollutants Conducted in 1993
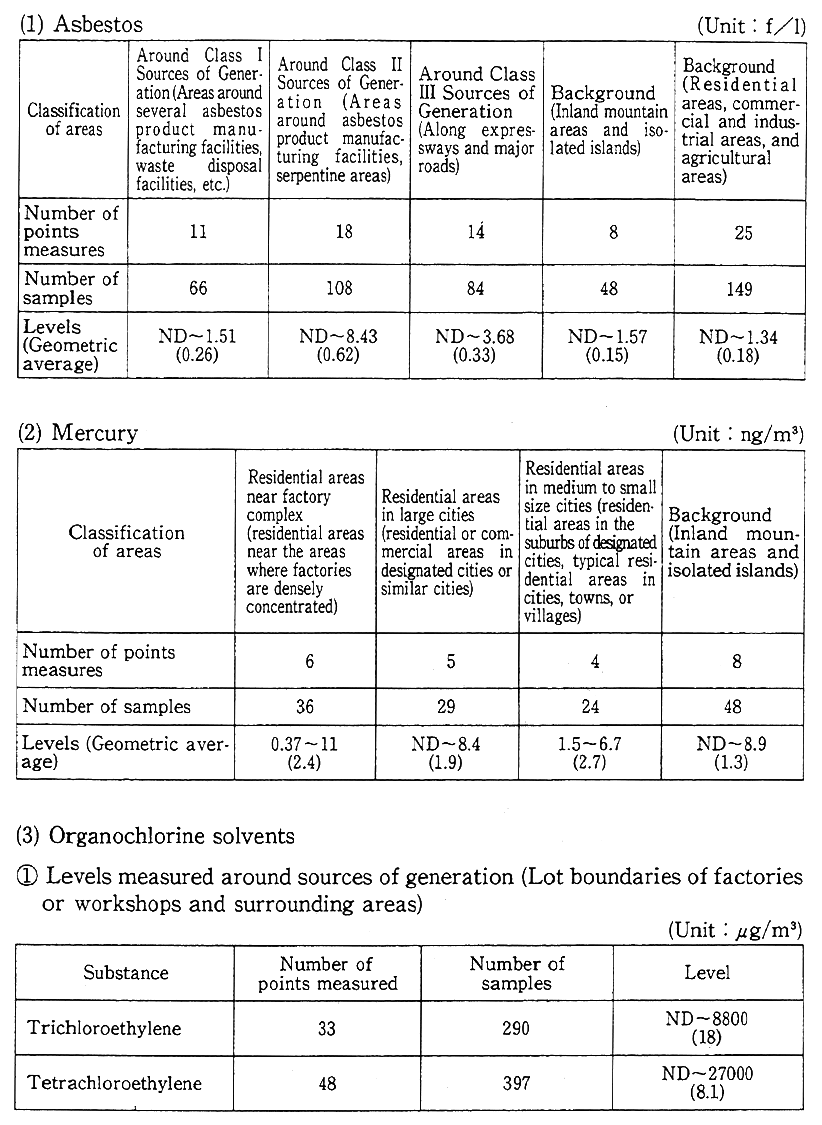
(Table 7-1-6 continued)
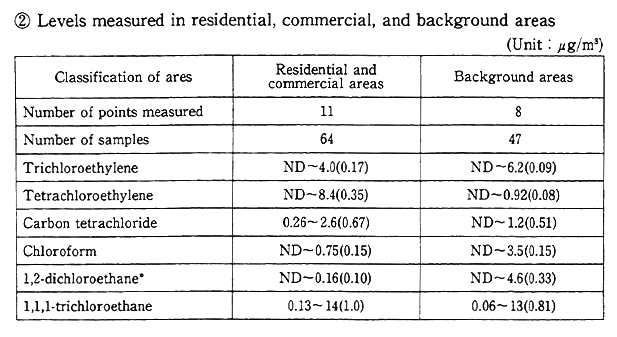
* : As for 1,2-dichloroethane, number of points measured in residential and commer-cial areas were 7, number of samples was 40.
Notes:1. Data by Environment Agercy
2. One microgram (fハg) is one millionth of lg. One nanogram (ng) is one 1000-billionth of lg.
3. "ND" means not detected.
4. Figures in parenthesis are geometric averages (for items that were not detected, half value of the detection limit was used for calculation).
Table 7-1-7 Averages of Measurements taken at National Environ-mental Atmospheric Pollution Monitoring Stations in 1993 (annual means)
Notes:1. Data by Environment Agency
2. See Figure 7-3-1 for locations of monitoring stations.
Section2. Various Measures for Air Pollution
1. Measures for Nitrogen Oxides
(1) Measures for stationary sources of generation
1) Enforcement of national uniform emission control
In August 1973, the first nationally uniform control program to regulate emission levels of nitrogen oxides, specifically its fixed sources of generation, was enforced. Ever since, emission standards of the program have been tightened four times. The program has been revised as necessary by continuously adding names of facilities emitting nitro-gen oxides of unacceptable levels per the Air Pollution Control Law, to its list of facilities to which regulations should be applied.
2) Enforcement of total mass emission control
In areas where numerous factories and workshops are concen-trated in one location, satisfying the environmental standard set for nitrogen dioxide is considered difficult, if an emission control is to be applied to each soot and smoke emitting facility. These areas include specified districts in the Tokyo Metropolis, the Yokohama City area, and the Osaka City area. For these areas, total mass emission control on nitrogen oxides, which apply to each factory according to the total mass reduction plan formed by the governor of the prefectures or metropolis, has been in effect since 1982.
3) Progress on development of technologies to reduce emission amount of nitrogen oxides
Technologies to reduce levels of nitrogen oxides emitted from stationary sources include low-level NOx combustion technology, smoke denitrification technology, etc.
The low-level NOx combustion technology is classified according to the method, such as two-phase combustion method, Exhaust Gas Recirculation (EGR), low-level NOx burner method, and so on. With adoption of these technologies, boilers that can significantly reduce the amount of emitted nitrogen oxides have become more common.
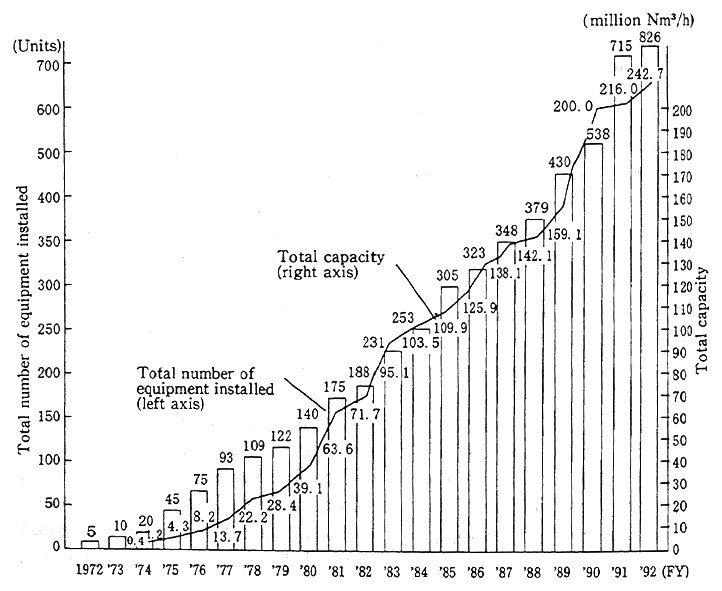
As for smoke denitrification technology, the number of smoke denitrification equipment installed and their total capability have been increasing steadily as shown in Figure 7-2-1. Most equipment use a dry-type selective contact and catalyst reduction method.
Fig. 7-2-1 Progress of Installation of Smoke Denitrification Equipment by Fiscal Year
Notes:1. Data by the Environment Agency
2. Figures are as of 1 January of each year up to the fiscal year 1982, and as of 31 March of each year after the fiscal year 1983.
In large cities, the amount of nitrogen oxides emitted from combustion equipment that are too small to be applicable to the cate-gory "soot and smoke emitting facilities" in the Air Pollution Control Law, is substantial. To cope with this, measures have been considered to make NOx levels emitted from those small-scale combus-tion equipment low, and to promote the use of small-scale equipment that generate low-level NOx.
(2) Measures against automobile emission
Although restrictions on nitrogen oxide emission from each automobile have been gradually strengthened (whenever necessary), further reduction of emission levels has been required in areas with heavy traffic. It is necessary to promote not only measures for each automobile, but also comprehensive measures such as making a physical distribution system more efficient and the increased use of low-emission vehicles (See Section 4 for details.).
In addition to the above measures, various projects to improve local air quality have been promoted in order to prevent any health damage caused by air pollutants such as nitrogen oxides. These projects include : activities conducted by local governments, etc. to promote the increased use of low-emission vehicles, such as electric vehicles, natural gas vehicles, etc. ; promotion to switch to lower emission vehicles which satisfy the latest emission standards; promotion of activities to plant trees that are capable of purifying air, etc. These projects are supported by the fund established within the Pollution-Related Health Damage Compensation and Prevention Association, in accordance with the revision of the Pollution-Related Health Damage Compensation Law as explained in Chapter 10.
(3) Promoting measures against nitrogen oxides in major cities
Despite the implementation of the various measures mentioned above, the level of air pollution caused by nitrogen oxides in major cities remained significant. So, the Environment Agency established the "Medium-Term Prospect of Measures Against Nitrogen Oxides in Major Cities" in December, 1985. The agency then established the "New Medium-Term Prospect of Measures Against Nitrogen Oxides in Major Cities" (called "New Medium-Term Prospect" hereafter) in December, 1988, and has been promoting systematic and comprehensive measures based on the future prospect. The New Medium-Term Prospect for-ecasted on pollution levels of the fiscal year 1993, and indicated the directions in which the measures should be taken according to the forecast. Based on the forecast, various measures have been promoted to achieve the environmental quality standard as soon as possible. These measures are focusing on three aspects: emission controls against each automobile ; controls of overall automotive traffic ; and emission controls of stationary sources.
The yearly average of nitrogen dioxide levels measured in fiscal year 1993 in the three areas subject to area-wide total pollutant volume control on nitrogen oxides was almost the same as the previous year. The achievement rate for required environmental quality standard was 60.2% of general air pollution monitoring stations, and only 11.0% of road-side air pollution monitoring stations. According to the estimated amount of nitrogen oxides emitted in these areas in 1985, classified by source of generation, percentages of the amount emitted from automo-biles were 67% in Tokyo's 23 wards and other areas, 32% in the Yokohama area, and 47% in the Osaka area. This indicates that the contribution of the emission from automobiles to the total amount of nitrogen oxides emitted is significant.
In an attempt to improve the level of air pollution caused by nitrogen oxides in major cities, further efforts have been made to reduce the total amount of nitrogen oxides emitted from automobiles in a specific area, in accordance with the Law Concerning Special Measures for Total Emission Reduction of Nitrogen Oxides from Automobiles in Specified Areas, which was promulgated in 1992 (See Section 4 for detail.).
Various active measures are being taken by giving preferential treatment in taxation measures, utilizing the fund supported by the Pollution-Related Health Damage Compensation Law, etc. to promote activities such as: strengthening of emission control of each automo-bile; promoting the switch to vehicles satisfying the latest emission standards; and introducing and promotion low-emission vehicles such as electric cars, natural gas vehicles, etc.
In addition to these measures, some other measures are being taken since the fiscal year 1988, in order to cope with the intensified level of air pollution in winter. One of these measures is the enforcement of the "Provisional Measures Against Seasonal Air Pollution" which includes promotion of reasonable temperature settings for heating devices, restrictions of number of trucks used for shipping, etc. Other measures include the designation of every December as the "Air Pollu-tion Prevention Promotion Month" during which people are encouraged to use public transportation, etc.
2. Measures for Suspended Particulate Matter
Particulate matter within air is classified largely into "falling dust and "suspended dust." The suspended dust is further classified into suspended particulate matter of which the grain diameter is ten microm-eters or less per the environment standard, and others. Although most of the particulate matter is generated from industrial facilities such as factories or workshops, some of them are generated by the motion of automobiles or by natural conditions such as soil particles stirred up by wind. The Air Pollution Control Law classifies dust generated in the course of industrial activities in a factory or workshop, according to the process the dust was generated. The law indicates that: 1) substances that are generated by combustion of fuel or other matter, or are generated by the use of electricity as a heat source, are to be specified as "soot and dust" ; and 2) substances that are generated in the course of crushing, selection, accumulation, or other mechanical processing of objects, are to be specified as "fragmentary dust." The law also indi-cates that substances that are generated in the course of automotive motion are to be specified as "particulate matter."
(1) Measures for suspended particulate matter
The environmental standard for suspended particulate matter was established in January, 1972. The achievement ratios in the fiscal year 1993 were 58.3% at general air pollution monitoring stations and 40.5% at roadside monitoring stations; both have remained at low levels. Besides those unnatural and natural sources of generation such as industrial facilities, automobiles, or soil, suspended particulate matter can also be generated in the atmosphere as secondary particles, particles that grow from gaseous matter such as sulfur oxides, by receiving physical and chemical changes in the atmosphere. Because of their complicated generation mechanism, effective and conclusive measures to control them have not yet been determined.
Various investigations on the sources of generation of suspended particulate matter and field surveys have been conducted in order to clarify their polluting mechanism, and to develop methods of estimating pollution levels and methods to effectively reduce them. Comprehensive measures are being studied with consideration to the results of those investigations.
Concerning the particulate matter contained in exhaust emissions from motor vehicles, several control actions have been taken in accor-dance with the short-term targets proposed in the recommendation from the Central Council for Environmental Pollution Control in December, 1989. Restrictions against black smoke emitted from diesel-powered vehicles have been tightened and new restrictions against the particu-late matter have been in effect since 1993 and 1994. Long-term targets set for those diesel-powered vehicles are evaluated to be achieved by 1997 or 1998, except for diesel-powered heavy-duty trucks and buses. Technical evaluations for heavy-duty vehicles have been carried out so that the goals can be achieved as soon as possible (Table 7-2-1).
(2) Measures for controlling soot and general fragmentary dust
Emission standards for soot and dust are established by type of facility and its scale. For those areas where facilities are densely concentrated and the pollution level is high, more strict special emission standards are enforced for new and additional construction.
Measures for controlling soot and dust include promotion of appropriate combustion methods and installation of dust collectors (Figure 7-2-2).
As for "general fragmentary dust" (i. e., fragmentary dust which is not classified as "specified fragmentary dust". For details of "speci-fied fragmentary dust," as which currently asbestos is classified, see 6(1) Measures for asbestos.), standards are established concerning the struc-ture, usage, and management of facilities that generate general frag-mentary dust, such as accumulation grounds, conveyers, etc.
3. Measures for Sulfur Oxides
(1) Emission controls
There are two types of restrictions being enforced for the emis-sion of sulfur oxides: restrictions by way of emission levels set for each facility ; and restrictions on total amount emitted from each factory, which are applicable in heavily polluted areas. Restrictions by way of emission levels set for each facility are called K-value restrictions since the allowable emission level of sulfur oxides is decided by a constant K, which is determined for each area, and height of emission outlet. Constant K has 16 rankings within the range of 3.0 -17.5, the smaller the value is, the more strict the restriction is. The K-values have been tightened in phases eight times since December 1968. Total emission control applied to each factory is enforced in areas designated by the Government (areas where factories are densely concentrated, and that the environment standard cannot be met only by enforcement of emis-sion standards), in accordance with the Total Emission Reduction Plan formed by the governor of a prefecture or metropolis. Currently, it is enforced in 24 areas. Standards for fuel usage concerning sulfur content in petroleum fuel, are set for certain facilities. These facilities include facilities emitting soot and smoke that are located in areas where air pollution becomes severe seasonally due to the increase in amount of fuel used for heating, etc. ; and small-scale factories or workshops that are located within the areas where total emission control is enforced, but not applicable to the restriction.
Table 7-2-1 Summary of Target Values for Exhaust Emission Control Shown by the 1989 Report of the Central Council for Environmental Pollution Control
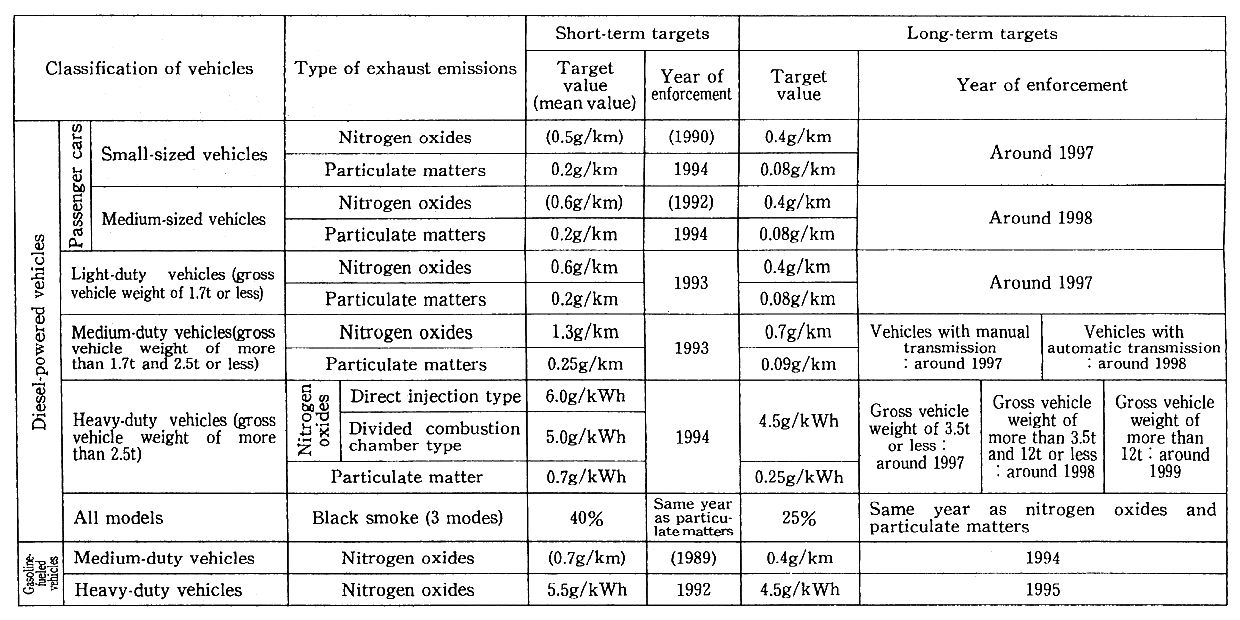
Notes: 1. Figures in parenthesis are according to the latest levels since these items were not included in the 1989 report.
2. "Small-sized" passenger cars means vehicles of which the equivalent inertia weight is 1.25t (vehicle weight of 1.265t) or less, "medium-sized" passenger cars means vehicles of which the equivalent inertia weight is more than 1.25t (vehicle weight of 1.265t).
Fig. 7-2-2 Progress of Installation of Dust Collectors by Fiscal Year
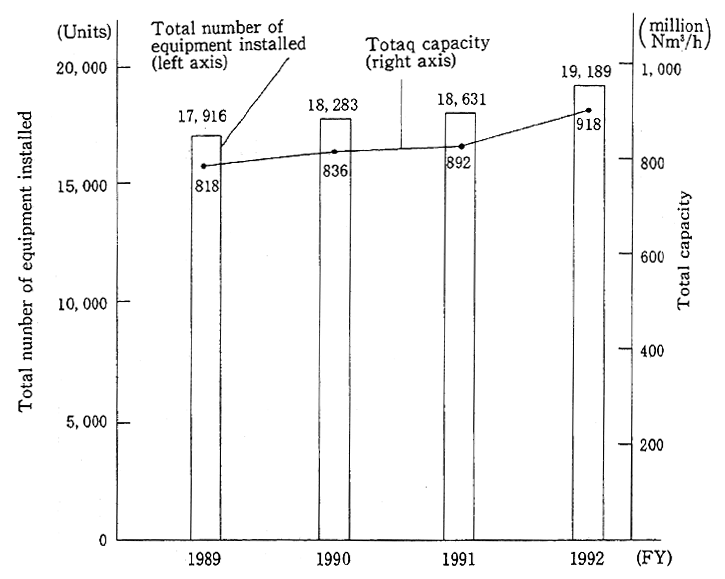
Note: Data by the Environment Agency
(2) Status of measures for sources of generation
To control the emission of sulfur oxides at the sources of genera-tion, measures such as desulfurization of fuel oil, installation of desulfur-izers for exhaust gas, etc. have been taken.
As for desulfurization of fuel oil, both direct and indirect desulfur-izers have been installed since 1967. As of the end of 1993, the amount of oil processed was 73,000kl/day by 13 units of direct desulfurizers, and 1,330,000kl/day by 27 units of indirect desulfurizers. By the desulfuriza-tion of fuel oil, average sulfur content in fuel oil used domestically has been reduced by 1.05% in the fiscal year 1993.
As to desulfurizers of exhaust gas, the number of units installed and the amount processed have been steadily increasing (Figure 7-2-3).
Fig. 7-2-3 Progress of Installation of Stack Smoke Desulfurizers
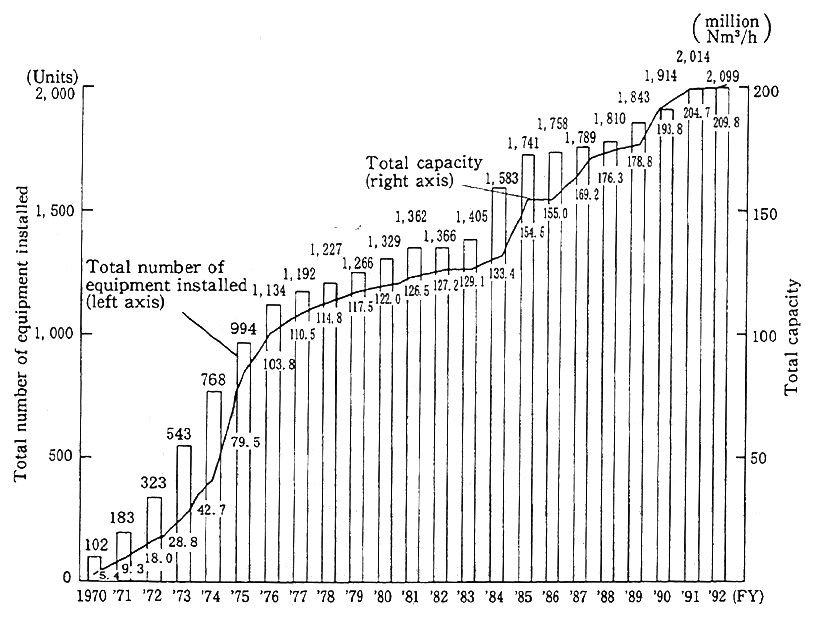
Notes:1. Data by the Environment Agency
2. Figures are as of 1 January of each year up to the fiscal year 1982, and as of 31 March of each year after the fiscal year 1983.
Owing to the enforcement of these measures, air pollution levels caused by sulfur dioxide have been significantly improved as compared to the latter half of the 1960s.
4. Measures for Air Pollution by Photochemical Oxidants
The concentrations of photochemical oxidants are still higher than that of the environmental quality standard in most areas nation-wide, sometimes necessitating the issuance of photochemical oxidant warnings under certain weather conditions. Therefore, changes in pollu-tion levels should be accurately monitored and appropriate measures should be taken to improve them.
(1) Emergency measures against photochemical air pollution
In order to obtain the meteorological data necessary to judge whether to issue warnings or not, the Environment Agency makes meteorological observations at four points within the Tokyo Bay and Osaka Bay areas, in which levels of photochemical oxidants frequently become high during summer. The agency provides the meteorological information to the related local governments. At 19 meteorological observation stations throughout the country, the Meteorological Agency analyzes and forecasts the weather conditions in which photochemical pollution is likely to occur and reports the information to local govern-ments. And in case of necessity, the agency also announces meteorologi-cal information related to photochemical air pollution to the public. Based on this meteorological information and data from monitoring stations, local governments issue warnings or alarms according to the Procedure on Emergency Measures Against Photochemical Oxidants. At the same time, local governments request persons responsible for the emission of soot and smoke to reduce the emission of air pollutant, and request drivers to refrain from nonessential use of vehicles, carry out public information activities, and provide public health measures.
(2) Measures for emission control of hydrocarbons
1) Measures for emission control of hydrocarbons from stationary sources of generation
In July 1982, the Environment Agency decided on a policy called "Promotion of Measures Against Hydrocarbons for the Prevention of Photochemical Air Pollution." This policy was decided on in considera-tion with the study results from the Committee on Control Measures of Emission of Hydrocarbon from Stationary Sources, such as actual conditions of emission, evaluations of emission control technologies, etc. This action was taken in order to tighten and promote the measures for the emission control of hydrocarbons generated from stationary sources. Based on this policy, the agency is making necessary requests for local public entities and other concerned parties to promote mea-sures for emission control of hydrocarbons.
2) Measures for the reduction of hydrocarbons emitted from motor vehicles
Emission control of hydrocarbons emitted from motor vehicles has been enforced since 1970. The amount of hydrocarbons emitted from a gasoline or LPG fueled passenger car has been reduced by 92% as compared to the level before the control was enforced.
(3) Promotion of studies on photochemical air pollution
Since photochemical air pollution is an extremely complex phe-nomenon which affects wide area, extensive studies have been carried out. The areas of studies include: mechanisms for photochemical reac-tions; meteorological effects produced by drift diffusion, etc. ; actual emission of pollutant ; establishment of forecast models of photochemi-cal air pollution in which results of other studies are incorporated; impact of photochemical oxidants on plants ; and so on.
5. Measures for Dust Pollution Caused by Studded Tires
Recently, automobiles with studded tires used in areas with severe winters with heavy snow have been damaging roads causing a large amount of dust (referred to as "dust caused by studded tires" hereafter). The dust not only worsens the living environment, but also has a bad influence on human health. Since it has become a serious social problem, the Studded Tires Regulation Law was promulgated and enforced in June 1990. The law specifies that it is the people's responsi-bility to strive to prevent the dust caused by studded tires, and that the use of studded tires be restricted in areas specified by the Director General of the Environment Agency. As of April 1995, 803 municipalities in 18 prefectures have been designated as restricted areas.
This law indicates that the national and local governments must strive to promote and enforce measures to prevent the generation of dust caused by studded tires. The Environment Agency produced and distributed various kinds of literature such as pamphlets for discourag-ing of the use of studded tires, handbills containing information on safe driving techniques for icy roads, and maps of areas where the use of studded tires is restricted.