

Quality of the Environment in Japan 1995
(6) Other atmospheric pollutants
Concerning substances that are regulated as hazardous sub- stances by the Air Pollution Control Law, such as cadmium and chlo- rine, with respect to factories and businesses that are sources, emission standards are stipulated for each type of facility that generates soot and smoke and emission regulation is implemented. Further, besides this, concerning air pollutants that are necessary to grasp long-term change, from 1985 an monitoring survey of uncontrolled air pollutants has been implemented. In 1993, the same as in 1991, investigation has been carried out concerning asbestos, mercury and organochiorine solvents (trichlor- oethylene, tetorachioroethylene, carbon tetrachIoride).
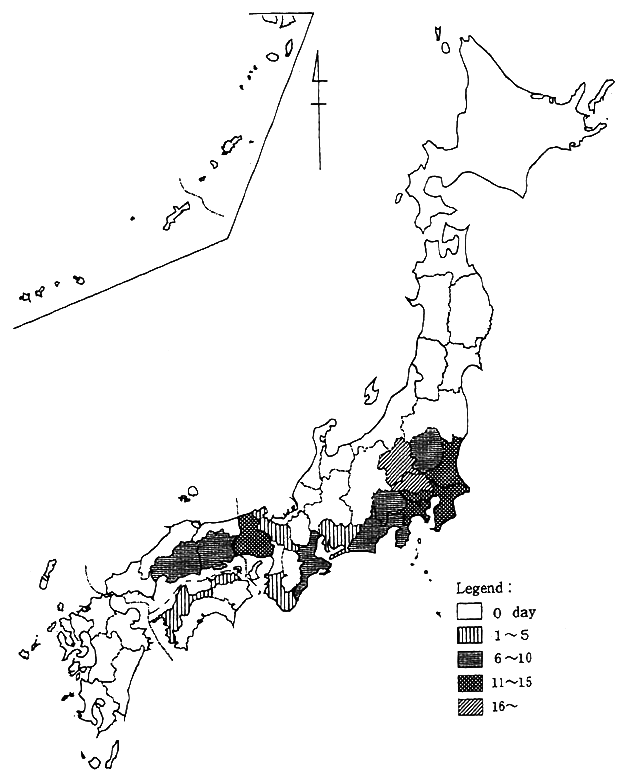
Fig. 5-1-7 Total Number of Days that a Photochemical Oxdant Pollution Warning was issued by Prefectures in 1994
In the 1993 survey the results for asbestos and mercury were, generally, low values when compared to the previous survey. Concern- ing organochiorine solvents, in residential, business and background areas there were, generally, low values, but on the boundaries of the sites of the sources of tetrachloroethylene and trichloroethylene, as well as in their vicinities, cases of high concentrations were seen. In addition to continuing the monitoring from now on, concerning trichloroethylene and tetrachloroethylene, it is necessary to make an effort to grasp the actual condition of the sources.
There are various types of chemical substances and uses for them. At present there are several tens of thousands of substances even only made for industrial use. The Environment Agency has effectively and systematically investigated the residue situation of existing chemi- cal substances by the second comprehensive survey that newly started in 1988 with the purpose of discovering at an early stage the chemical substances remaining in the general environment and grasping their concentration level. In the 1993 investigation of the 20 substances that were the subject of the investigation six were detected, but the detected concentration levels were low and they cannot be regarded as suggest- ing an immediate problem.
Concerning hazardous air pollutants, such as organochlorine solvents, and concerning tetrachloroethylene used as a raw material for CFCs, metal cleansing agent and dry cleaning solvents, as well as trichloroethylene used as solvents and metal cleansing agent that have attracted attention because of anxiety about their affect on health, besides being detected over a wide area in the air of Japan, a survey by the Environment Agency has ascertained that there are examples of the detection of comparatively high concentrations of some of them in places in the vicinity of their sources. The Environment Agency, con- cerning trichloroethylene and tetrachloroethylene, in April 1995 stipulated the "Air Quality Guidelines (annual average value of trichloroethylene 250 fÊg/m3or less, tetrachloroethylene 230fÊg/m3 or less, provisional values)" as guidelines that are desirable to be maintained for the protection of people's health. Further, provisional countermeasure guidelines related to the emission into the air of the two substances were settled and the governors of prefectures and the mayors of the administrative ordinance-designated cities were requested to grasp the actual situation, measure concentrations and restrict emission.
In various foreign countries, besides the revision in November 1990 of the Clean Air Act by the United States that was designed to strengthen regulations, such as the large increase in the existing hazardous air pollutants from nine substances to 189 substances, in various international organizations, also, measures to evaluate the risk of chemical substances and to reduce the risks are beginning to be carried out. The OECD is promoting an international project being implemented by allotting to each country the investigation of the safety of existing chemical substances about which there is little safety data. At present 648 substances have been made subjects of the study. Further, the UNEP, also, in addition to internationally collecting and accumulating existing information related to the effects of chemical substances on the environment as well as people, has established the International Register of Potentially Toxic Chemicals and is providing various information related to the regulation of chemical substances in various countries.
In the Environment Agency systematic measures are being promoted to perfect knowledge related to sources and influences on health related to substances that should be dealt with first among the various hazardous pollutants of the air environment that have the potential to influence people's health through the air environment.
2. Global Atmospheric Environmental Conditions
Air pollution is not merely a regional problem. Its damage and influence cross the borders of countries and bring with them the problems of acid deposition, ozone layer depletion and global warming that are spreading on a global scale.
As for the global warming problem, numerous research surveys have pointed out the increase in the concentration of carbon dioxide in the air that accompanies the increase in the consumption of fossil fuel by people, the greenhouse effect of carbon dioxide and the necessity of countermeasures have come to be recognized. Inside and outside of Japan steps are being taken towards global warming countermeasures. In Japan in October 1990 the action program to arrest global warming was decided on. Internationally, by February 1995 over 120 countries had ratified the U. N. Framework Convention on Climate Change.
The ozone layer depletion problem has attracted the world's attention since a theoretical paper concerning ozone layer depletion due to chlorofluorocarbon was published by a U. S. scholar in 1974. Further, the fact that the possibility was great that the process of this depletion was occurring in the present atmosphere was also pointed out by actual observation. In 1985 the Vienna Convention for the Protection of the Ozone Layer and in 1987 the Montreal Protocol on Substances that Deplete the Ozone Layer were adopted and international measures with respect to the ozone layer began. In Japan also various countermeasures have been devised, such as the enactment of the Law Concerning the Protection of the Ozone Layer through the Control of Specified Substances and Other Measures.
Concerning acid deposition, the term was first used in the last half of the 19th century by a British scholar, countermeasures are progressing in North America and Europe. Particularly, in Europe in November 1979 the ECE Convention on Long-range Transboundary Air Pollution was concluded and steps towards measures to prevent acid deposition have been carried out. In Japan, in order to grasp the actual situation and influence, in addition to carrying out an acid deposition countermeasure survey since 1983, steps have been taken to construct a monitoring network with neighboring countries and to develop a model to predict the effects.
(1) Carbon dioxide and other greenhouse gases
Beginning with carbon dioxide (CO2), greenhouse gases, such as methane (CH4), nitrous oxide (N2O), CFCs, ozone (O3) and water vapor (H2O) absorb the infrared rays that are radiated from the surface of the earth that has been warmed by the rays of the sun, and by means of radiating heat back to the earth, prevent heat from escaping into space, maintaining the temperature of the air and ground surface in a condition that is suitable for the existence of life. The global warming problem is the problem that the concentrations of these greenhouse gases are increasing due to the various activities of people and the eruptions of volcanoes, and that this produces such consequences as an increase in the average temperature on the earth, a rise in the level of the ocean surface and changes in the pattern of rainfall as well as changes in the ecological system.
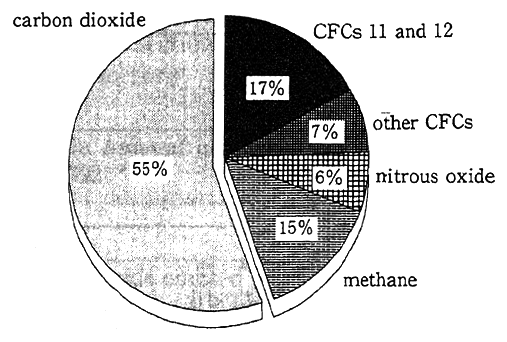
The greenhouse effect, per a specific amount of methane, nitrous oxide and CFCs is extremely high when compared to that of carbon dioxide, but since the amount of carbon dioxide discharged is enormous, the degree to which carbon dioxide contributes to global warming is very high. According to a 1980 report of the Intergovernmental Panel on Climate Change (IPCC) in the decade of the 1980s it was about 55% (Figure 5-1-8). For this reason, as a countermeasure against global warming, the reduction of the amount of carbon dioxide emitted has become an important point Throughout the world observation is being carried out of the greenhouse gas carbon dioxide. In Japan, observation of the concentration of carbon dioxide, methane and nitrous oxide is being carried out at Ryori in the town of Sanriku in Iwate Prefecture, Minamitorishima Island in Tokyo and the town of Taketomi on the island of Hateruma in Okinawa Prefecture and other places.
Fig. 5-1-8 Proportions of Greenhouse Gases Derived from Human Activities in the 1980s that contributes to Global Warming
Reference: IPCC report
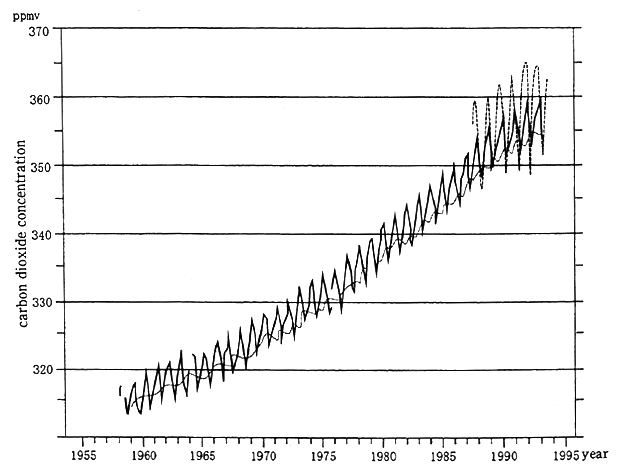
The concentration of carbon dioxide in the air before the Indus- trial Revolution was about 280 ppm, but with the increase in the world's population and the development of industry and agriculture the amount of carbon dioxide emitted has also increased and presently it exceeds 350 ppm. Moreover, it is estimated to be increasing at a rate of 0.5% per year (Figure 5-1-9). Further, according to the observations at Ryori Town in Iwate Prefecture, the average annual concentration in 1994 was 361.6 ppm.
As for methane, there are the natural sources, such as marshlands and lakes and reservoirs, and man-made sources, such as waste landfill sites, paddy fields, domestic animals and leaks of natural gas. Their greenhouse effect can be regarded as being about 24.5 times that of carbon dioxide. The concentration of methane in the air was about the same from 3,000 years ago until 250 years ago, according to analysis of the old atmosphere. It is presumed to have increased over two times during the past 200 years. Further, in the air above Siberia methane has been observed in high concentrations. Siberia's marshland are recog- nized as being a large-scale source of methane on a global level. Further, according to the observations at Ryori Town in Iwate Prefecture, the annual average value in 1994 was 1.85 ppm.
Fig. 5-1-9 Changes in Carbon Dioxide Concentrations at Mt. Mauna Loa (solid line), the South Pole (dotted line) and Ryori(broken line)
Source : Meteorological Agency
For nitrous oxide there are natural sources, such as soil and the ocean, and man-made sources, such as the fertilization of agricultural land and the combustion of biomass, such as firewood and fossil fuels. Its greenhouse effect can be regarded to be about 320 times that of carbon dioxide. It is known that the life span of nitrous oxide in the air is long, about 150 years. There are many unclear points about its movement on a global scale. Further, according to the observations at Ryori Town in Iwate Prefecture, the annual average value in 1994 was 304 ppb (one thousandths of one ppm).
Due to this kind of increase in greenhouse gases, it has been reported that if no countermeasures are taken the annual average temperature of the entire earth in the year 2050, compared to the present, will have risen about one degree, and after the 21st century about three degrees, and that the surface of the ocean in the year 2030, compared to today, will have risen about 20 cm, and by the end of the 21st century, about 65 cm (maximum. one meter).
When the changes in the amounts of emission of carbon dioxide in Japan are looked at, from 1990 to 1992 the total amount of emission and the amount of emission per person were both increasing (Table 5-1-1). (Refer to Chapter 3, Section 3, 1 for the details of the amounts discharged classified by sector.)
Table 5-1-1 Changes in Amount of Carbon Dioxide Emission in Japan in 1990-1992
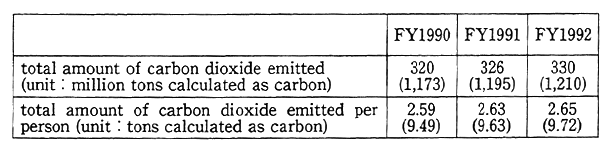
Note : Figure in parentheses is the value converted into carbon dioxide.
Source : Environment Agency
With respect to this kind of global warming problem, in Japan measures are being taken based on the Action Program to Arrest Global Warming, and investigation of policies for the diffusion of generating electricity by sunlight have been carried out. As for the generation of electricity by sunlight, the necessity of bringing about a switch to their mass diffusion, especially for the diffusion of systems for residential use, is shown by means of promoting model businesses, by the pioneering of their introduction by government institutions to create demand during the initial period, by planning a reduction in the cost of the systems by giving various incentives and by deciding on mass diffusion plans.
(2) Stratospheric ozone and CFCs
The depletion of the ozone layer refers to the destruction by CFCs of the ozone layer that is in the lower layer of the stratosphere (altitude 15 km-30 kin) and the harmful impact exerted on the ecological system and people due to the increase in the amount of harmful infrared rays, that are absorbed by the ozone layer, that reach the ground.
Mainly CFCs artificially made as cleaners, refrigerants, foaming agents, etc., since they are odorless and incombustible are extremely stable chemical compounds, they are not broken down in the troposphere and when they reach as far as the stratosphere they are broken down by ultraviolet rays and release chlorine atoms. These chlorine atoms one after the other, like a chain reaction, break down the ozone in stratosphere. Besides CFCs, also Halon, carbon tetrachioride, 1, 1, 1 -trichioroethane, hydrochiorofluorocarbon (HCFC), methyl bromide are known to break down the stratospheric ozone.
At the South Pole since the end of the 1970s each spring (autumn in the northern hemisphere) a phenomenon called the "ozone hole" has been occurring in which the ozone has become noticeably less (Figure 5-1-10). When the amounts of ozone destruction, the lowest total amounts of ozone and the areas of the ozone hole during the seasons each year from 1979 until 1994 are compared, in 1994 the three factors broke their respective records for extreme values and it has been determined that the largest ozone holes have appeared for six years in a row, from 1989 until 1994 (Figure 5-1-11).
Concerning the 1994 ozone layer condition for the entire earth, excepting the South Pole, continuing from the previous year, the total amount of ozone through the year was less than in an average year. Concerning the state of the ozone layer above Japan, the amount of ozone and the altitude dispersion are being observed at Sapporo, Tsukuba, Kagoshima, Naha and Minamitorishima Island by ozone sonde and ozone spectrophotometers. According to the results of these observations, the total amount of ozone at Tsukuba and Naha was almost the same as in an average year throughout the year. At Sapporo the first half of the year was almost the same as a normal year, but the six months from July to December passed with less than a normal year. At Kagoshima, except for December, it was generally more than a normal year (Figure 5-1-12).
Further, concerning the ozone altitude dispersion observations were carried out by means of ozone laser radar at Tsukuba.
It is known that the ozone layer depletion brings about an increase in the amount of ultraviolet rays (UV-B) that reach the ground and the influence on the ecological system of the hydrosphere as well as on vegetation on land and the influence on people's health, such as the suppression. of immunity, white cataracts and skin cancer that are caused by harmful ultraviolet rays. Thus the ozone layer depletion has caused anxiety. For this reason, in Japan since 1990 observation of UV -B that observes the changes in harmful ultraviolet rays has been carried out. In the observations of 1994 noticeably large values were seen in the observation values of UV-B, with respect to an estimated average value. However, according to the analysis based on the results of the observations of UV-B and ozone at Tsukuba in 1990, if conditions other than ozone do not change along with the decrease in ozone, that the amount of UV-B that reaches the ground would increase was
Fig. 5-1-11 Trends in Three Factors of Antarctic Ozone Hole
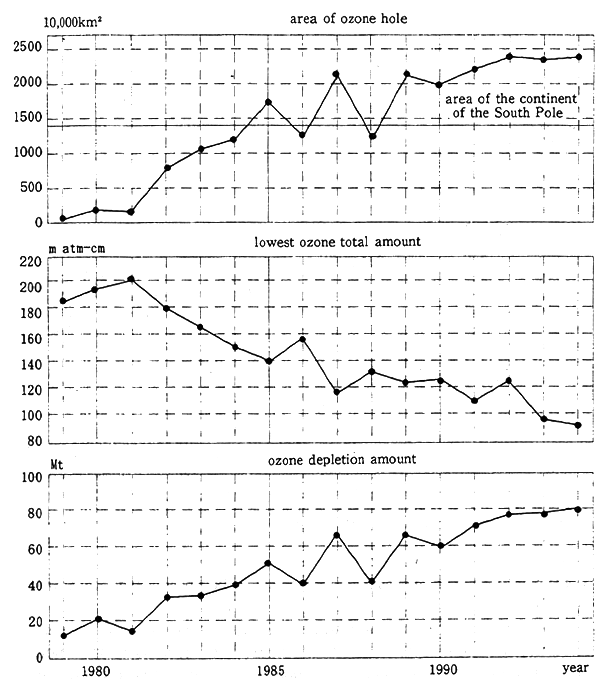
Note :The annual extreme values of three important factors of the ozone hole (in order from the top, area of ozone hole, lowest ozone total amount, ozone depletion amount) of 1979-1994. The three important ozone hole factors are defined at 45 degrees south and southward, the area of the ozone hole is an area of 220m atm-cm or less of the entire amount of ozone, the lowest ozone total amount is the lowest value of the total amount of ozone, the ozone depletion amount is mass of ozone required to supplement the total amount of ozone in order to restore it to 300 m atm-cm.
Prepared by comparative study of the observation data by Dobson spectrophotometer and TOMS data offered by NASA.
Source : Meteorological Agency confirmed and it is necessary to continue to be on watch from now on also.
Fig. 5-1-12 Distribution of Total Ozone over Japan (year-round)
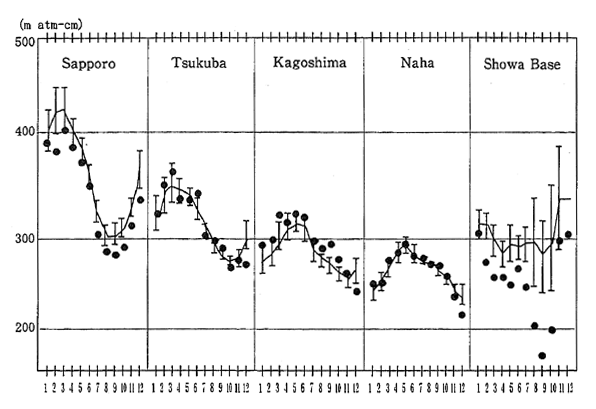
Note : This figure shows the changes in the average monthly ozone amount at the Showa Base in South Pole and in four cities of Japan (Sapporo, Tsukuba, Kagoshitna, Naha). The mark (![]() ) indicates the monthly average values in 1994, the solid line is the average value of successive years classified by month (1961-1990, for Naha 1974-1990), the vertical narrow solid lines are their standard deviations.
) indicates the monthly average values in 1994, the solid line is the average value of successive years classified by month (1961-1990, for Naha 1974-1990), the vertical narrow solid lines are their standard deviations.
Source : Meteorological Agency
Meanwhile, even concerning CFCs that cause ozone layer deple- tion, in Japan observations are being carried out, such as on the middle latitude areas of the northern hemisphere (Hokkaido, Iwate Prefecture, Kawasaki City) and in the South Pole area (Showa Base) and concentra- tions in the air are being watched.
Facing the serious condition of the recent ozone layer depletion, at the fourth meeting of the signatories to the Montreal Protocol in 1992 revision of the Protocol was carried out. In Japan also in coping with this the Law Concerning the Protection of the Ozone Layer Through the Control of Specified Substances and Other Measures was revise in June 1994 for the strengthening of the regulations on industry. Further, at this convention of parties to the Montreal Protocol resolutions were adopted concerning the promotion of the collection, reuse and destruction of used CECs. In Japan in April 1994 the Ozone Layer Protection Counter- measures Promotion Conference was established by the related minis- tries and agencies and study of policies promoting the recovery of CFCs is proceeding.
(3) Acid deposition
Acid deposition is rain with a low pH-value that can be regarded as having taken in the nitric acid and sulfuric acid that air pollutants, such as nitrogen oxides (NOx) and sulfur oxides (SOx) due mainly to the combustion of fossil fuels, have been changed into in the air. But, in a broad sense, it combines both the wet deposition that includes snow and fog besides rain, as well as the dry deposition of deposition in the form of aerosols and gas. What is produced when air pollutants, such as SOx and NOx are removed from the air and move to the water and the soil is the acid deposition problem.
The extensive influence of acid deposition, such as the influence on fish when inland water, such as rivers and lakes, becomes acidic, the influence on forests when the soil becomes acidic, and the fact that acid deposition, directly, by falling on cultural assets, trees and shrubs, promotes their decline and collapse, causes anxiety. In Europe and the United States where acid deposition became a problem early, the acidification of lakes and reservoirs and the decline of forests that can be regarded to being due to acid deposition have been reported on.
The nature of acid deposition is that it can be deposited on areas even far from the sources of SOx and NOx by several thousands of kilometers, which is one of the characteristics of being a widespread phenomenon that crosses the borders of countries. In Europe, in order to prevent the influence of acid deposition, the ECE Convention on Longrange Transboundary Air Pollution was concluded in 1979 and countries, in addition to promoting the reduction of substances that cause acid deposition, such as SOx and NOx, have been making joint efforts to monitor acid deposition and to shed light upon its influence.
Acid deposition, formerly, came to be a problem of advanced countries, but recently, due to the industrialization of developing countries, the amount of emission of air pollutants is increasing and, in addition to regional air pollution, widespread acid deposition also is becoming a problem.
In the Agenda 21 adopted at the Earth Summit, it is stated that not just advanced countries, but developing countries also, from now on should strengthen measures related to the widespread acid deposition environmental problem.
As for Japan's acid deposition countermeasures, in contrast to Europe and the United States, the survey of the actual situation of "wet air pollution" that started from the influence on people's health (irritation of eyes and skin) in the decade beginning in 1975, is the first. This survey considered viewpoints of the influence on the environment that had not been considered and the fact that influence on the environment due to acid deposition had become big problems in the United States and Europe and since 1983 a series of acid deposition countermeasure surveys (hereafter referred to as "surveys") have been implemented from the viewpoint of preventing the influence of and grasping the actual situation of acid deposition.
According to the results of the second survey implemented from 1988 until 1992 in Japan acid deposition the same as that in Europe and the United States was widely observed (Figure 5-1-13), but clear indications of an influence on the ecological system of plants, soil and fresh water due to acid deposition have not been able to be seen. However, if acid deposition continues as it is now, it can be presumed from the examples of Europe and the United States that it is undeniable that there is the danger of an influence on the environment becoming tangible in the future.
For this reason, from now on it is necessary to strengthen the observation of acid deposition, and in addition to further perfecting research on its influence on the ecological systems of forests, soil and inland water, to plan for prevention, such as by devising appropriate countermeasures as required.
Further, since acid deposition is a widespread environmental problem that crosses the borders of countries, measures cooperated on internationally are necessary in the implementation of effective policies.
When the increase in the amount of emission of air pollutants that accompanies economic development in the East Asian area is considered, there is a great danger that in the future acid deposition in this area will become a serious environmental problem and the importance of measures against this problem can be regarded as increasing. For this reason, as the first step towards cooperation in the area, the Second Experts Meeting on Acid Deposition Monitoring Network in East Asia was held in Tokyo in March 1995. In addition to agreeing on the general concept of the East Asian Acid Deposition Monitoring Network as well as deciding on monitoring guidelines that are appropri- ate to the East Asian region, the further promotion of international cooperation concerning this problem was agreed to.
Fig. 5-1-13 State of Acid Deposition (Second Survey of Acid Deposition)
Source : Environment Agency
3. The State of Noise, Vibration and Offensive Odor
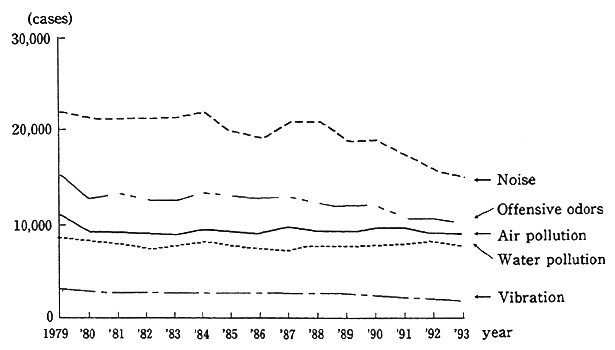
Since noise, vibration and offensive odor are mainly problems related to people's senses, they have become important problems in order to conserve the living environment. The number of complaints for each type of pollution as a whole has been trending down year after year, but they have great relative importance in the number of cases of various pollution complaints (Figure 5-1-14), and their sources also have been diversifying.
Fig. 5-1-14 Trends in Complaints by Pollution Category
Source : Environmental Dispute coordination Commission
(1) Noise and vibration
Noise is a problem with a deep relationship to daily life. The number of complaints related to noise made to local government is the greatest among the number of complaints for all types of pollution. The number of 15,094 cases in 1993 was less by about 2.9% compared to the 15,539 cases of the previous year. When the details of the numbers of complaints are looked at, the most, 5,885 cases, were for so-called neighborhood noise, such as household activities, loudspeakers and late night business operations. Next, in order, came factories and workplaces, 5,347 cases, and construction work, 2,743 cases. When the changes in the number of complaints in recent years are looked at, as a whole, including construction work noise as well as factory and business operation noise, they have been decreasing, but those for household activity noises have remained at the same level.
Concerning noise, in addition to noise being stipulated by environmental quality standards that are divided by type corresponding to time period and the land use conditions of an area, with respect to general residential environments, automobile traffic noise, aircraft noise and Shinkansen ("Bullet Train") noise, respectively, regulation standards are stipulated concerning the noises of factories and businesses as well as construction work and automobiles.
Since 1993 surveys have been conducted concerning the state of environmental noise that is compatible with environmental quality standards in general areas, with the exception of areas facing roads, consequently, 7,883 points of all the 11,205 measurement points conformed. Further, when specific points where measurement is periodically carried out are looked at, of 8,133 points, 5,816 points conformed.
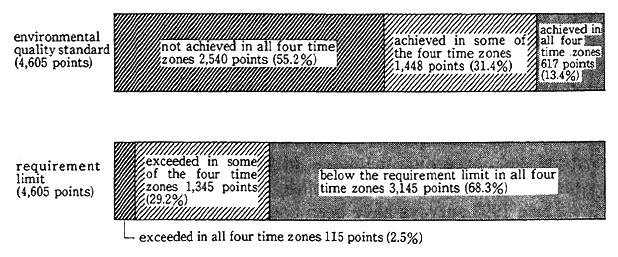
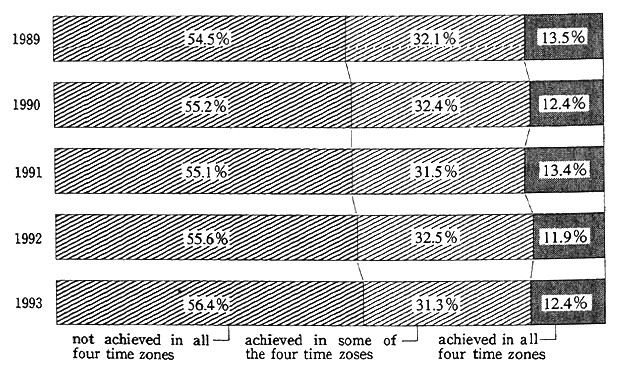
Concerning automobile noise, there is an environmental quality standard that has stipulated values according to road lanes and types of residential environment concerning, respectively, the four time zones of morning, midday, evening and late night, and there is a requirement limit that has become a standard of when the measures required by the Noise Regulation Law are called for, with respect to the governors of prefectures and the Prefectural Public Safety Commissions, and among the 4,605 measurement points in the entire nation the points that could not achieve the environmental quality standard (not achieve all four time zones or any one of them) amounted to 3,988 points. Among these, the points that exceeded the requirement limit (exceeded all four time zones or any one of them) has risen to 1,460 points (Figure 5-1-15). Further, when the 1,600 points that have been continuously measured for five years are looked at, 1,402 points in the entire nation could not achieve the environmental quality standard and non-compliance ratio remains at a high level. Automobile traffic noise is in as serious a state as before (Figure 5-1-16).
Regarding automobile noise countermeasures from now on, reports have been issued by the Central Environmental Council in February 1995 about the strengthening of regulations per automobile, and in March of the same year about comprehensive countermeasures, such as roadside countermeasures, traffic flow countermeasures and road construction countermeasures, respectively, and the promotion of comprehensive countermeasures in line with these reports is being planned.
Fig. 5-1-15 State of Achievement of Environmental Quality Standards and Exceeding of Requirement Limit
Source : Environment Agency
Fig. 5-1-16 Trends in Achievement of Environmental Quality Standards at Continuous Monitoring Stations
Source : Environment Agency
Concerning aircraft noise, countermeasures, such as the countermeasures for the areas around airports and the introduction of low noise aircraft are being carried out. In the areas of major airports, such as, Tokyo, Osaka and Fukuoka there is a trend towards an overall quality improvement when compared with the time when the environmental quality standards were established.
Concerning noise caused by the Shinkansen, quite a bit of improvement can be seen due to the countermeasures up to now, but quite a few areas that have not achieved the environmental quality standard have been left. Among these areas, in areas where 75 decibels is exceeded, such as the area along the Tokaido-Sanyo Shinkansen where a densely built up residential area is continuous, and in areas, such as where there are collections of residences as along the Tohoku- Joetsu Shinkansen, especially, countermeasures are being devised. Further, complaints about traffic noise and vibration were received since the opening of the new Seto Ohashi Line and the new Tsugaru Kaikyo Line that are ordinary railways and countermeasures for these problems are being devised.
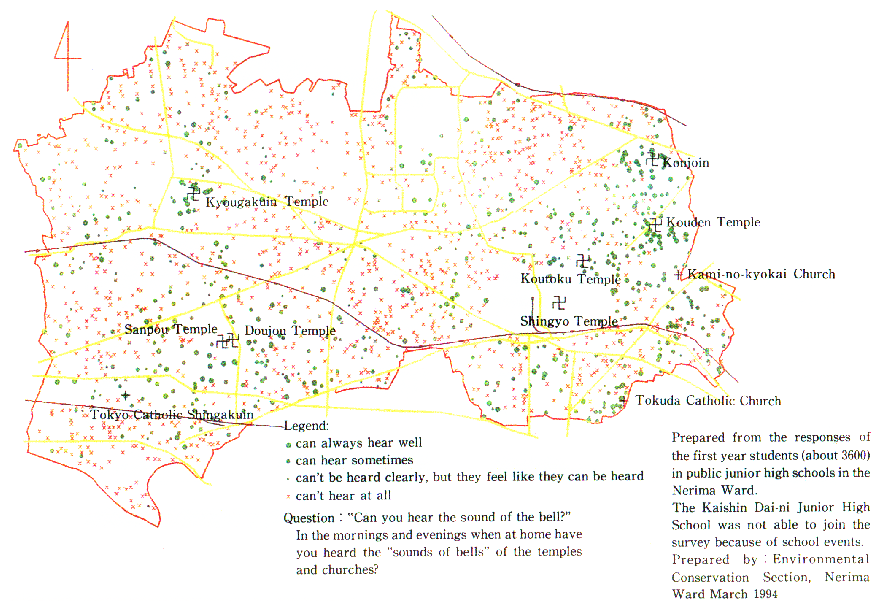
Further, recently, new measures are being started by national and local governments on countermeasures against the noise of daily living. These have actively incorporated the "soundscape" method that takes, as one part of the living environment, the sound environment that includes the desirable sounds of the area as part of the measures in response to noise problems, such as those due to daily living, such as idling of automobiles, the cries of pets, pianos, "karaoke" and loud- speakers. For example, Tokyo's Nerima Ward was commissioned by the Environment Agency to survey how the temple bells in the Ward area were heard by junior high school students and to draw a "Nerima Bell Sound Map" (Figure 5-1-17).
Concerning vibration, the number of complaints in 1993 was 2,083, a reduction by 5% from the previous year and 45% of the 4,648 cases of the peak year of 1973. Classified by source, as before, the construction work percentage was the highest at 44%, but recently, the number of complaints has decreased. Further, even if the changes in the number of all of the complaints are looked at, there is a decreasing trend.
(2) Offensive odors
Offensive odors are able to be felt due to the mixing in the air of substances that are the causes of smells that make people feel unpleas- ant and, because it is sensory pollution, similar to vibration and noise, it is a problem that is closely related to daily lives.
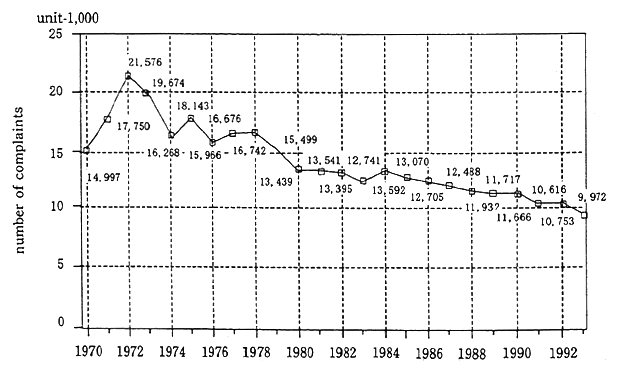
The number of complaints about offensive odors is decreasing year by year from its peak in 1972. The number of 9,978 cases in 1993 was less than half of those at the time of its peak, but from the middle of the decade that began in 1975 there has been a trend towards a gradual decrease or remaining steady (Figure 5-1-18). Among the number of cases of complaints related to the seven typical-type of polluions, after noise, offensive odor complaints are the most. When looking at the number of complaints by prefectures the order is Tokyo (972 cases), Aichi Prefecture (887 cases), Osaka Prefecture (660 cases), Saitama Prefecture (535 cases) and Chiba Prefecture (523 cases). They comprise one third of the total number of complaints in these top five prefectures. Classified by source, continuing from the previous year, most were the service industry and others (2,357 cases), followed by in order, the livestock and farming industries (2,143 cases) and private residences, apartments and dormitories (1,265 cases) and there is a trend for the percentage of cases of complaints about offensive odors classified as the so-called urban-type to increase.
In order to deal with this situation; 1) concerning the difficult area of dealing with the situation by means of standards regulating concentrations for each existing offensive odor substance that has become a problem in compound odors (the problem of multiple offensive odor substances mutually increasing and multiplying and being able to be felt strongly by human sense of smell), instead of this, have the ability to introduce a regulatory standard that uses an "offensive odor index" that utilizes human sense of smell and measures the degree of offensive odor ; and 2) the Law amending Offensive Odor Control Law that establishes rules for the roles that citizens, local governments as well as the central government should fulfill concerning the prevention of offensive odors that originate in the daily living, has been submitted to the 132nd session of the Diet and from now on plan the promotion of comprehensive offensive odor prevention policies based on this law.
Fig. 5-1-18 Trends in the Number of Complaints about Offensive odors
Source : Environment Agency.
Fig. 5-1-10 Map of the Distribution of Total Amount of Ozone
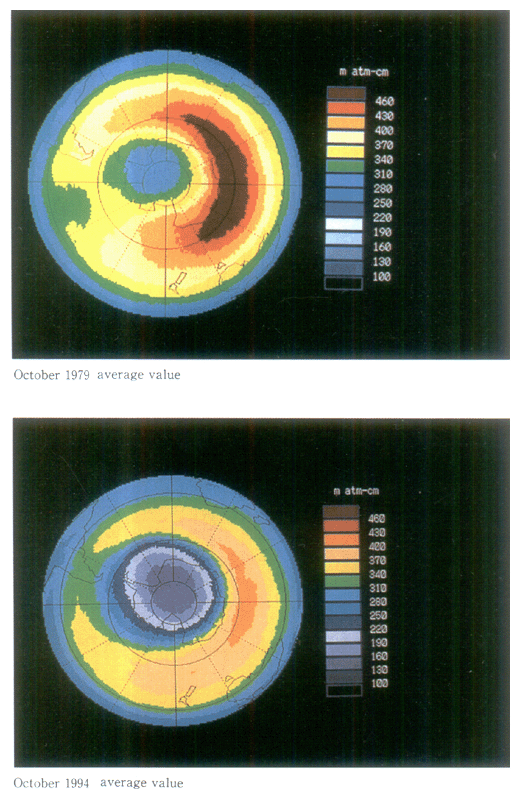
October 1994 average value
Note : TOMS data of Nimbus 7 (NASA)
Source : Meteorological Agency
Fig. 5-1-17 Bell Sound Map of Nerima-sounds of Bells in Everyday Life
Section2. Current State of Water Quality
Concerning the state of water pollution in Japan, as in the previous year, the environmental quality standards for hazardous substances have virtually been achieved. As for other hazardous chemical substances, although the concentration level is low, but it is still detected in the sediment. Further, concerning organic pollutants, in one fourth of the water area the environmental quality standards have still not been achieved, particularly, the improvement of rivers in cities as well as in closed water areas, such as inland bays, inland seas and lakes and reservoirs has not progressed. Concerning underground water, detection of organochlorine compounds is continuing. Further, the good water's edge environment is being lost.
1. Heavy Metals and Hazardous Chemicals
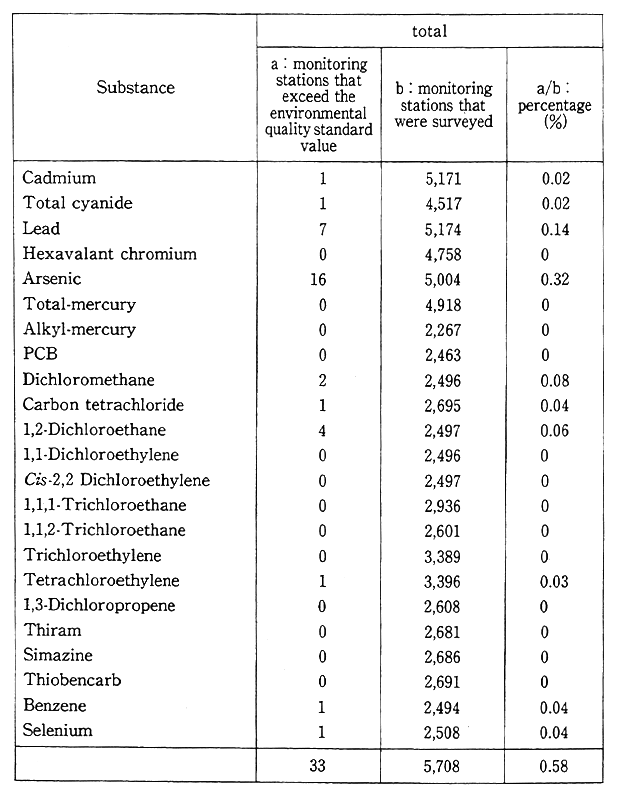
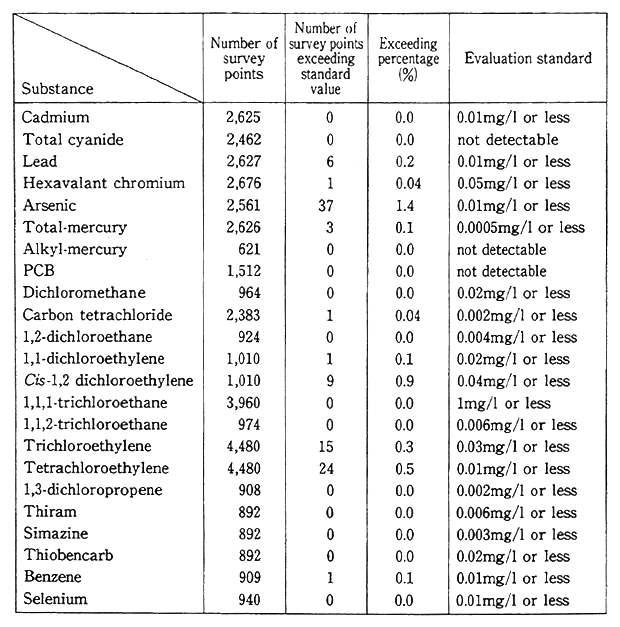
Concerning the health items of environmental quality standards, because the environmental quality standards were revised in March 1993, evaluations based on the new environmental quality standards from 1993 have been conducted. There are 33 points, among the 5,708 measurement points nationwide, that exceed the environmental quality standards and the rate of non-achievement was 0.58% (Table 5-2-1).
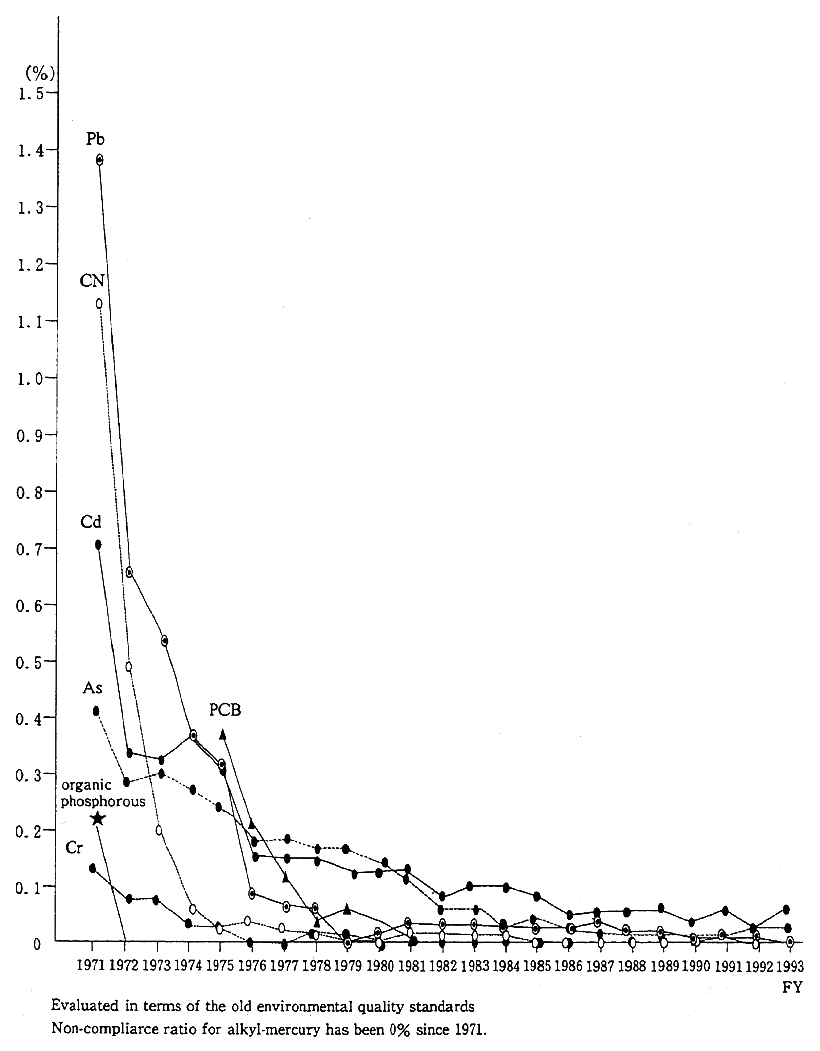
Further, according to the old standards the rate of non- compliance (the rate of the number of samples that exceeds the environ- mental quality standards with respect to the total number of samples), when the rate of non-compliance is calculated with respect to the old environmental quality standards it is 0.01%, the same level as in 1992, and it has been steadily improved since 1971 (Figure 5-2-1).
Further, according to the Comprehensive Environmental Survey of Chemicals of 1993 related to water quality with the objects of grasping the level of concentrations as well as the early detection of chemical substances that remain in the general environment, four sub- stances of the 18 substances that were the targets of the survey were detected in the water, but from the point of view of the detected concentration, they cannot be regarded as suggesting an immediate problem. Further, according to the survey results of continuously con- ducted water monitoring, ten substances have been detected.
Table 5-2-1 Percentage of Monitoring Stations where the Values of Environmental Quality Standards for Health were exceeded
Source : Environment Agency
Fig. 5-2-1 Trends in Ratio of Non-compliance with Environmental Water Quality Standards for Toxic Suistances
Source : Environment Ageacy
Still more, according to the results of the survey of designated chemical substances, of the five substances that were the target of the survey four substances were detected, but when compared to the results of surveys up to now a great change in the pollution situation was not able to be recognized.
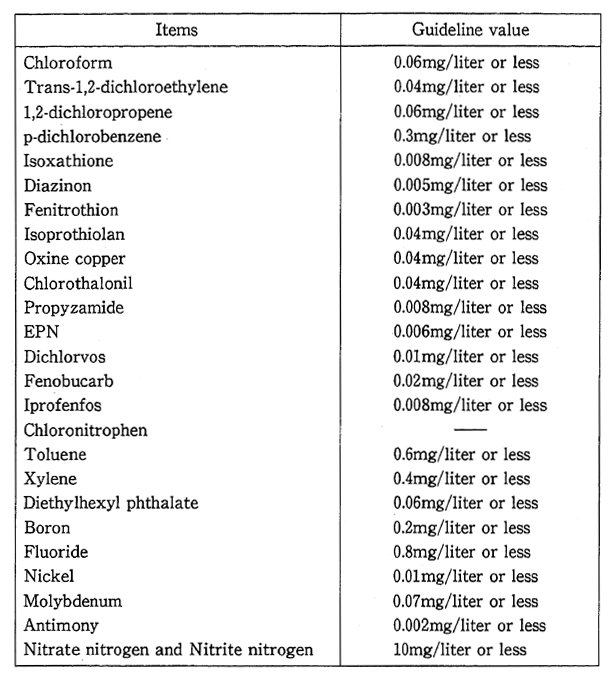
In Japan, since the decade beginning in 1965, in addition to the carrying out of water quality measurements concerning heavy metals and hazardous chemical substances as health item of the environmental quality standards, water discharge regulations were implemented. But in view of the recent situation of the widespread use of many and diverse chemical substances, a large-scale expansion and strengthening concerning the health items of the water environmental quality stan- dards was carried out in March 1993 from the viewpoint of preventing water pollution due to chemical substances. In addition to newly adding 15 items including trichloroethylene to the environmental quality stan- dards, it established 25 items that required observation in order to carry out continuous water quality measurement of water areas for public use even if a substance is detected in minute quantities (Table 5-2-2, Table 5-2-3). Further, in order to achieve the added health items of the environ- mental quality standards, in December 1993 items were added in the effluent standards of the Water Pollution Control Law, and plans are being made for the Water appropriate implementation of the Water Pollution Control Law ,including the formerly regulated items
Further , concerning chemical substances that are not currently regulated in the Water Pollution Control Law, the necessary monitor- ing, such as the chemical substances environmental survey, is to be continued.
Concerning the situation of water pollution due to agricultural chemicals, according to the results of the 1993 water quality survey of agricultural chemicals used at golf links, as before, there were cases of exceeding the index values set forth in the Guidelines for Prevention of Water Pollution by Agricultural Chemicals Used at Golf Links stipulat- ed in May 1990, but due to the guidance based on the provisional guidelines, year by year percentage of exceeding the index value has been becoming extremely small.
Further, as a countermeasure to prevent water pollution due to agricultural chemicals in public water areas, in addition to promoting the establishment of the registration reservation standard related to water pollution based on the Agricultural Chemicals Regulation Law up to now, since they are used over a wide area at one time, such as by dispersion of agricultural chemicals in the air, water quality evaluation guidelines have come to be established for agricultural chemicals for which standard values related to water pollution in public water areas have not been able to be stipulated. The detailed exchange of informa- tion related to the dispersal of agricultural chemicals and the results of water quality surveys among related organizations at the prefectural level will certainly be done from now on and plans for the thorough prevention of water pollution are being made.
Table 5-2-2 Environmental Water Quality Standards for Health
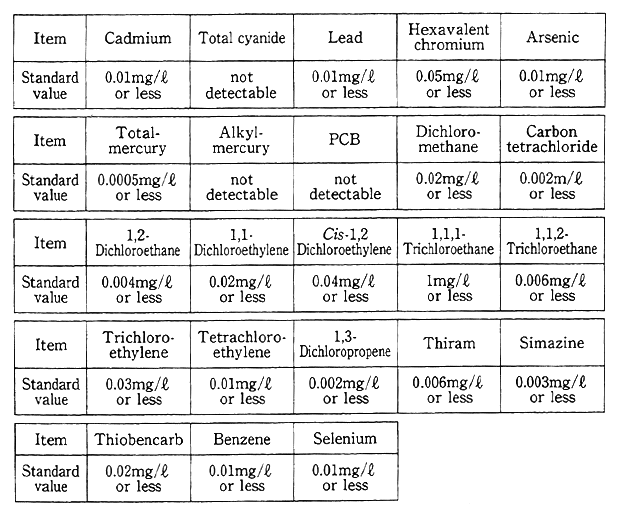
Notes: 1. The standard value is regarded as the annual average value.However, regard the standard value related to total cyanide as the highest value.
2. As for "not detectable," when measurement is done by the method stipulated in the notification of the Environment Agency, that result is less than the value of the measurement limit of the said method.
Source : Environment Agency
Table 5-2-3 Items for Precautionary Monitoring and Guideline Values
Source : Environment Agency
Changes in the pollution condition due to cadmium and lead in the main rivers of various countries are as shown in Figure 5-2-2. There is a trend towards improvement in many of the rivers of the advanced countries, hut serious pollution due to hazardous heavy metals is indicat- ed in some of the developing countries.
Fig. 5-2-2 Trends in Concentration of Lead and Cadmium in Major Rivers in Developed Countries
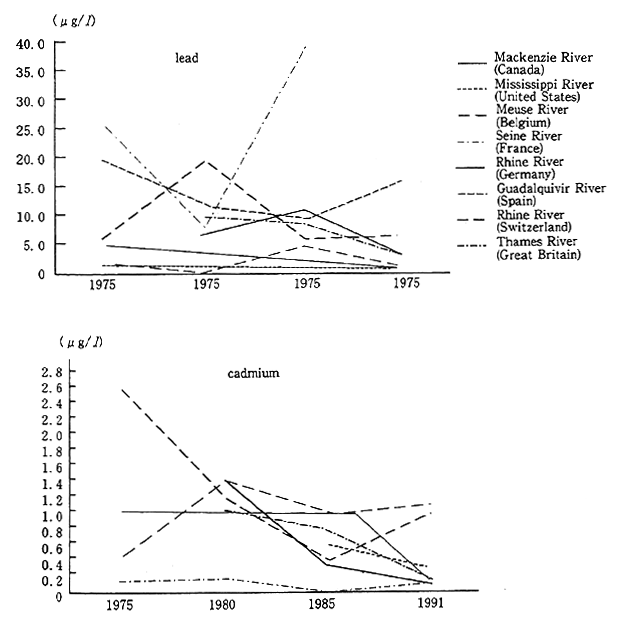
Source : OECD Environmental Data 1993
2. Organic Pollutants
In Japan, environmental quality standards are stipulated as an environmental condition that is desirable to be maintained for the conservation of the living environment and they are composed of five items for rivers, seven items for lakes and reservoirs and seven items for sea areas (Table 5-2-4). Concerning these living environment items, water categories are established based on the water use. By designating the relevant categories to each water area, the environmental quality standards take into consideration the special characteristics of each water area.
Table 5-2-4 Environmental Water Quality Standard Related to Organic Pollution
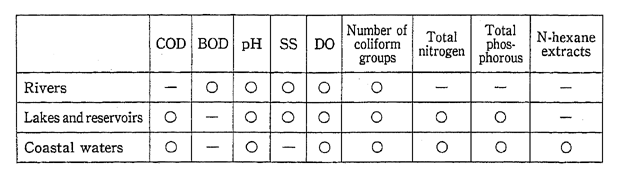
COD : chemical oxygen demand
pH : exponent of hydrogen ion concerntration
DO : dissolved oxygen
BOD : biochemical oxygen demand
SS : suspend solids
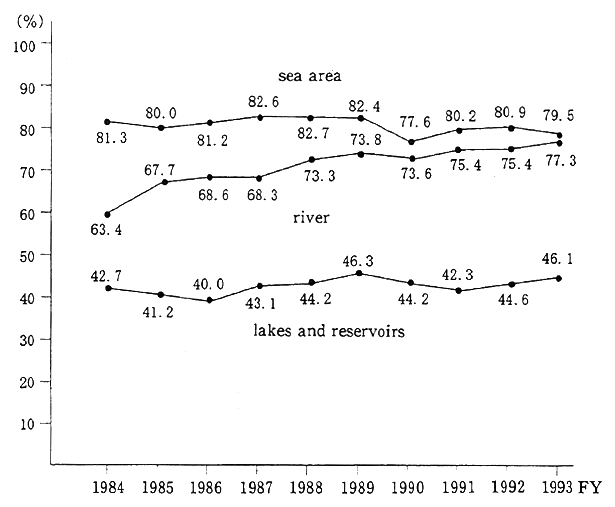
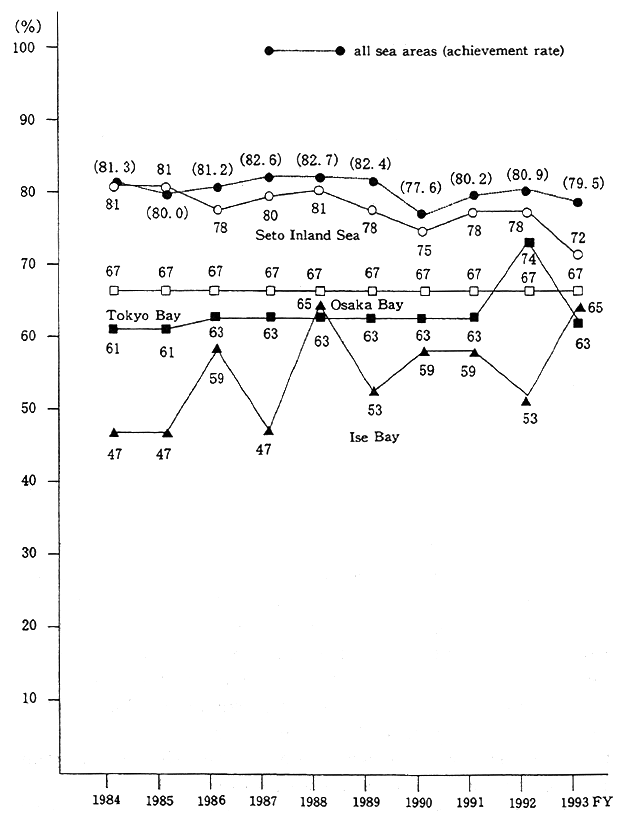
Because the living environment of a water area is most influenced by organic pollution, evaluation of the rate of achievement of the environmental quality standards is being carried out, concerning the items of the typical organic pollution indices namely BOD (rivers) and COD (lakes and reservoirs, sea areas). The rate of achieving the environmental quality standards of the living environment items (BOO or COD) in 1993, overall, was 76.5% (in 1992 75.2%), for rivers 77.3% (in 1992 75.4 %), for lakes and reservoirs 46.1% (in 1992 44.6%), for sea areas 79.5% (in 1992 80.9%) (Figure 5-2-3), and, the percentage for achieving total nitrogen and total phosphorous environmental quality standards was 33.3 % (in 1992 37.5%). When this result is looked at the trend of steady improvement in the rate of achievement of the environmental quality standards for rivers can be seen and it reached the highest achievement rate in 1993. The achievement rate for lakes and reservoirs recently has been improving somewhat, but it is moving at the low level of 40% as before. Concerning sea areas, it has decreased a little when compared to 1992, but it is moving at 80% more or less, maintaining a high achievement rate compared to rivers, lakes and reservoirs.
In closed water areas, such as lakes and reservoirs, inland seas and inland bays, because the exchange with outside water is difficult, pollutants easily accumulate and the improvement and maintenance of water quality is difficult. Particularly in lakes and reservoirs, due to the progress of eutrophication, problems are being caused, such as a decline in the degree of transparency, an influence on the fishing industry and the tinge of offensive smells in tap water. Because the rate of achieving the environmental quality standards is low, countermeasures to improve the water quality have become urgent business. Further, there are diverse sources of the COD pollution load that flows into lakes and reservoirs, such as living-related, industry-related and livestock industry-related sources. Which source has the greatest influence differs depending on the composition of industry and the land use in the lake and reservoir basins. When the recent changes in the level of COD at Teganuma Lake, Inbanuma Lake and Kasumigaura Lake, where the difference in actual water quality from the environmental quality standards has become striking, are looked at, the situation is generally staying the same with no conspicuous improvement.
Fig. 5-2-3 Trends in Achievement Rate of Environmental Quality Standards (BOD or COD) (classified by water area)
Further, aggregate water quality regulations related to COD are being implemented in the extensive closed water areas of the Seto Inland Sea, Ise Bay and Tokyo Bay based on the Water Pollution Control Law, and the Law Concerning Special Measures for Conservation of the Environment of the Seto Inland Sea. There has been a little change in the rate of achieving the environmental quality standard (COD) in these three sea areas, but recently there has been almost no fluctuation (Figure 5-2-4).
Fig. 5-2-4 Trends in Achievement Rate of Environmental Quality Standards for COD in Three Sea Areas
As for the pollution situation of rivers in cities, recently there has been a trend towards improvement, but there are some rivers that are as strikingly polluted as before. This is due to the increasing burden on rivers due to the increase in household sewage due to the expansion of the urban areas. But household sewage countermeasures, such as the provision of household sewage treatment facilities, such as sewerage systems as well as combined sewage treatment facilities etc., corresponding to the circumstances of the area, and work to directly cleanup the rivers are being carried out. The top ranking rivers with a high level of BOD according to the 1993 survey, are shown in Table 5-2-5. The source of pollution for the top three rivers is household effluent.
Table 5-2-5 Water Areas Recorded High Level of BOD(annual average value) in FY1993
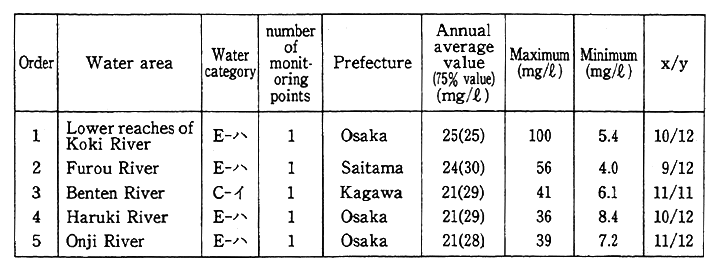
Notes :1. Ranked by the highest annual average value of BOD.
2. The maximum and minimum values are the average daily maximum and
minimum values respectively.
3. x/y is (the number of days that the daily average value does not satisfy
the environmental quality standard)/(total number days when measuring
of the daily average is done)
Source : Environment Agency
The Law Concerning Special Measures for Preservation of Lake Water Quality, in addition to striving to conserve the water quality of lakes and reservoirs, and to designating the lakes and reservoirs where the environmental quality standard is maintained for the purpose of contributing to ensuring the cultural life and the health of citizens, stipulates to develop a water quality conservation plan for lakes and reservoirs and provides special measures, such as detailed regulations with respect to water pollution sources. The designated lakes and reservoirs are Kamafusa Dam reservoir, Kasumigaura Lake, Inbanuma Lake, Teganuma Lake, Suwa Lake, Biwa Lake, Nakaumi, Shinji Lake, Kojima Lake and in addition, Nojiri Lake was designated in 1994.
In closed sea areas, such as Tokyo Bay, pollutants easily accumulate and the concentration of the nitrogen and phosphorous that have flowed in becomes high and eutrophication that worsens the water quality in which seaweed and other water life grow luxuriantly progresses. In these sea areas red tides and masses of oxygen-poor water occur and bring about harm to the fishing industry and obstacles to recreation. For this reason, the Environment Agency in August 1993 established effluent standards as well as environmental quality standards regarding nitrogen and phosphorous in sea areas and is striving for the promotion of measures to prevent eutrophication along with measures to prevent organic pollution. Concerning the designation of the water area category for the environmental quality standards, Tokyo Bay and Osaka Bay were announced on 28 February 1995 as being among the sea areas that the Director-General of the Environment Agency would do so.
Meanwhile, recently anxiety about the water system has been increasing and some kind of countermeasures, even in water areas for public use, have come to be demanded. Particularly, the creation of the substance called trihalomethane, which is suspected to cause cancer, due to the reaction of chlorine in the treatment process of water purification plants and organic matter, such as nontoxic humic in public water areas, has become a problem. For this reason the Law Concerning Special Measures for the Protection of Water Quality in Water Resources Area was enacted and went into effect in May 1994.
The situation concerning the total phosphorous, total nitrogen and BOD of the lakes, reservoirs and main rivers of various advanced countries shown in Figure 5-2-5. In general there is a trend towards improvement, but there are some rivers, lakes and reservoirs that are not changing or are becoming worse.
3. The Oceans
The ocean is the place where the pollutants on the land have finally come to rest and accumulated through the working of water. The ocean is vast, but the pollution of the ocean that accompanies human activity has come to be recognized worldwide.
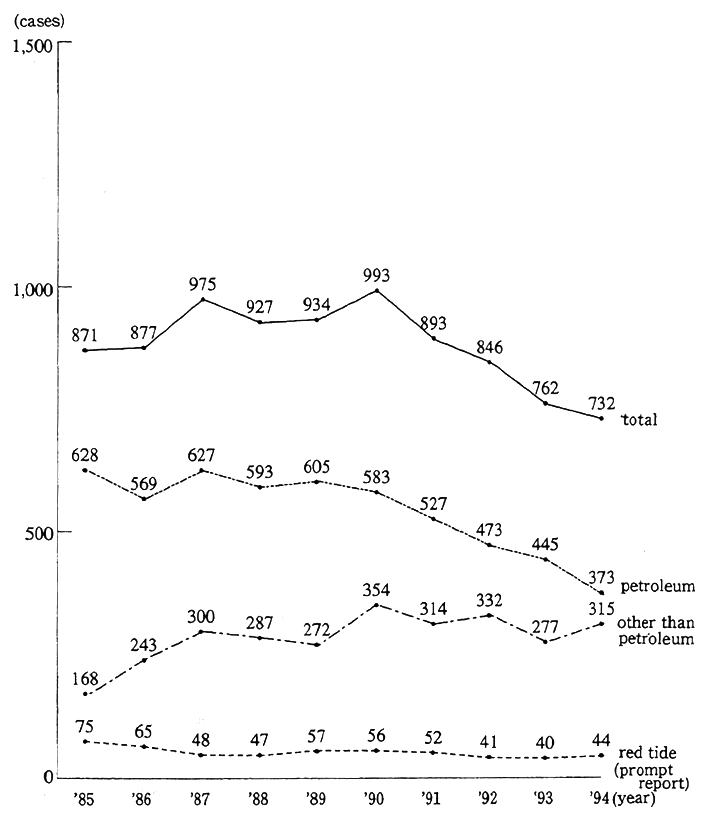
In the sea surrounding Japan in 1994 the Maritime Safety Agency recognized 732 cases of the occurrence of marine pollution. This was a decrease of 30 cases (about 4%) compared to 1993 and was the lowest ever (Figure 5-2-6). Among them, pollution due to oil comprised 373 cases, a high percentage of about 50% of the total number of cases. There were 315 cases of pollution due to something other than oil (waste, hazardous liquid substances (chemicals), factory discharge, etc.), and 44 cases of red tide. As for pollution due to oil, that from ships comprised about 80 percent. When they are classified by cause, most were due to careless handling, next were due to disasters at sea or caused intentionally, but those caused intentionally and those due to careless handling had decreased compared to the previous year.
The survey of the actual condition of pollution in the sea surrounding Japan carried out by the Environment Agency in 1993 measuring PCB and heavy metals, such as lead, cadmium and mercury, at 22 measuring points in inland bay areas to the southwest of Hokkaido and to the south of Tokyo Bay, but each substance was, generally, at the same level as in the previous year. Further, in the background pollution observations in the northwest Pacific area as well as in the vicinity of Japan carried out by the Meteorological Agency the levels were also the same as in normal years. The marine pollution survey in the ocean in the vicinity of Japan in 1993 carried out by the Maritime Safety Agency measured heavy metals, PCB, petroleum in the bottom sediment of the ocean and in the sea water. The result obtained was that there is somewhat of an increase and decrease each year in long-term, but there is almost no change, or a declining trend, in the marine pollution in the adjacent sea of Japan.
Fig. 5-2-5 Water Quality of Major Rivers in Developed Countries
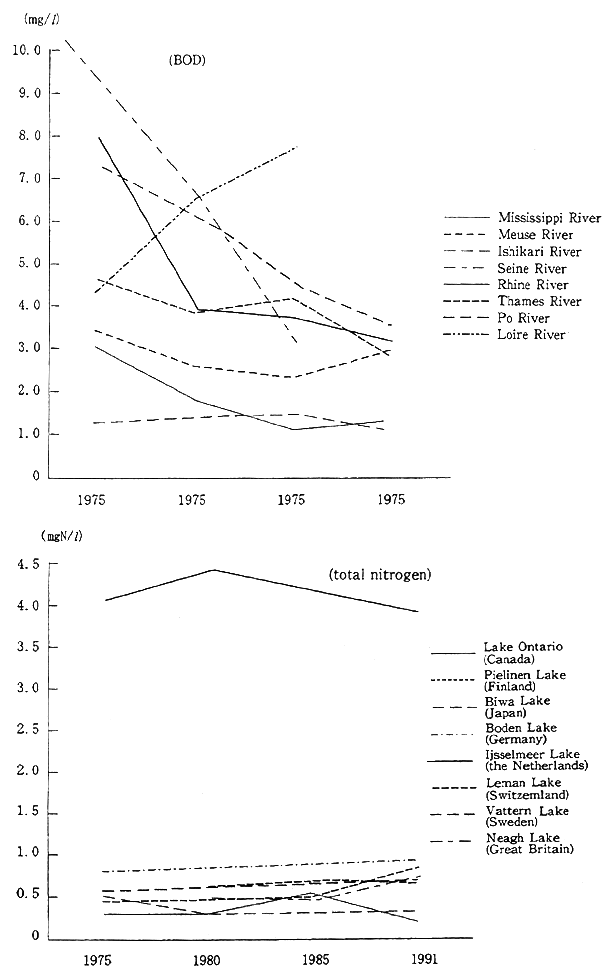
(Fig. 5-2-5 continued)
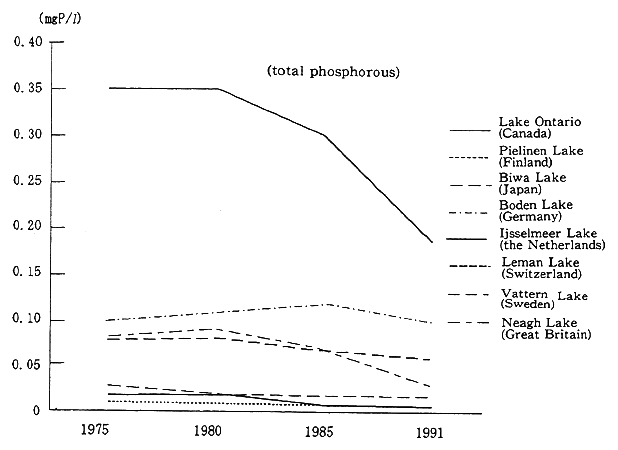
Source : OECD Environmental Data 1993
Fig. 5-2-6 Trend in Number of Confirmed Cases of Marine Pollution
Note : "Other than petroleum" means hazardous liquid substances, waste, etc.
Source : Maritime Safety Agency
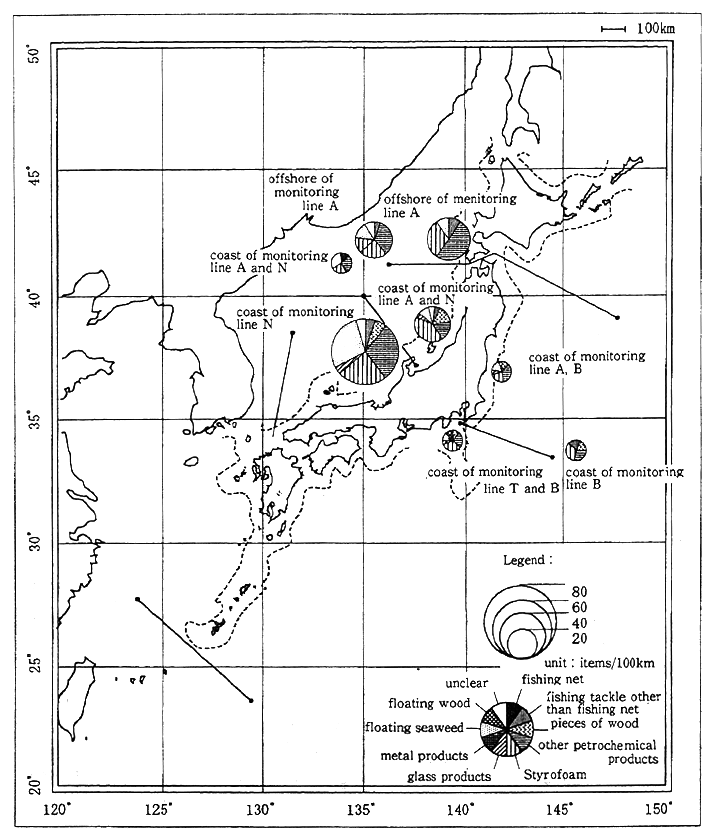
In the survey of the actual condition of pollution in the sea surrounding Japan, a survey of floating was carried out. When the result of visual survey is viewed divided into offshore and coast with a border at 50 nautical miles from the shore, in 1993, the same as in the previous year, the trend towards rather a lot of waste could be seen in the coastal area. Further, in 1993, on the Japan Sea side, as compared to the Pacific shore, an extremely large amount of marine debris was seen. As for the details of the marine debris, as in the previous year, there was much Styrofoam and many petrochemical products, most of which were less than 50 cm in size (Figure 5-2-7). On the other hand, in. the survey of minute floating items, items which are 10 mm or less were mostly seen at each observation point, but some floating items which are 10 mm or larger also were collected.
Fig. 5-2-7 Sightings and Composition of Marine Debris
Source : Environment Agency
Concerning pollution due to oil, in the ocean background pollution observation by the Meteorological Agency, floating tar balls were observed in the ocean in the adjacent seas of Japan. Besides being caused by ships due to careless handling or intentional actions, there is anxiety that they are caused by the outflow of crude oil due to maritime disasters that are linked to the danger of large-scale damage. As before, an accident in which loaded crude oil flows out, such as the running aground of the Exxon Valdez in 1989, the accident of the Max Naviga- tor in 1993 and the accident of the Seki in 1994, can happen at any time.
The crude oil that flows out requires a long time before it is broken down in the natural environment. Because there is a great possibility of it effecting the natural ecosystem of sea animals and plants, centering on the International Maritime Organization (IMO), measures are progressing, such as the revision of the MARPOL Conven- tion (making tankers double hulled) and the adoption of the OPRC Convention. On the occasion of concluding the OPRC Convention, the Law amending the Law Relating to the Prevention of Marine Pollution and Maritime Disaster was submitted to the 132nd Session of the Diet stipulating, among other things, providing the emergency measures handbook for the prevention of oil pollution of oil storage facilities and notification to the coastal countries that are the nearest to the place where oil spill accident occures by a ship discovered the accident. Further, the work is progressing to revise the London Convention that has the purpose of preventing the pollution due to ocean dumping of waste. Further, in September 1994 the revision of the Law Relating to the Prevention of Marine Pollution and Maritime Disaster, based on the March 1993 revision of the environmental quality standards related to water pollution, was carried out, and concerning 13 substances, such as dichloromethane, established disposal standards for the disposal into the sea of industrial waste that contain a certain amount or more of these substances.
4. Bottom Sediments
Many types of pollutants that are brought about through diverse routes may have been accumulating in the bottom sediment of the sea as well as of lakes, reservoirs and rivers. In Japan, by the process of the former conspicuous industrial pollution, the pollution of sediment containing mercury and PCB came to light. For this reason, by the end of 1992, throughout the nation dredging of bottom sediment amounting to a total of about 21.58 million m3 carried out with the object of removing hazardous substances.
In the 1993 environmental survey of chemical substances related to bottom sediment that had the objectives of detecting at an early stage the chemical substances remaining in the general environment as well as of grasping their concentration levels, found no substances that would become an immediate problem when viewed from the detected concentrations of the four detected substances of the 18 substances that were the subject of the survey. Further, according to GC/MS Monitoring Survey of Water and Bottom Sediment that is being continuously carried out, 19 substances in all have been detected.
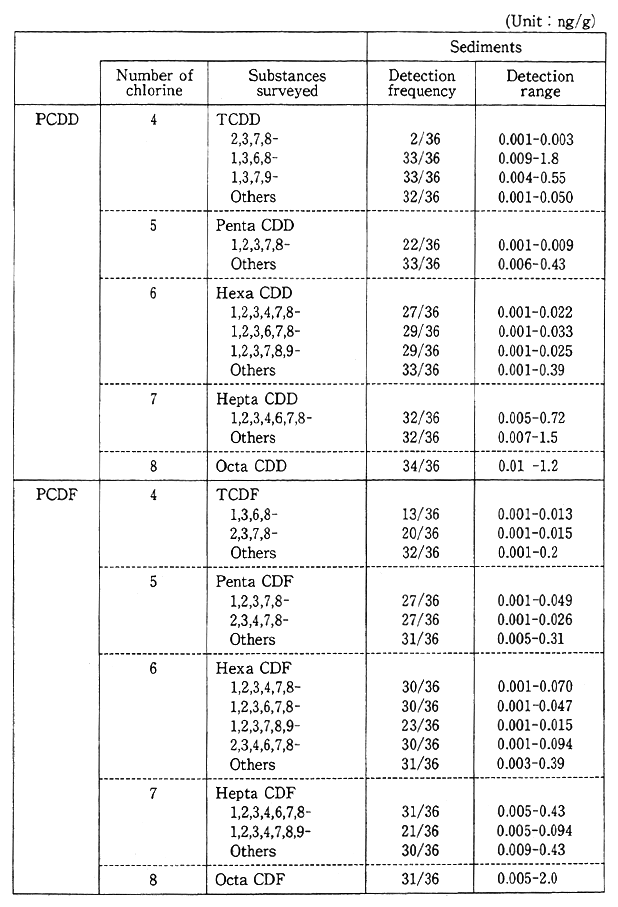
Further, because environmental pollution due to chemical substances, such as dioxins, that are unintentionally generated in the combustion process and the synthesizing process of chemical substances have become a problem, the Environment Agency has been conducting, since 1985, Environmental Surveys on Unintentionally Generated Chemical Pollutants (the revised name of the Follow-up Survey of the Actual State of Pollution Due to Hazardous Chemical Substances). According to the 1993 survey results, the state of pollution of the general environ- ment due to dioxins, at the present time, cannot be regarded as exerting an influence on people's health, but even though the concentrations are low, dioxins have been detected and it is necessary to do follow-up observations of the changes in their pollution situations continuously from now on (Table 5-2-6).
5. Ground Water
Ground water is a precious water resource with such characteristics as, generally, good water quality and a stable temperature. Even at present, about 30% of the water used by cities is depend on ground water. However, since the last half of the decade that began in 1975, ground water pollution due to organochiorine compounds including trichloroethylene, has come to be revealed. These, in most cases, can be thought to be caused by the improper management of hazardous substances and the waste and effluents that containe them.
Under the revision of the Water Pollution Control Law, since 1988 governors of prefectures must regularly observe the pollution condition of ground water, and the national as well as the local governments are carrying out water quality monitoring of ground water. A survey is divided into three types. There is general condition survey that grasps the regional ground water condition. Concerning the pollution newly detected by the general condition survey, there are the surveys on areas around polluted wells that confirms the scope of its pollution. And, there is the periodic monitoring survey that carries out secular type monitor- ing, such as continuous observation of the pollution confirmed by the survey of the area in the vicinity of a polluted well.
Table 5-2-6 Survey of Dioxins in Sediments (1993)
Source : Environment Agency
Table 5-2-7 Results of Ground Water Quality Monitoring (general survey)
Note : As for the evaluation standards, they are the same values as the standard values for the health items of the environmental water quality standards, and due to the revision of the environmental water quality standard in March 1993, organic phosphorous was eliminated, but on the other hand 13 sub- stances, such as dichloromethane (the evakiation standards had already been set for trichioroethylene and tetrachioroethylene.), were added, and the values of the evaluation standards concerning lead and arsenic have been strengthened.
Source : Environment Agency
The results of the 1993 general condition survey are shown in Table 5-2-7. As before, the detection of substances that exceed the evaluation standards can be seen. Further, because the evaluation standards were revised in March 1993, since 1993 evaluation has been carried out based on the new evaluation standards. When ground water pollution is detected, besides carrying out guidance with respect to businesses that use hazardous substances, and guidance on the method of using a well, measures are carried out designed, when necessary, to improve the water quality of the polluted ground water.
Ground water pollution due to nitrate is a problem that came about in the United States and Europe in the decade of the 1960s due to the use of the large amounts of nitrogen-base fertilizer that ac- companied fertilizer intensive agriculture, but recently in Japan, also, ground water pollution due to nitrate has begun to come to light. According to a survey conducted in 11 prefectures in 1993, as for the concentration of nitrate 4.9% of wells surveyed exceeded the index value (10 mg/1) that requires observation. Generally, fertilizer, livestock industry waste, household effluent can be regarded as the sources of ground water pollution due to nitrate. Since it has been reported that nitrate is an environmental influence on infants, it is a problem that cannot be overlooked. In Japan also, since areas with a high level of pollution can be seen in every part of the country, countermeasures in polluted areas, including grasping the actual situation, are coming to be necessary.
6. The Environmental Amenitis around Water
In the coastal areas and rivers that have a deep relationship to socioeconomic activity and to people's lives man-made alterations are being carried out, such as landfill due to the development of urbaniza- tion. The habitat of organisms living at the water's edge is being harmed and the good water's edge environment is being lost, such as by the drying up of familiar springs and the decline in the volume of river flow. Further, concern about the water's edge has been increasing, and a pleasant water's edge environment is coming to be demanded.
In cities, examples of the drying up of familiar springs and the decline in the amount of river flow are occurring, according to the report of the survey of the actual situafion of Tokyo's ground water in 1992, in which there is a trend towards a decrease in the amount of flow in small and medium size rivers that are the sources of springs. In central Tokyo more than about 180 springs have disappeared or dried up from the Meiji period until the time of the survey in 1990. In the water courses and small and medium size rivers in urban areas the normal flow of water has remarkably decreased and there are also some in which the flow of water has disappeared except when it rains. Rivers and water courses are not just the habitats of aquatic life and organisms of the water's edge. Since they are migration routes that connect the various stretches of green land that are the habitats and breeding grounds of diverse variety of animals, a continuous water's edge envi- ronment is necessary. Further, because ensuring the amount of river flow, in addition to purification measures for water courses and rivers that have difficulty in achieving the environmental quality standards, are necessary, there is a movement to conserve the flow of water, called the revival of the clear flow.
As for public water area, such as the coast, because it has become difficult to secure sites and places for public use or the final disposal of waste inland, the demand for the filling in of public water area is strong, as before. Even at the present time, various types of development are planned for the Tokyo Bay coastal area and this has caused anxiety about it having a bad influence on the environment of the water's edge, such as by damaging the abundant water resources, the hydrophilic functions, and the natural purification functions possessed by the water' s edge environment.
Further, the water's edge for a long time has been creating a unique scenery. When preparing sea walls and the space along rivers, a water's edge environment that is highly hydrophilic and is harmonious with the surroundings is also required. There are examples of the creation of the inlet for the purpose of river creation that considered the ecology of fish at the Kiso River in Aichi Prefecture, the natural stone sea wall of Yamaguchi City's Ichinosaka River, and of successfully attracting fireflies by means of plantings at the water's edge.
Section3. Soil Environment and Ground Environment
1. The State of Soil Environment
Since the activities of organisms are deeply involved with and formed by the soil, it is an important constituent element of the environ- ment and also is responsible for an important function in the mainte- nance of the ecosystem. For this reason, when the function of the soil is harmed, there is the danger of bringing about a worsening of the ecosystem and of threatening the existence of organisms including human beings.
As for soil pollution, besides the cases of directly mixing polluting substances into the soil, there are the cases of imposing a burden on the soil indirectly by water pollution and air pollution. Soil pollution is pollution of accumulated nature so that once soil pollution occurs it effects the environment over a long period of time, such as affecting in ground water and in agricultural products.
Soil pollution of agricultural land is something that has been seen for a long time, such as in the pollution due to copper poisoning in the Jinzu River basin after the World wWr II, and in the Watarase River basin in the Meiji Period. For this reason, concerning agricultural land, in addition to countermeasures against pollution sources under the Water Pollution Control Law, based on the Agricultural Land Soil Pollution Prevention Law, standard values have been established for cadmium, copper and arsenic, and concerning agricultural land that has been polluted because these were exceeded standard values, countermeasures, such as bringing in topsoil, are carried out.
In the 1993 detailed survey of countermeasures to prevent the soil pollution of agricultural land, as in 1992 there were no areas where pollution was newly discovered. Further, the percentage of the area in which countermeasure work was completed, with respect to the area in which pollution was detected, was 68.9% (in 1992 66.1%) with respect to the 7,140 ha of detected area.
Other than agricultural land, concerning soil in urban area, cases where pollution has become tangible are increasing nationwide. Especially, cases of soil pollution often become apparent when the alteration of land, such as former factory site is carrie out. Concerning this kind of urban soil pollution, in the survey related to the circumstances of implementation of 1992 soil pollution countermeasures, a total of 177 cases since 1975 have been reported and recently the number of cases that have been ascertained is on an increasing trend (Table 5-3-1).
The causes of soil pollution are, for example, leaking accompanying damage to manufacturing facilities, improper burying of waste on factory sites before enforcement of the Waste Disposal and Public Cleansing Law, improper handling of pollution causing substances and illegal dumping. When classified by industry it occurs most in the chemical industry, the electroplating industry and the electric machinery and tools manufacturing industry. As for pollutants, in addition to the heavy metals, such as lead, chromium, mercury, recently, the increase of trichloroethylene and tetrachloroethylene has been striking. In the face of this situation, in February 1994, to the ten environmental quality standard items related to soil pollution then in effect were added 15 items, such as trichioroethylene, tetrachloroethylene and carbon tetrachloride, to become 25 items.
Table 5-3-1 Number of Urban Soil Pollution Cases by Industry and Pollutant
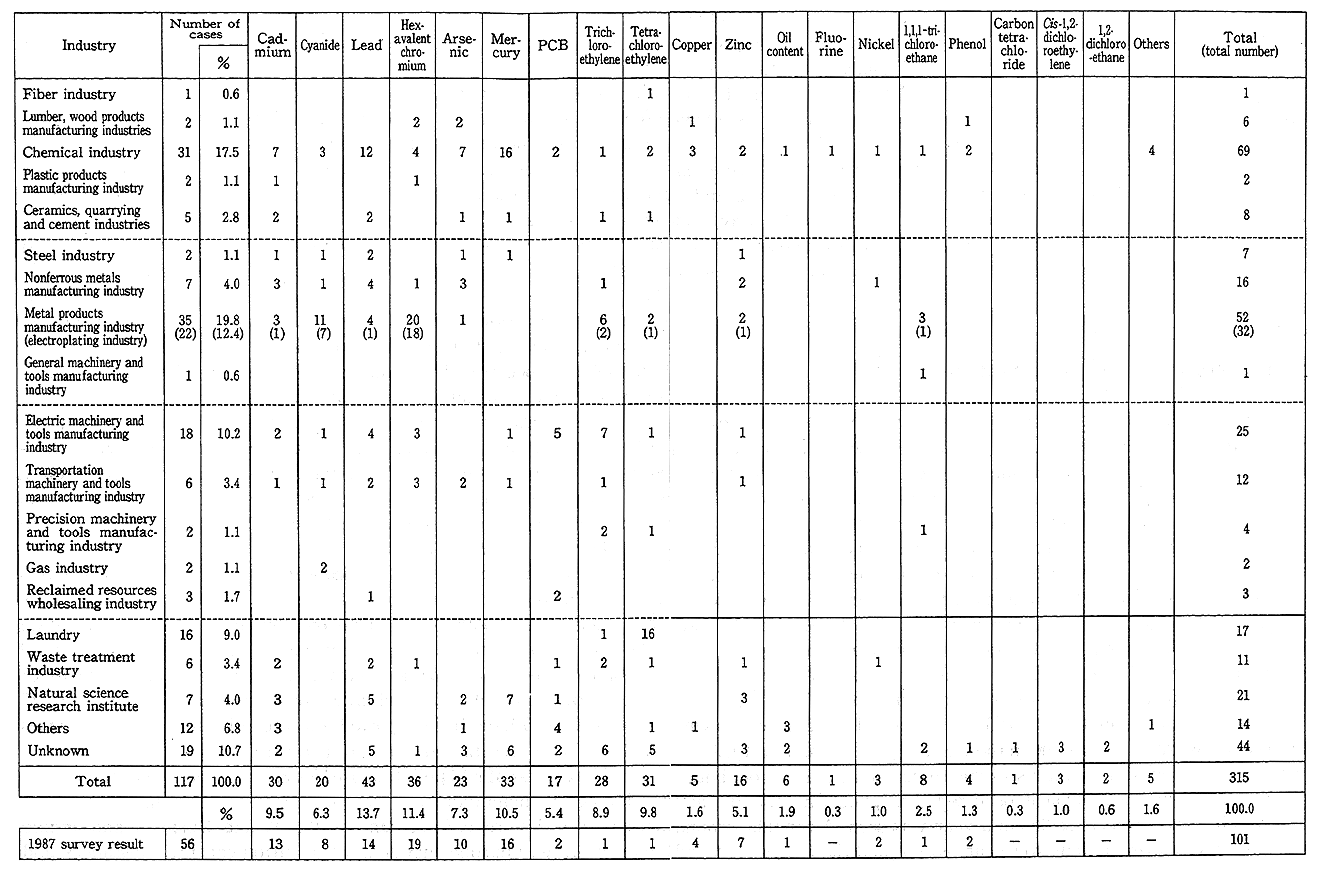
Source : Environment Agency
Concerning the situation in various foreign countries, in the United States former sites for the final disposal of waste during the period when regulation was lenient have become a problem. Cleanup is progressing by means of, for example, the Superfund Act that carries out measures as a fund supplied by the taxation of petroleum and chemical products or by companies that are polluters carrying out measures bearing joint liability. Further, in various European countries, also, soil pollution measures are progressing in, for example, the Netherlands and Germany. Meanwhile, in Bulgaria pollution due to heavy metals in the area adjacent to metal factories and in Poland pollution in industrial area due to the improper handling of waste have become problems.
Further, in developing countries soil degeneration is occurring due to improper agricultural activities as well as overgrazing and is becoming a big problem. When looked at worldwide in this way, concerning soil, besides pollution, problems like its outflow and salinization due to salt going up to the surface also are occurring and international cooperation is called for.
2. The State of Ground Subsidence
Ground subsidence, mainly, occures when the level of ground water falls due to excessive extraction of ground water and clay layers contract. Once ground has subsided it does not return to its former position and brings about an increase in inundation damage during floods and the damage to and destruction of structures.
Ground water is a source of good quality and constant temperature water. Further, because it is easy and inexpensive to extract for such purposes as household water, industrial water, agricultural water and for melting snow, ground subsidence over a large area has accompanied the increase in the demand for water due to the improvement in the standard of living, the development of various types of industry and the development of deep well drilling technology.
In the past, before the World War II, ground subsidence was seen in the Koto Ward of Tokyo and in the western part of Osaka City. After the war for a period it became still due to economic stagnation, but in the decade beginning in 1965 it occurred throughout the country and severe subsidence exceeding 20 cm a year was seen. After this, ground water extraction restrictions were carried out and the long-term trend is towards a lessening of ground subsidence, but in some areas striking subsidence continues as before (Figure 5-3-1).
In 1993, the area of ground subsidence regions of 2 cm or more per year decreased from 525 km2in 19 regions in 1992 to 276 km2in 11 regions. Of them the area of ground subsidence regions of 4 cm or more per year decreased from 25 km2in six regions in 1992 to less than 0.5 km2in one region.
Fig. 5-3-1 Ground Subsidence in Fiscal 1993
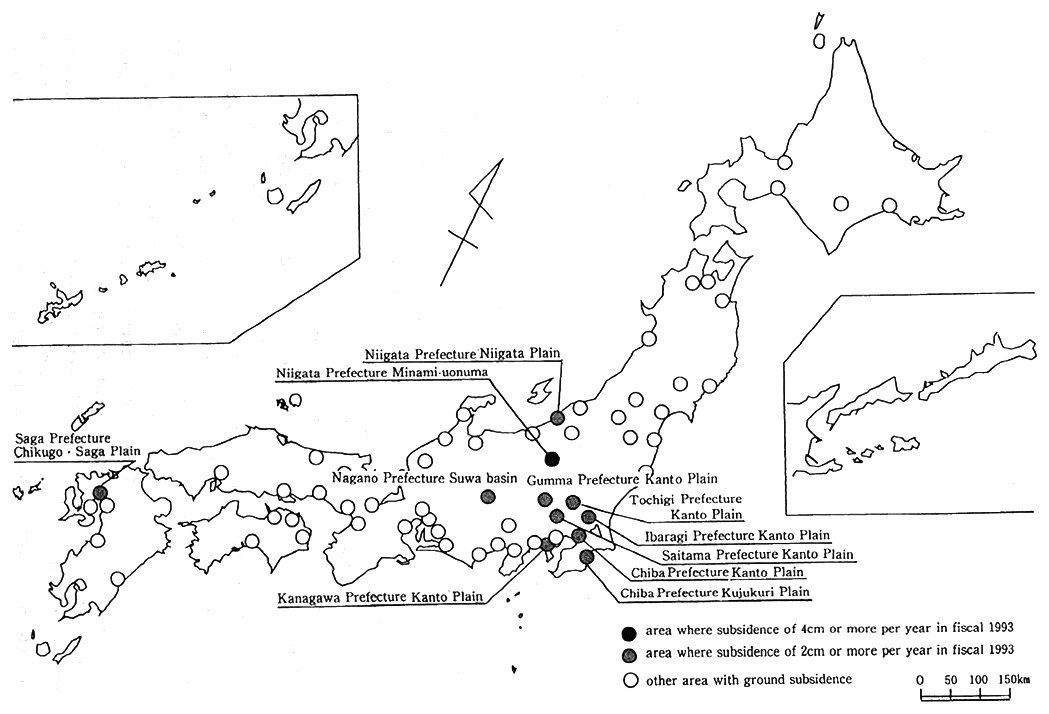
When classified by region, in Minami-uonuma in Niigata Prefecture, with the largest subsidence amount of 7.3 cm, for three years in a row has been the place of greatest subsidence in the country. Further, besides extensive ground subsidence being newly recognized at Niigata plane, areas of remarkable ground subsidence, such as the northern part of Kanto Plane, are occurring as before. From now on it is necessary to watch the changes carefully and to respond appropriately.
Section4. The Situation of Waste Management
1. General Wastes
General wastes are classified into household related waste produced along with people's daily lives, business related waste and raw sewage. The types of wastes have increased along with the diversification of life. Waste that is difficult to appropriately manage, such as large household items that have become unusable, have become a problem.
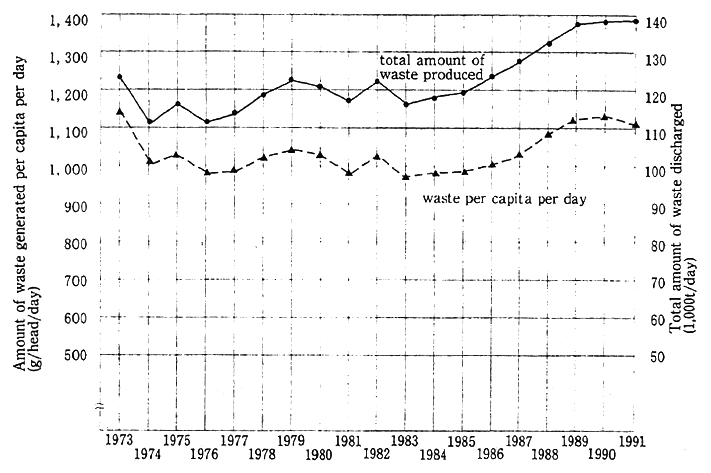
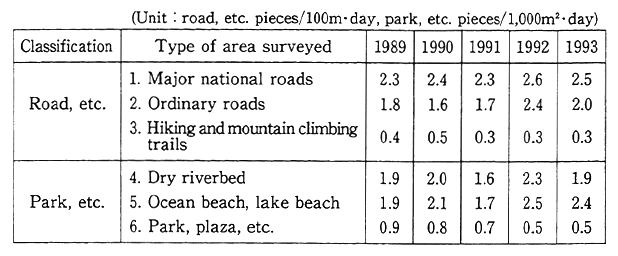
The amount of wastes discharged in 1991 was 50.77 million tons per year (enough to fill about 136 Tokyo Domes, in 1990 it was 50.44 million tons), compared to the previous year it was 0.6% increase (as for 1990 0.9% increase). Further, the amount of discharge per person per day was 1,118 grams (in 1990 1,120 grams), the first decrease in eight years. According to the past changes, the waste discharge amount increased in proportion to the enlivening of social activity and citizens' lives. At the time of the oil crisis in 1973 it decreased temporarily, but afterwards there was an increasing trend as before (Figure 5-4-1). In the treatment of general wastes, securing their disposal sites, especially, final disposal sites is becoming a problem. Along with the increase in the amount of waste generated the remaining capacity of final disposal sites is rapidly decreasing. In 1993 there were 2,250 final disposal sites (waste landfill disposal sites, 2,336 sites in 1990) and the remaining capacity was 156.83 million in almost the same amount when compared to the 156.70 million m3of 1990. As for the number of remaining years, when the specific waste of garbage is calculated as 0.82, the national average is about 7.8 years, but in the metropolitan areas of Tokyo, Kanagawa Chiba and Saitama Prefectures, the 1992 amount of waste finally disposed of comprised 24.4% of the national total (about four million tons), but the number of remaining years of final disposal sites were about 4.9 years, less than the national average. In the midst of such difficulties in securing disposal sites, the reduction of the amount of waste generated and reclamation and reuse of resources have become urgent matter. In 1991 the Waste Disposal and Public Cleansing Law was revised, further, the Law concerning Resource Reclamation and Reuse was enacted and efforts are being made to promote the reclama- tion and reuse of resources. In Japan it is estimated that the number of empty beverage cans produced in the year 1993 was about 31.8 billion, a slight increase when compared to the 31.7 billion of 1992. The Environ- ment Agency has been conducting a survey continuously since 1983 to grasp the actual situation of empty can littering in the nation. The situation of empty can littering in 1993, compared to that of 1992, on hiking and mountain climbing paths, parks and plazas was the same level, on national highways, principal roads, the seashore and lake shore it was a little less, on ordinary roads and riverbeds it had decreased. When the recent several years are looked at, there was a rather worsened situation in 1992 and 1993 (Table 5-4-1). The national and local governments have carried out various measures to prevent empty can littering, but they haven't amounted to a basic resolution and still more measures, such as resource reclamation, have become necessary.
Fig. 5-4-1 Trends in Total Waste Generated and Amount per Capita per Day
Source : Ministry of Health and Welfare
Table 5-4-1 Number of Empty Cans Littered
Source : Environment Agency
Recently, concern has increased about the discharge of water from raw sewage treatment facilities from the viewpoint of preventing water pollution in public water areas, but the amount of raw sewage treated in 1991 (the amount of raw sewage collected from households without flush toilets) was about 36.76 million kiloliters, and was about the same level when compared to the 36.21 million kiloliters of 1990. Further, the population without flush toilets is 39.69 million people (32% of the total population), and, as before, the situation is such that they comprise a large percentage.
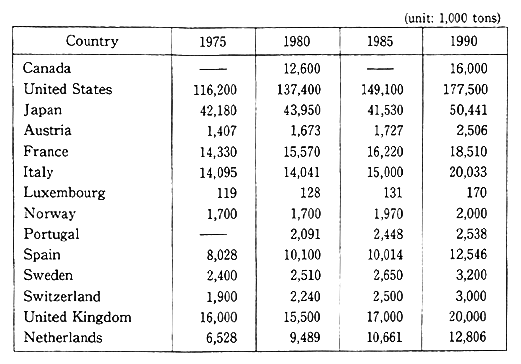
Concerning the amount of generation of general wastes in OECD member countries, the methods of evaluation have not been standard- ized, but since 1975 the trend has been for it to increase in most countries (Table 5-4-2).
2. Industrial Wastes
The total amount of industrial wastes in the nation in 1991 was about 398 million tons, about a 1% increase when compared to the 395 million tons of 1990, and compared to the average rate of increase of 5% since 1985 it can be seen that the increase has slowed. This can be regarded as being attributed to the decline in economic activity from around 1991 in contrast to the period from 1985 until 1990 in which the economy was good (Figure 5-4-2).
When the amount of generation is looked at classified by indus- try, the agricultural and construction industries each comprised about 20%, next were the electricity, gas, heat supply, water system and steel industries in order. Further, classified by type, most of the amount discharged was sludge, next were the feces and urine of animals and construction waste materials. These three types comprised more than three fourths of the total amount.
Table 5-4-2 Changes in Amount of Municipal Waste Generated in Developed Countries
Source : OECD Environmental Data 1993
Fig. 5-4-2 Trends in Amount of Industrial Waste Generated in Japan
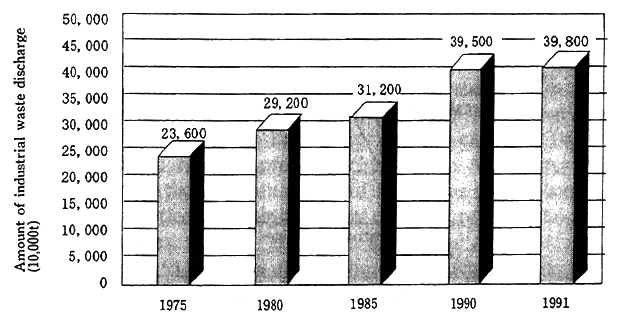
Source : Ministry of Health and Welfare
Concerning the industrial waste treatment situation, about 158 million tons, equivalent to 39% of the total, is reused, 91 million tons, equivalent to 23%, is finally disposed, but the securing of final disposal sites has become a big problem at the present time. Especially, in metropolitan areas (Ibaraki, Tochigi, Gumma, Saitama, Chiba, Tokyo and Kanagawa Prefectures) the number of years remaining for final industrial waste disposal sites, as of April 1992, was only 0.5 year, and there are also many cases in which disposal is done in other prefectures.
This situation of difficulty in securing final disposal sites has become a cause of the illegal dumping of industrial waste and there is the danger of an increase in soil pollution. Centering on construction waste, the 1994 amount of illegal dumping of industrial wastes in the nation rose to about 1.11 million tons (1.45 million tons in 1993) (Figure 5-4-3).
Fig. 5-4-3 Trends in Illegal Dumping of Industrial Wastes
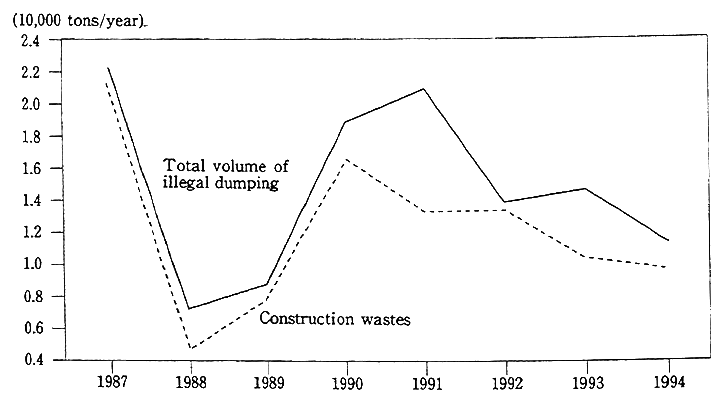
Source : National Police Agency
3. Transboundary Movement of Hazardous Wastes
As for the wastes generated by socioeconomic activity and people's daily lives, along with the improvement in the living standard and the expansion of the economy, they become more qualitatively diverse, and their amounts increase, and, along with the increased difficulty of treating them in the country which generated them, cases of movement across borders to search for disposal sites are increasing. Particularly, it is easy to move from countries where it is expensive to treat hazardous wastes to countries where it is inexpensive, or from countries where treatment regulations are severe to countries where they are lenient. For this reason, when the treatment is not appropriate in the countries that receive them there is the danger of an influence on the ecological system and the living environment of those countries. The movement of hazardous wastes has become a problem on a global scale.
As examples of the cross border movement of hazardous wastes, besides the Sebeso polluted soil transport incident, in which dioxin- polluted soil produced in Sebeso, Italy, in 1976 was temporarily missing and later discovered in France in 1982, such incidents have occurred as the disposal incident in which a Norwegian company brought 15,000 tons of hazardous wastes from the United States to Guinea, the incident in which 3,900 tons of hazardous wastes were carried from Italy and disposed of in Nigeria under the pretext of being chemical products, and the incident of the ship from Philadelphia in the United States loaded with 14,000 tons of hazardous incineration ash that was refused entry into various countries and about two years later was suspected of having thrown it into the Indian Ocean.
As for the cross border moyement of hazardous wastes, in the first half of the decade of the 1980s, for example, the movement within Europe stopped, but when the last half of the '80s came the range of movement began to rapidly spread to countries in Africa and South America. In Japan, there are examples of hazardous wastes becoming involved in international transactions in order to recover the useful substances in wastes.
With respect to this kind of cross border movement of hazardous wastes on a global scale, the creation of international rules is being studied centered on the United Nations Environment Programme (UNEP) and in March 1989 in Basel, Switzerland, the Basel Convention on the Control of Transhoundary Movements of Hazardous Wastes and Their Disposal was adopted. In Japan, also, in addition to joining the Basel Convention in September 1993, in December of the same year the domestic law, the Law concerning Regulation of Exports and Imports, Etc. of Specified Hazardous Wastes, Etc., was enacted. From now on the promotion of international cooperation as well as the minimization of the importation and exportation of hazardous wastes, and of the amount of hazardous wastes produced, have become tasks, and efforts to improve the implementation of countermeasure under the interna- tional framework are continuing.
Section5. State of Natural Environment
1. The State of Natural Ecosystems in Japan
(1) Climate and topography
The Japanese archipelago, situated at the eastern edge of the Asian Continent, is a long and narrow island extending north and south from near 24 degrees north latitude to near 46 degrees, a difference in latitude almost equivalent to that from Athens, Greece to Oslo, Norway. Further, because Japan is in the middle latitude zone, from the south to the north there are great differences in climate. When the average temperature is looked at, at Abashiri in Hokkaido it is about 6.0 degree C and at Naha in Okinawa it is about 22.4 degree C.
Meanwhile, because Japan is separated from the Asian Continent by the Sea of Japan and the East China Sea, Japan's climate is gentle compared to the severe climate of the continent. But the low pressure of the summer and the high pressure of the winter that are generated on the continent exert a great influence on the climate of Japan. In the ocean currents that flow in the vicinity of Japan there are the Kuroshio and the Tsushima current that separates from the Kuroshio that are warm currents, and the Oyashio and Liman currents, that are cold currents. These currents, also, exert not a little influence on Japan's climate. Further, the rains of summer and autumn and the heavy snowfall of winter that come with the activity of fronts bring about an amount of precipitation in Japan that exceeds the world's average and makes Japan's water resources abundant.
Further, the mountain ranges that run the archipelago with many undulations cause Japan's climate to have a regional character. Particularly, in the winter the differences in climate between the Sea of Japan side and the Pacific Ocean side become conspicuous. Japan's mountains, including the Japan Alps with peaks of 3000m or more located in the center of Honshu, occupy about 60% of the land area. Generally, since the temperature becomes lower as the altitude above sea level increases, the steep topography makes Japan's climate still more changeable (Figure 5-5-1).
Fig. 5-5-1 Examples of Climate Cassification
Climate and topography are important factors that characterize the natural environments of particular lands, but, as it has seen in the previous chapters, the global warming due to the increase in carbon dioxide concentration, etc., the increase in the amount of exposure to ultraviolet rays accompanying the depletion of the ozone layer due to Freon, etc. and the acid deposition due to the air polluting substances of sulfur oxides and nitrogen oxides are affecting the natural environment throughout the world in various ways and Japan's natural environment, also, is beginning to be affected.
(2) Vegetation and man-made surfaces
In the result of the Vegetation Survey of the 3rd National Survey on Natural Environment compiled in 1988, 92.7% of the land of the entire country is covered by some kind of vegetation (greenery), includ- ing vegetation on cultivated land and afforested areas besides substitute vegetation and natural vegetation. Of that, forests occupy 62.5% of the nation's land and the percentage of forest, even viewed from a global perspective, is high.
Natural vegetation, such as natural forests and natural grassy plains, are dispersed in areas where it is difficult for people to go, such as outlying islands, peninsulas and steep mountains. As for such places as gently undulating mountains, hills and level areas, the percentage occupied by cultivated land, afforested areas and substitute vegetation, such as secondary grassy plains and secondary forests, has become high. Further, in the vicinities of cities, areas are spreading where there is a lack of greenery when the urban area is taken as a whole, and the present situation in the entire country is that natural greenery remains in limited areas.
Natural vegetation that maintains the natural condition, that is, the vegetation zone of 1) creeping pine and the high mountain vegetation that is representative of the frigid zone and high mountain zone vegeta- tion, 2) sub-high mountain zone vegetation, such as silver fir, fir, birch, Aomori fir, that excels in subarctic zones, 3) Beech japonicae Regior natural vegetation, such as Japanese beech forests and Acer mono v. glabrum-Tilia japonica community, 4) Camellietea japonicae Regior natural vegetation, such as chinquapin, oak and Machilus thunbergil, 5) river's edge, marshland, salt marsh area and sand dune vegetation, in all, comprise 19.3 % of the entire nation. When the distribution of natural vegetation is looked at, 58.7%, over half, is distributed in Hokkaido. Other than this, most is in Tohoku as well as the Chubu mountain area, on the Sea of Japan side and in Okinawa. Meanwhile, in Kinki, Chugoku and Kyushu the distribution has become extremely small and the small areas are only scattered on the tops of mountain areas, peninsulas and outlying islands (Figure 5-5-2).
Vegetation, generally, changes with the passage of time and, ultimately, becomes a climax that is a stable ecological condition. In Japan's climate, 1) the forests of evergreen broad-leaved trees (glossy leaf tree), such as Japanese beech, oak and chinquapin, that spread from the southwestern islands to the northeast, 2) the forests of deciduous broad-leaved trees, such as Japanese beech that spread in cold areas rather than the evergreen broad-leaved trees, from southern Kyushu to southern Hokkaido, 3) the mixed forests of needle and broad-leaved trees spreading in Hokkaido of the deciduous broad-leaved trees, such as oak, and the needle leaved trees, such as silver fir and fir, and 4) the frigid zone needle leaved tree forests of which silver fir and fir trees are typical, show the typical climatic characteristics. In the regions in which the typical natural characteristics of Japan are abundantly shown this kind of climatic vegetation can be seen, but there are not necessarily many of these regions.
Fig. 5-5-2 Vegetation by Region
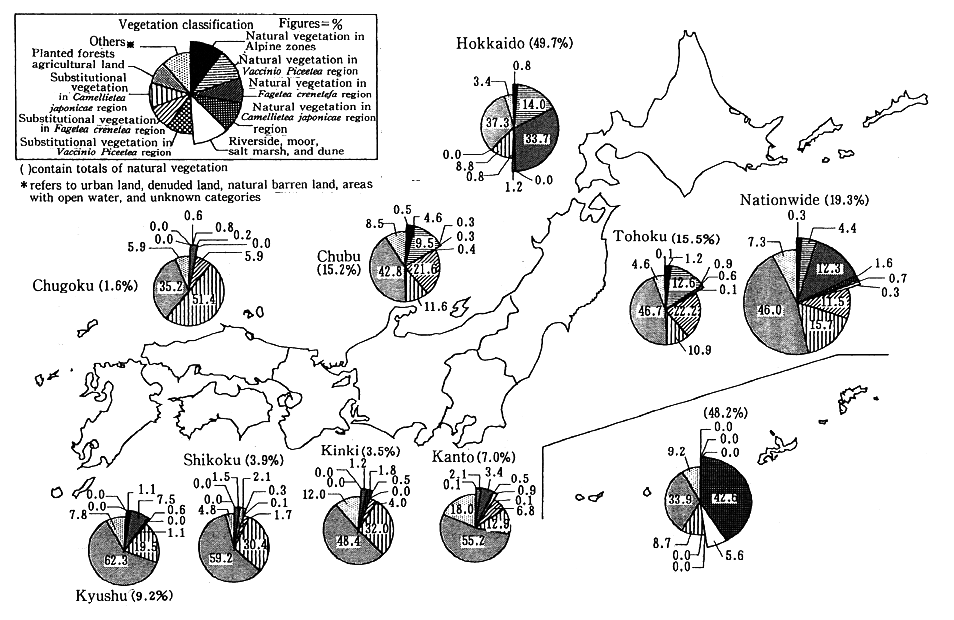
Reference : Third National Survey on the Natural Environment, 1989
When the relation between Japan's typical natural vegetation and temperature (warmth index: warmth indices of warmth or coldness) is looked at, it is as in Figure 5-5-3. A warmth index is a type of integrated temperature that is the result of a calculation that assumes that the months in which the average temperature is above 5 degree C are periods during which plants are able to grow, and that the months in which, on the contrary, 5 degree C is not reached are periods of no growth. The warmth index is found by adding the values found when 5 degree C is subtracted from the average temperature of the months in which the average monthly temperature is over 5 degree C Further, the coldness index is the result of adding the values of the months in which the average monthly tempera- ure did not reach 5 degree C after first subtracting 5 degree C from each of them. As a result it can be seen that silver fir, fir, and Japanese beech forests as well as Castanopsis cospidata var, sieboidii forests that are typical of glossy leaved forests, are distributed in regions where the warmth is, basically, different.
Fig. 5-5-3 Frequency Distribution of the Warmth Index for Highly Natural Types of Vegetation
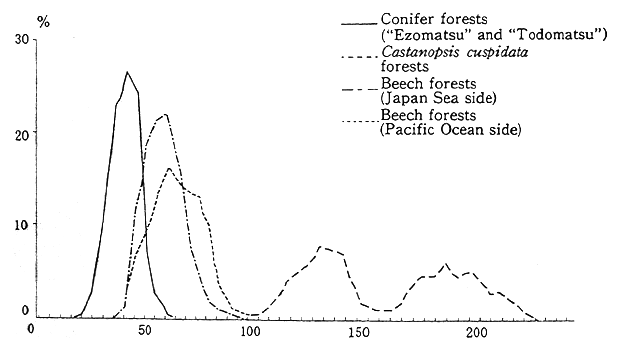
Reference : Third National Survey on the Natural Environment,Comprehensive Report
The fact that the change in temperature due to the global warming that was seen in Section 1 of this chapter has a great effect on vegetation has caused anxiety. According to the IPCC report, the predicted average temperature increase by the year 2025 is about 1 degree C and by the end of the 21st century about 3 degree C, but assuming that the average temperature each month under the same conditions as now increases 1 degree C or 3 degree C, for example, the Sapporo warmth index that is equivalent to the climatic conditions at the southern limit of the distribution of the appearance of silver fir and fir forests at a warmth index now of 69.4 degree C•month will become 76.7 degree C•month in the year 2025 and 92.7 degree C•month at the end of the 21st century. This means that a great influence on vegetation can be predicted due to Sapporo, at the stage of the year 2025, leaving the range of the warmth index in which silver fir and fir forests can appear and, further, over the 21st century coming into the range of the warmth index in which Japanese beech forests appear. Because it can be predicted that changes in the temperature will be greatly different depending on the region and the season, it is not possible to draw a simple conclusion, but the possibility that global warming will also have a great influence on Japan's vegetation cannot be denied (refer to Chapter 3 Section 3,2).
When Japan's vegetation is viewed by sections of degree of naturalness, forests, combining natural forests, secondary forests and afforested areas, are on about two thirds of the nation's land, and afforested areas that are vegetation that is brought into existence by human acts occupies 24.7% of the nation's land and is distributed in extensive regions of the country. Further, farm land, urban land and reclaimed land combined occupies 26.7%, amounting to one fourth of the nation's land (Table 5-5-1).
When the increase and decrease in the composition ratio of the nation's land is looked at, forests as a whole have remained virtually unchanged with an increase of 0.2%, but natural forests and secondary forests combined have decreased 3.9% and afforested areas have increased 4.1%. Rather a large part of the natural forests and secondary forests can be regarded as having been changed to afforested areas. Further, farm land has decreased by 1.8% while urban land, etc., has increased by 1.5% (Table 5-5-2). As for vegetation nationwide it can be said that its degree of naturalness is declining and the reduction of greenery is progressing, such as, concerning forests, the increase in forests with a low degree of naturalness and, besides forests, the increase in urban land where a sizable amount of greenery cannot be seen.
Table 5-5-1 Frequency of Vegetation Appearance by Degree of Human Disturbance
Source : Environment Agency, Vegetation Survey of the second and third National Survey on the Natural Environment
Table 5-5-2 Changes in Vegetation Classified by Degree of Human Disturbance
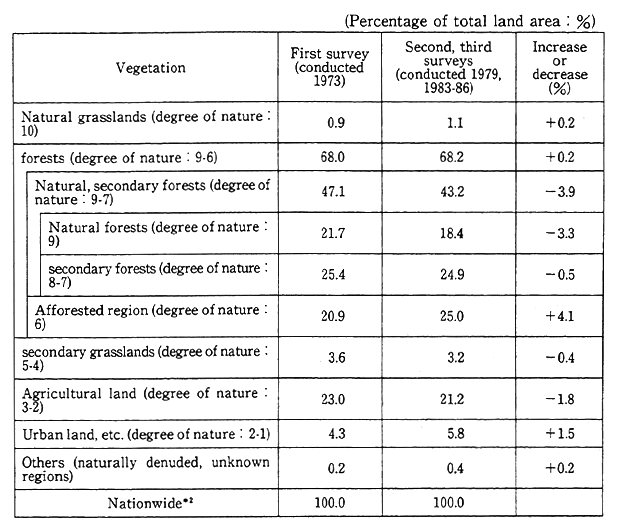
Notes
* 1 : Residential areas with much greenery are included in "Urban land, etc.".
* 2 : Not including "open water areas
Because open water areas weren't included in the data of the first survey, when comparing it to the results of the second and third surveys the composi- tion percentages were calculated with respect to the entire nation with the open water areas omitted and these increases and decreases can be seen.
Consequently, concerning the results of the second and third surveys, be careful of the difference between the composition percentages of Table 5-5-1 and the composition percentages of this table.
Source : Environment Agency, Vegetation Survey of the National Survey on the Natural Environment
On land that is close to the area where human activities are active, such as flat land and hilly land, there is farm land and many secondary forests and afforested areas. Secondary forests are composed of forests with miscellaneous trees, such as the Quercus mongolica forests in the Beech japonicae Regior, the Quercus serrata forests and Quercus acutissima forests of Camellietea japonicae Regior, as well as pine forests, chinquapin forests and forests of oak sprouts. Most are forests that have come to be maintained through human activity, such as the collecting of fallen leaves and the weeds beneath trees for use as fertilizer, etc. and the collecting of fuel. These have come to be widely familiar precious green areas as nature that is close to people in their daily lives, but because human intervention has rapidly decreased due to the depopulation of mountain villages and the reduction in the use of secondary forests, the form of secondary forests is changing.
Meanwhile, according to the previously mentioned divisions of vegetation's degree of naturalness, the man-made ground surface areas where nature is scarce (i. e. urban areas), such as roads and structures, houses, buildings and factories, during the same period have been increasing from 4.3% to 5.8%. Man-made ground surface areas, when viewed as inside the circulation of natural substances, are unique. For example, it is difficult for rainwater to permeate into man-made ground areas, compared to forest areas, i. e., forest areas have about 20 times the ability to permit permeation as do sidewalks. Further, trees, by the action of evaporation and dispersion, because evaporation heat is con- sumed, protect against rising temperatures, and at the same time supply moisture to the air and protect against drying. Besides, trees display the various abilities of adsorbing pollutants and protecting against sound, but these functions are becoming rarer on ground surface areas where there are few trees. Because man-made heat is discharged from various human activities on man-made ground surfaces there is a tendency towards higher temperatures and more dryness than in the natural climate and there is concern about whether or not they also have an influence on the nation's natural environment.